 Open Access Article
Hazardous o-toluidine mineralization by photocatalytic bismuth doped ZnO slurries†
G.
Cappelletti
*a,
V.
Pifferi
a,
S.
Mostoni
a,
L.
Falciola
a,
C.
Di Bari‡
a,
F.
Spadavecchia§
a,
D.
Meroni
a,
E.
Davoli
b and
S.
Ardizzone
a
aDipartimento di Chimica, Università degli Studi di Milano, via Golgi 19, 20133, Milano, Italy. E-mail: giuseppe.cappelletti@unimi.it; Fax: +390250314228; Tel: +390250314228
bIRCCS Istituto di Ricerche Farmacologiche “Mario Negri”, via La Masa 19, 20156, Milano, Italy
First published on 18th May 2015
Abstract
Photocatalytic mineralization of o-toluidine in aqueous media under UV/solar irradiation was achieved by bare and bismuth doped zinc oxide nanoparticles. By adopting different analytical approaches a reaction mechanism is proposed, explaining the differences in photodetoxification performances.
Nowadays environmental pollution has become a very diffuse topic for scientific research and several articles deal with the development of innovative techniques and materials for treatments of both wastewaters and polluted air.1 In this context, photocatalysis has great potential as a green technique for the depollution of several organic and inorganic toxic molecules.
The role of photocatalysis has to be related to the use of semiconductor materials, especially TiO2, which in recent years has assisted to a great expansion.2–5 Zinc oxide has been introduced in heterogeneous photocatalytic treatments as an alternative material to TiO2, thanks to its similar properties: high photosensitivity, non-toxicity, low cost, and competitive photocatalytic activity. In particular, ZnO presents a band gap of 3.37 eV, with a red shift down to 3.2 eV due to the agglomeration of nanocrystallites into larger ones.6,7 Recently, along with their traditional application fields (e.g. coatings and cosmetics), ZnO nanopowders have been used as photocatalysts (next to TiO2) for environmental remediation both in aqueous and gas phases.8–11 Furthermore, some pioneering papers demonstrate the possibility of coupling ZnO with TiO2.12,13 The best performances for nanosized ZnO can be reached either by modifying the strategy of synthesis14 or by doping the material with different species, including transition metals (Mn and Cu) but also rare earth elements (La and Er).15,16 Also bismuth has been tested as a dopant, proving its ability to shift the adsorption edge of ZnO (reducing the band gap of the material) to lower energy, exploiting solar light and modifying the separation rate of photoinduced charge carriers.17–19 Bismuth is a great alternative to noble metals since it is cheaper, non-toxic and environmentally friendly material; besides, it is also able to favour trapping of photo-generated electrons, reducing the rate of recombination processes between electrons and holes.20–22
In the present communication a study of both bare (a commercial oxide available from Sigma Aldrich) and bismuth doped ZnO nanopowders (obtained by impregnation of the commercial one with Bi/Zn molar ratios in the range of 0.01–0.03) was performed with the aim of photodegrading o-toluidine. This pollutant, an aromatic amine, has been chosen because of its high toxicity and carcinogenic properties for animals and humans23,24 even at low levels of concentration. This pollutant is present in the environment due to its use in industries as precursors in the synthesis of azo-dyes, in the rubber industry and pharmaceutical production. The present work is focused on the comparison between the doped and undoped materials, considering the role of their morphological and structural properties in imposing final photodegradation performances. Moreover, the complete mineralization of o-toluidine requires an efficient treatment process, because byproducts could be even harmful than the precursors. Further, a comparison between solar and UV irradiation was made. Previous studies describe the removal of o-toluidine particularly in the gas phase, as reported for example by An et al.,25 using films of TiO2 under UV irradiation. Only a single study could be found in the literature about the removal of o-toluidine in the liquid phase by zinc oxide nanopowders,10 but to the best of our knowledge no investigations regarding the improvement obtained by the addition of bismuth or other dopants are present.
All the ZnO nanopowders were finely characterized from morphological (N2 adsorption isotherm, electron microscopy), optical (diffuse reflectance spectra) and structural (X-ray diffraction) points of view. The addition of bismuth provokes a dramatic loss of the surface area (Table 1, 2nd column) passing from 12 m2 g−1 for the commercial sample to values lower than 2 m2 g−1 for all the doped ones.
| Sample | S BET (m2 g−1) | 〈d〉XRD (nm) | EDX Bi/Zn (atomic %) | Band gap (eV) |
|---|---|---|---|---|
| ZnO | 12 | 64 | — | 3.14 |
| ZnO_0.01Bi | <2 | 91 | 0.017 | 2.97 |
| ZnO_0.02Bi | <2 | 93 | 0.038 | 2.93 |
| ZnO_0.03Bi | <2 | 98 | 0.052 | 2.94 |
All the samples show X-ray diffraction peaks that can be indexed to hexagonal wurztite structural ZnO (Fig. S1, ESI†), and match well with standard hexagonal ZnO (a = 3.249 Å and c = 5.205 Å, JCPDS Card No. 005-0664). A segregate Bi2O3 phase (bismite) is appreciable by increasing the amount of dopant species. The sharp and narrow diffraction peaks (Fig. S1, ESI†) reveal that all the crystallites are not extremely small (Table 1, 3rd column). Particularly, Z_comm shows high crystalline and ordered ZnO nanocrystals with a pseudo-hexagonal shape10 (Fig. S2a, ESI†, TEM image); the Bi-doped nanopowders are more packed and disordered forming compact agglomerates in which Bi-enriched wires are evidenced (Fig. S2b, ESI†). Nevertheless, EDX maps show a homogeneous bismuth distribution all over the impregnated powders (Fig. S3d, ESI†, STEM/EDX); besides the amount of dopant (Table 1, 4th column) is always comparable to the starting concentration. Further, the STEM/EDX line profile (Fig. S3e and h, ESI†) of ZnO_0.01Bi shows a higher Bi-enrichment on the edges, which seems to indicate a Bi loading instead of lattice doping.
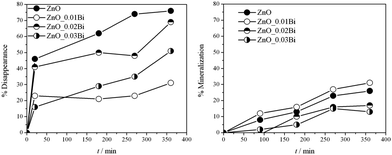
All the samples were tested for o-toluidine photocatalytic detoxification in slurry under UV irradiation (Jelosil HG 500 W, λ = 280–400 nm, effective power density 57 mW cm−2). Fig. 1 shows the % disappearance (obtained by Linear Sweep Voltammetry, LSV, Fig. S4, ESI†) and the relative mineralization (obtained by total organic carbon, TOC analyses) of o-toluidine as a function of reaction time for both bare and Bi-doped samples. It is worth noting that notwithstanding the lower disappearance efficiency of the doped samples with respect to the bare one, the Bi-doped materials seem to have similar mineralization performances. Moreover, in the case of ZnO_0.01Bi a slight increase of mineralization occurs. Even if the pure ZnO allows reaching the higher percentage of disappearance for the o-toluidine, a major quantity of byproducts is formed with respect to the sample ZnO_0.01Bi; instead, while using the latter sample almost all the disappeared o-toluidine is converted to carbon dioxide, with more benefits from an environmental point of view. Thus, the gap between o-toluidine removal and its final mineralization suggests the occurrence of a complex kinetic pattern. So a more complete picture of the possible byproducts can be drawn by exploiting LC/MS analyses.
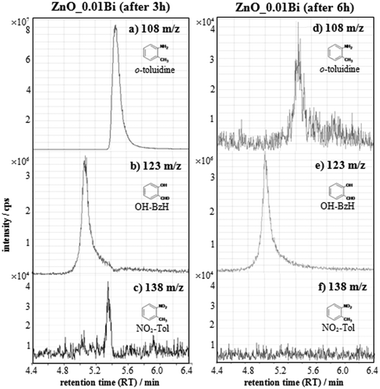
HPLC–MS chromatograms of degradation products are shown in Fig. 2. Ions are formed by electrospray ionization (ESI†) and appear as protonated ions, [M+H]+. The results show that, while using both bare and doped ZnO, o-toluidine (m/z 108, 5.5 min RT, Fig. 2a and d and 4.8 min retention time (RT) Fig. S5a and c, ESI†) is partially degraded. In the case of a bare ZnO sample, a new peak at 5.33 min retention time (Fig. S5c, ESI†) is observed. A possible structure assignment is a dimer product, through an azo N![[double bond, length as m-dash]](https://www.rsc.org/images/entities/char_e001.gif) N bond, as already reported in the literature.26 High resolution experiments, performed on an LTQ XL Orbitrap MS mass spectrometer (Thermo Fisher), operated at 50.00 resolution, seem to confirm this hypothesis with a<3 ppm mass accuracy assignment error (Fig. S6, ESI†). In all cases production of 2-hydroxybenzaldehyde (OH–BzH m/z 123, at 5.0 min RT, Fig. 2b and e and at 4.4 min RT, Fig. S5d, ESI†) is evident. For Bi-doped samples this compound was present even after 3 hours, whereas for bare ZnO this degradation product appears only after 6 hours. Moreover, only in the case of Bi-doped ZnO nanoparticles, o-nitrotoluene (NO2–Tol, m/z 138) formation is observed after 3 hours (Fig. 2c), while under these experimental conditions, it was undetectable after 6 hours (Fig. 2f).
N bond, as already reported in the literature.26 High resolution experiments, performed on an LTQ XL Orbitrap MS mass spectrometer (Thermo Fisher), operated at 50.00 resolution, seem to confirm this hypothesis with a<3 ppm mass accuracy assignment error (Fig. S6, ESI†). In all cases production of 2-hydroxybenzaldehyde (OH–BzH m/z 123, at 5.0 min RT, Fig. 2b and e and at 4.4 min RT, Fig. S5d, ESI†) is evident. For Bi-doped samples this compound was present even after 3 hours, whereas for bare ZnO this degradation product appears only after 6 hours. Moreover, only in the case of Bi-doped ZnO nanoparticles, o-nitrotoluene (NO2–Tol, m/z 138) formation is observed after 3 hours (Fig. 2c), while under these experimental conditions, it was undetectable after 6 hours (Fig. 2f).
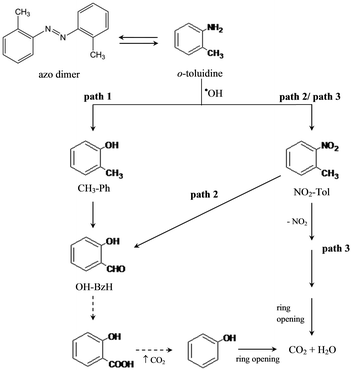
Thus, on the basis of the identified byproducts, different photodegradation pathways are proposed in the following scheme (Fig. 3). Apart from the two pathways (pathways 1 and 2, Fig. 3) already described in the recent literature10,25 for commercial zinc oxide, in the case of Bi doped samples a further reaction mechanism (pathway 3, Fig. 3) could be proposed to corroborate the best mineralization performances (see Fig. 1).
 | ||
| Fig. 3 Three main proposed mechanisms for the photocatalytic removal of o-toluidine in aqueous media. | ||
In this case (pathway 3) o-toluidine can be oxidized to NO2–Tol and successively the elimination of the NO2 group occurs; then a ring opening step yields complete mineralization. Differently, both pathways 1 and 2 require the formation of 2-hydroxybenzaldehyde which, according to the literature,27,28 is a difficult step to overcome for the following oxidation.
In the case of the undoped powders the formation of the dimer justifies the high degree of o-toluidine disappearance not followed by its mineralization. Actually, from the electrochemical point of view, the dimer is undetectable29 because the NH2 electroactive group is substituted with a double N![[double bond, length as m-dash]](https://www.rsc.org/images/entities/char_e001.gif) N.
N.
In order to explain the improvement in mineralization of ZnO_0.01Bi, transient time constant (τ) values have been evaluated to assess the e−/h+ recombination rate30,31 under UV irradiation; for the doped ZnO_0.01Bi sample (Fig. S7, ESI†) τ is slightly better (7 ± 1 s) than that of the commercial one (4 ± 1 s), evidencing a better charge separation efficiency, justifying the photocatalytic results.
Besides, interesting results are also obtained by substituting UV light with a solar radiation source (Lot oriel, effective power density: 1 mW cm−2λ = 280–400 nm; 14 mW cm−2λ = 400–800 nm). Table 2 reports both the disappearance and mineralization percentages of the o-toluidine in the cases of commercial ZnO and ZnO_0.01Bi (the best sample under UV). The presence of the bismuth dopant limits the expected lowering of both degradation and mineralization with respect to the undoped sample passing from higher to lower irradiation energy. Notwithstanding the not yet optimized photocatalytic performances of the doped sample (Table 2), the removal of the o-toluidine molecule almost corresponds to the final mineralization, proving that only small amounts of noxious byproducts are present at the end of the reaction (after 6 h, Fig. 2).
| Sample | % Disappearance (LSV) | % Mineralization (TOC) | |
|---|---|---|---|
| ZnO | UV | 74 | 26 |
| Solar | 56 | 6 | |
| ZnO_0.01Bi | UV | 31 | 29 |
| Solar | 23 | 21 | |
Table 1 (5th column) reports the band-gap values obtained using the Kubelka–Munk method32 by elaboration of DR curves in terms of relative transformed reflectance vs. the photon energy (Fig. S8, ESI†). The lowering of the bang gap for the doped samples confirms the shift of the absorption edge towards the visible region, guaranteeing the best mineralization under solar light.
The present investigation has paved the way for tailoring new zinc oxide materials doped with bismuth for the degradation of toxic emerging pollutants with enhanced performances. Further studies are required to enhance the surface area of the doped nanoparticles, to increase the pollutant adsorption, and concomitantly to design new materials capable of addressing the sought pathway 3, completely eliminating noxious intermediates.
We thank Dr Marcello Marelli from CNR-ISTM/ISTeM for TEM measurements.
Notes and references
- A. R. Ribeiro, O. C. Nunes, M. F. R. Pereira and A. M. T. Silva, Environ. Int., 2015, 75, 33–51 CrossRef CAS PubMed.
- C.-S. Kuo, C.-F. Lin and P.-K. A. Hong, Water Res., 2015, 74, 1–9 CrossRef CAS PubMed.
- M. A. Rauf, M. A. Meetani and S. Hisaindee, Desalination, 2011, 276, 13–27 CrossRef CAS PubMed.
- S. Ardizzone, G. Cappelletti, D. Meroni and F. Spadavecchia, Chem. Commun., 2011, 47, 2640–2642 RSC.
- G. Cappelletti, S. Ardizzone, C. L. Bianchi, S. Gialanella, A. Naldoni, C. Pirola and V. Ragaini, Nanoscale Res. Lett., 2009, 4, 97–105 CrossRef CAS PubMed.
- J. I. Pankove, Optical processes in semiconductors, Prentice-Hall, New York, Dover, 1975 Search PubMed.
- R. Udayabhaskar and B. Karthikeyan, J. Appl. Phys., 2014, 116, 094310 CrossRef PubMed.
- M. Pudukudy and Z. Yaakob, Superlattices Microstruct., 2013, 63, 47–57 CrossRef CAS PubMed.
- N. Sobana and M. Swaminathan, Sep. Purif. Technol., 2007, 56, 101–107 CrossRef CAS PubMed.
- V. Pifferi, G. Cappelletti, S. Ardizzone, L. Falciola, C. Di Bari, F. Spadavecchia, D. Meroni, A. Carrà, G. Cerrato, S. Morandi and E. Davoli, Appl. Catal. B: Environ., 2014 DOI:10.1016/j.apcatb.2014.08.043.
- V. Pifferi, G. Cappelletti, C. Di Bari, D. Meroni, F. Spadavecchia and L. Falciola, Electrochim. Acta, 2014, 146, 403–410 CrossRef CAS PubMed.
- G. Marci, V. Augugliaro, M. J. Lopez-Munoz, C. Martin, L. Palmisano, V. Rives, M. Schiavello, R. J. D. Tilley and A. M. Venezia, J. Phys. Chem. B, 2001, 105, 1026–1032 CrossRef CAS.
- G. Marci, V. Augugliaro, J. Lo, L. Palmisano, V. Rives, M. Schiavello, R. J. D. Tilley and A. M. Venezia, J. Phys. Chem. B, 2001, 105, 1033–1040 CrossRef CAS.
- R. Saravanan, V. K. Gupta, V. Narayanan and A. Stephen, J. Mol. Liq., 2013, 181, 133–141 CrossRef CAS PubMed.
- J. C. Sin, S. M. Lam, K. T. Lee and A. R. Mohamed, Ceram. Int., 2014, 40, 5431–5440 CrossRef CAS PubMed.
- R. Zamiri, A. F. Lemos, A. Reblo, H. A. Ahangar and J. M. F. Ferreira, Ceram. Int., 2014, 40, 523–529 CrossRef CAS PubMed.
- S. Balachandran and M. Swaminathan, J. Phys. Chem. C, 2012, 116, 26306–26312 CAS.
- V. L. Chandraboss, L. Natanapatham, B. Karthikeyan, J. Kamalakkannan, S. Prabha and S. Senthilvelan, Mater. Res. Bull., 2013, 48, 3707–3712 CrossRef CAS PubMed.
- A. Senthilraja, B. Subash, P. Dhatshanamurthi, M. Swaminathan and M. Shanthi, Spectrochim. Acta, Part A, 2015, 138, 31–37 CrossRef CAS PubMed.
- S. Sajjad, S. A K. Leghari, F. Chen and J. Zhang, Chem. – Eur. J., 2010, 16, 13795–13804 CrossRef CAS PubMed.
- Z. Bian, J. Zhu, S. Wang, Y. Cao, X. Qian and H. Li, J. Phys. Chem. C, 2008, 112, 6258–6262 CAS.
- D. Meroni, V. Pifferi, B. Sironi, G. Cappelletti, L. Falciola, G. Cerrato and S. Ardizzone, J. Nanopart. Res., 2012, 14, 1086 CrossRef.
- K. Gaber, U. A. Harréus, C. Matthias, N. H. Kleinsasser and E. Richter, Toxicology, 2007, 229, 157–164 CrossRef CAS PubMed.
- L. Lüersen, T. Wellner, H. M. Koch, J. Angerer, H. Drexler and G. Korinth, Arch. Toxicol., 2006, 80, 644–646 CrossRef PubMed.
- T. An, L. Sun, G. Li and S. Wan, J. Mol. Catal. A: Chem., 2010, 333, 128–135 CrossRef CAS PubMed.
- Y. Takeda, S. Okumura and S. Minakata, Angew. Chem., Int. Ed., 2012, 51, 7804–7808 CrossRef CAS PubMed.
- F. J. Benitez, J. Beltran-Heredia, T. Gonzalez and F. Real, J. Environ. Sci. Health, Part A: Environ. Sci. Eng. Toxic Hazard. Subst. Control, 1997, 32, 2599–2612 CrossRef PubMed.
- S. Ardizzone, C. L. Bianchi, G. Cappelletti, A. Naldoni and C. Pirola, Environ. Sci. Technol., 2008, 42, 6671–6676 CrossRef CAS.
- L. Falciola, V. Pifferi and E. Mascheroni, Electroanalysis, 2012, 24, 767–775 CrossRef CAS PubMed.
- R. Dholam, N. Patel, A. Santini and A. Miotello, Int. J. Hydrogen Energy, 2010, 35, 9581–9590 CrossRef CAS PubMed.
- D. Tafalla, J. Electrochem. Soc., 1990, 137, 1810 CrossRef CAS PubMed.
- D. Meroni, S. Ardizzone, G. Cappelletti, C. Oliva, M. Ceotto, D. Poelman and H. Poelman, Catal. Today, 2011, 161, 169–174 CrossRef CAS PubMed.
Footnotes |
| † Electronic supplementary information (ESI) available: The impregnation method, morphological and structural characterization, degradation experiments, oxidation intermediate products, photocurrent measurements, and optical properties. See DOI: 10.1039/c5cc02620b |
| ‡ Present address: Istituto de Catalisis y Petroleoquimica, Consejo Superior de Investigaciones Cientificas, C/ Marie Curie 2, L10, 28049 Madrid, Spain. |
| § Present address: Eni S.p.A – Refining & Marketing Division, San Donato Milanese Research Center, via F. Maritano 26, I-20097 San Donato Milanese (MI), Italy. |
| This journal is © The Royal Society of Chemistry 2015 |


