
 Open Access Article
 This Open Access Article is licensed under a Creative Commons Attribution-Non Commercial 3.0 Unported Licence
Surface roughness-induced speed increase for active Janus micromotors†
Udit
Choudhury‡
a,
Lluís
Soler‡
 ab,
John G.
Gibbs
ac,
Samuel
Sanchez
*ade and
Peer
Fischer
af
ab,
John G.
Gibbs
ac,
Samuel
Sanchez
*ade and
Peer
Fischer
af
aMax-Planck Institute for Intelligent Systems, Heisenbergstr. 3, 70569 Stuttgart, Germany. E-mail: sanchez@is.mpg.de
bInstitute of Energy Technologies, Universitat Politècnica de Catalunya, Diagonal 647, 08028 Barcelona, Catalonia, Spain
cDepartment of Physics and Astronomy, Northern Arizona University, S. San Francisco Street, Flagstaff, Arizona 86011, USA
dInstitució Catalana de Recerca i Estudis Avancats (ICREA), Passeig Lluís Companys 23, 08010 Barcelona, Spain
eInstitut de Bioenginyeria de Catalunya (IBEC), Baldiri I Reixac 10-12, 08028 Barcelona, Spain. E-mail: ssanchez@ibecbarcelona.eu
fInstitute for Physical Chemistry, University of Stuttgart, Pfaffenwaldring 55, D-70569 Stuttgart, Germany
First published on 16th April 2015
Abstract
We demonstrate a simple physical fabrication method to control surface roughness of Janus micromotors and fabricate self-propelled active Janus microparticles with rough catalytic platinum surfaces that show a four-fold increase in their propulsion speed compared to conventional Janus particles coated with a smooth Pt layer.
The use of catalytic reactions for self-propulsion of micro and nanoparticles is a well-established means to move colloidal particles in solution at low-Reynolds number.1,2 The colloids must be anisotropic in their material properties for them to generate any active propulsion. For that purpose, Janus spheres with two different faces have been fabricated, including platinum/insulator Janus micro spheres, platinum/gold bimetallic nanoparticles and nanorods, and platinum-coated microtubular jets.2–9 The propulsion in these micromotors arises from the decomposition of hydrogen peroxide (H2O2) at the platinum (Pt) surface. While a number of studies have focussed on developing new propulsion systems,10–12 there have been only a few studies examining the effect of the surface morphology on catalytic self-propulsion.13–15
It is well known that the catalytic activity is directly related to the surface area of the catalyst and can thus be influenced by introducing nanoscale surface-features to increase the effective surface area.16 This is commonly used to increase the surface area of conducting electrodes in electrochemical reactions.17 Hence, one could expect that the incorporation of nanoscale features on the catalytic face of catalytic micro/nanomotors should also lead to a higher effective area. This should consequently lead to a higher net turn-over and thus higher propulsion speeds.
Ozin et al. studied the motion of electrochemically fabricated rough bimetallic rods produced by incorporating Ludox®silica nano-particles in the electroplating solution for bimetallic nano-rods.13 Wang et al. included carbon nanotubes into the Pt plating solution and obtained much faster speeds of the Au–CNT/Pt nanowires compared with Au–Pt ones.14 For polystyrene/Pt Janus microspheres a shift in the propulsion mechanism from diffusiophoresis to bubble propulsion was observed after chemically roughening the surface.15 Increasing the surface roughness of Pt in Pt/insulator Janus particles is, however, not straightforward. First, insulating particles do not lend themselves to direct electrochemical fabrication and typical physical vapour deposition (PVD) methods usually yield smooth surfaces. Further, bimetallic micromotors grown electrochemically have limitations in propulsion in high ionic media. This necessitates exploring different material configurations for studying microscale propulsion for which physical vapour deposition is a simple and widely used scheme.
Here, we present a facile method to obtain roughness using PVD. Commonly, Janus particles are grown by sputtering or evaporating a layer of Pt onto silica or polystyrene beads. Pt by itself does not, in general, form rough surfaces. Here we show that by first depositing an under-layer of silica before depositing the Pt introduces nanoscale roughness on the Janus particles and that this then automatically yields a rough Pt surface. We demonstrate that this leads to a four-fold speed increase compared to particles with a smooth surface. The reaction rates for catalytic propulsion were derived assuming a diffusiophoretic model of propulsion which shows a similar two to four fold increase in turnover rates for rough micromotors. The effect of roughness on catalytic activity was further verified by oxygen evolution tests and observation of the surface topology by SEM.
The morphology of thin films grown by glancing angle deposition (GLAD), a variant of PVD, where the substrate is tilted relative to the vapour flux to induce shadowed film growth, whilst permitting azimuthal rotation, depends on the deposition rate, the angle of the incident vapour and the material properties. Nanoscale morphology on a plane substrate can be introduced by tilting the substrate at a high angle relative to the vapour flux to induce self-shadowing during the growth.18,19 Substrate rotation under glancing angle deposition can promote columnar growth of nanostructures.18 However, metals have higher surface mobilities than (metal) oxides and will therefore diffuse on the substrate easily to form smoother surfaces compared to oxides. This effectively inhibits pure metal thin films, including Pt, from forming rough surfaces.
In this work, we have explored two different growth techniques to introduce roughness on smooth silica spheres. We first prepared a dense monolayer of silica beads (5 μm diameter) by drop-casting a diluted suspension of beads onto a clean silicon wafer. After drying, we placed the wafer in a vacuum PVD system. Two types of rough Pt Janus particles were grown, named R1 and R2. Both preparation methods are described below:
R1: preparation of Pt Janus micromotors under nominally normal incidence: 80 nm of SiO2 was deposited by an e-beam evaporator at 0° (normal incidence) as the first layer onto the silica beads followed by 7 nm of titanium (Ti) and 20 nm of Pt (Fig. 1a). Ti serves as an adhesion layer. The vapour flux necessarily impinges on the curved surfaces of the silica beads with varying angles of incidence: 90° at the equator to 0° at the pole. This procedure promotes patchy growth on the particle surface (as can be seen in Fig. 1c).
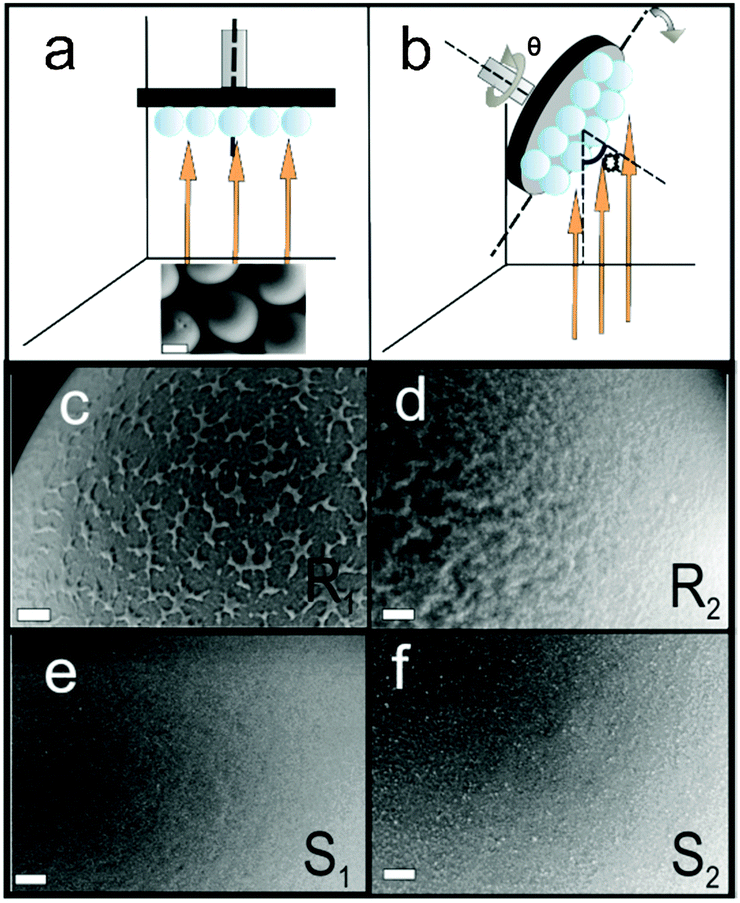 | ||
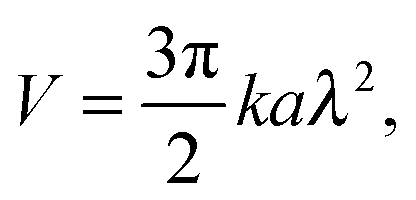
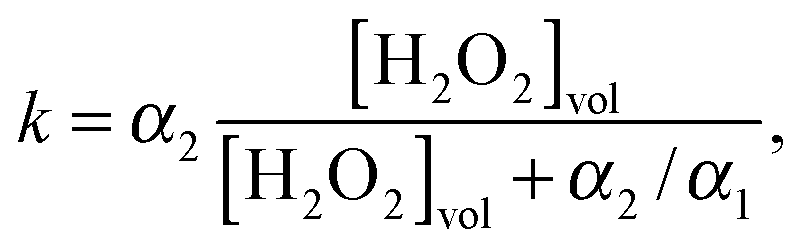
| Fig. 1 Schematic of the PVD fabrication method and images of Janus micromotor surfaces. (a) Particles R1, S1 and S2 were fabricated by keeping the substrate at fixed position. SiO2 was initially deposited for R1 and subsequently Ti and Pt were deposited. Orange arrows indicate the direction of the incoming vapour flux. (b) Particle R2 was fabricated by continuously rotating the substrate at 5 rpm and changing α from 87° to 0° while SiO2 was evaporated. Subsequently, titanium and platinum was evaporated by keeping the substrate fixed at 0°. The scale bar in the image (a) is 2 μm. (c)–(f) Morphology of particles R1, R2, S1 and S2, respectively. The SEM images are captured by an SE2 detector. The scale bar for the images (c)–(f) is 200 nm. | ||
R2: preparation of Pt Janus micromotors under nominally oblique angles: to stimulate growth of columnar structures on the surface of the microspheres the deposition of SiO2 was performed by tilting the substrate inside the e-beam evaporation chamber. This resulted in high angles of incidence (α = 87° at the pole, Fig. 1b). In addition, the substrate was rotated about the azimuth at five revolutions per minute (Fig. 1b). Keeping the azimuthal rotation speed constant, the substrate tilt angle α was continuously swept from 87° to 0° to ensure even hemispherical coverage of the surface of the microsphere (Fig. 1b). The SiO2 deposition is followed by a 7 nm layer of Ti and then a 20 nm layer of Pt, both at nominally normal (0°) incidence. It is important to note that the same amount of SiO2 is deposited in both fabrication procedures R1 and R2.
To facilitate the direct comparison with conventional fabrication of spherical Janus micromotors, we fabricated two different types of Janus particles for control purposes, named S1 and S2, which are described below:
S1: 7 nm Ti and 20 nm Pt were evaporated keeping the substrate fixed at 0° on a monolayer of silica beads (see Fig. 1a).
S2: 80 nm of Ti and 20 nm of Pt were evaporated while keeping the substrate fixed at 0° to ensure that the particles exhibit a diameter comparable to the Janus particles of R1 and R2. However, here the Pt surface is smoother than for the particles in R1 and R2 due to the higher surface mobility of the Ti adatoms. The surface-smoothness is comparable to the particles in S1.
To determine the surface morphology of the silica spheres qualitatively, the samples were examined by scanning electron microscopy (SEM). The images in Fig. 1c–f suggest the topological differences between the coated surfaces. While the top surface of R1 shows small patches of silica on the surface of the microsphere, the surface of R2 shows a wrinkled surface texture caused by self-shadowing. The coated surfaces of particles S1 and S2 have in contrast a smoother topology.
To estimate the influence of the surface roughness on the catalytic activity of the Pt decomposition of H2O2, we have performed oxygen (O2) evolution experiments. In order to permit quantitative measurements we chose to perform the O2 evolution tests on Si wafer-pieces (1 cm × 2 cm) coated with smooth and rough Pt surfaces, rather than surfaces covered with the silica particles. Silica particles do not form completely close-packed monolayers causing high variability in the particle covered surface and hence the total surface area. The smooth wafers were prepared by depositing Ti (7 nm) and Pt (20 nm) at 0° as shown in Fig. 1a. The rough wafer was prepared by first depositing SiO2 under glancing angle (as shown in Fig. 1b) and subsequently coated with Ti (7 nm) followed by Pt (20 nm) at 0°. The wafers therefore mimic the surface morphology of particles R2 (rough) and particles S1 and S2 (smooth). The roughness for the particle R1 is due to the surface curvature of the silica spheres and hence cannot be mimicked by a planar wafer.
After the deposition, each wafer piece was immersed in a 100 cm3 Pyrex glass reactor containing 75 mL of 10% H2O2 at room temperature. The detailed experimental setup to measure the evolution of gases from reactions in aqueous solutions is described elsewhere.20 Here we only give a brief description of the experimental details. The generation of O2 started as soon as the wafer covered with catalytically-active Pt came into contact with the H2O2 solution. Oxygen produced by the decomposition of H2O2 escapes from the reactor via a silicone tube, which was then passed through a water bath at room temperature and collected in an inverted burette filled with water. The volume of the generated oxygen was deduced (at 298 K and 1 atm) from the water level change in the burette. The maximum rates of O2 evolution were determined from the maximum slope of the experimentally determined O2 generation curves. The maximum O2 evolution rate for rough Pt was found to be 1.8 mmol O2 cm−2 Pt min−1 and for smooth Pt was 0.6 mmol O2 cm−2 Pt min−1.
The particles were tracked for 20 s at 30 fps with a Leica optical microscope (Fig. 3) and the trajectories of 10 particles were combined to determine the average speed and the mean squared displacement (MSD) (see Fig. 4 and Videos R1, R2, S1 and S2, ESI†).
At low H2O2 concentration (0.5%) the speeds of all particles are low and within the experimental accuracy no differences can be observed. For higher concentrations the speed of the smooth particles S1 and S2 compare well to the literature value for 5 μm particles21 and are comparable for all measured H2O2 concentrations. At 5% H2O2 the mean velocities between the smooth and the rough particles diverge with R1 (9 μm s−1) and R2 (5 μm s−1) showing, respectively a 3 and a 1.5 fold increase over particles S1 (3 μm s−1) and S2 (2.5 μm s−1). At 15% H2O2 particle R1 propels at a mean speed of 13 μm s−1 compared to the 3 μm s−1 of particle S1.
The mean squared displacements (ΔL2) as a function of the time interval (Δt) were analyzed for individual concentrations to obtain the diffusion constant, Ddiff. For time scales shorter than the rotational diffusion time (τr), ΔL2 can be approximated as1,21
| ΔL2 = 4DdiffΔt + V2Δt2, | (1) |
The translational diffusivities of the smooth particles S1 and S2 remain close to the theoretically calculated value 0.1 μm2 s−1 for a 5 μm particle
| Ddiff = kBT/6πηR, | (2) |
The self-diffusiophoretic speed can be expressed in terms of surface reaction rate k as1
 | (3) |
The break down of H2O2 can be modeled as a two-step reaction with rate constants α1 and α2 as,1,21
 | (4) |
 | (5) |
We can solve the unknown reaction rate constants α1 and α2 as a function of the H2O2 concentration by fitting eqn (3) and (5) to the speed of particles R1, R2, S1 and S2 in Fig. 4a. We assume a = 1 Å and λ = 5 Å,1 and obtain the best fit line for eqn (3) to the speed data (see Fig. S2, ESI†). The experimentally determined reaction rates for different particles at 10% H2O2 concentrations are summarized in Table 1.
| α 1 (μm−2 s−1) | α 2 (μm−2 s−1) | k at 10% (μm−2 s−1) | |
|---|---|---|---|
| R1 | 2.49 × 10¹⁰ | 1.6 × 10¹¹ | 9.75 × 10¹⁰ |
| R2 | 2.42 × 10¹⁰ | 6.40 × 10¹⁰ | 5.06 × 10¹⁰ |
| S1 | 1.19 × 10¹¹ | 2.57 × 10¹⁰ | 2.51 × 10¹⁰ |
| S2 | 9.32 × 10¹⁰ | 2.50 × 10¹⁰ | 2.43 × 10¹⁰ |
Since the difference between the different particles is primarily due to a change in surface area, the change in reaction rate and speed can serve as an indirect measure for the surface area. Further, the speed as a function of the H2O2 concentration saturates at higher H2O2 concentrations.1,5 Therefore we can choose a concentration of 10% to calculate the reaction rate and estimate the surface area enhancement effects from it. Furthermore, particle S2 with a 80 nm Ti under-layer is of the same dimension as particles R1 and R2. Hence, we can conclude that the increased reaction rate in particles R1 and R2 is caused by the surface roughness due to the nanoscale features introduced by the PVD process. From Fig. 2, we find the O2 evolution for the rough Pt surface prepared using the deposition protocol for R2 is three times higher than for the smooth surface prepared by the deposition protocol for S1, suggesting that the surface area is also three times larger for the particle R2 compared with the smooth particles S1 and S2. The reaction rate at 10% H2O2 concentration shows a similar increase of four and two times for particles R1 and R2, respectively, compared to particles S1 and S2. Hence, we find that the increase in catalytic activity as observed via the speeds as well as the O2 evolution tests on the rough surfaces are in agreement and of the same order of magnitude. This suggests that the increase in the effective surface area by the deposition of a SiO2 under-layer applies both at the macroscopic wafer-scale and at the microscale of individual particles.
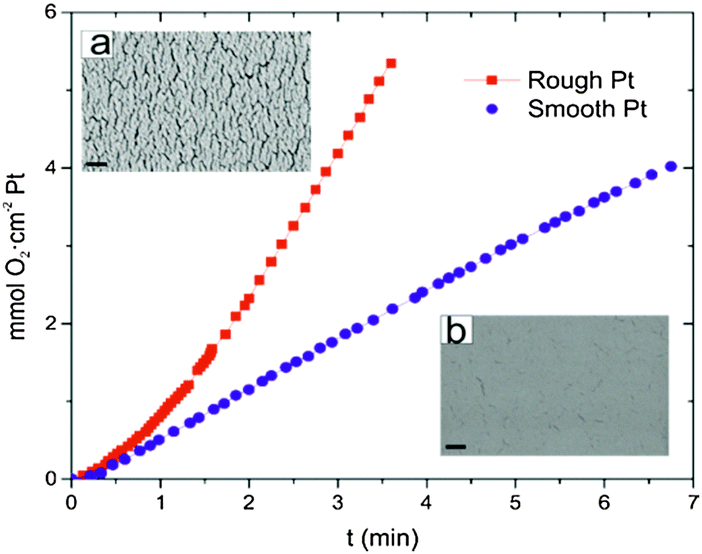 | ||
| Fig. 2 Evolution of O2 from Pt layers (thickness 20 nm) deposited onto a Si wafer piece (1 cm × 2 cm) reacting with 10% H2O2. The upper left inset (a) shows a SEM image of rough Pt (as deposited by the deposition method used for particle R2). The lower right inset (b) shows an SEM image of smooth Pt (as deposited by the deposition method used for particle S1). The rough surface mimics the topology of particle R2 and the smooth surface that of particles S1 and S2.The scale bar is 200 nm. | ||
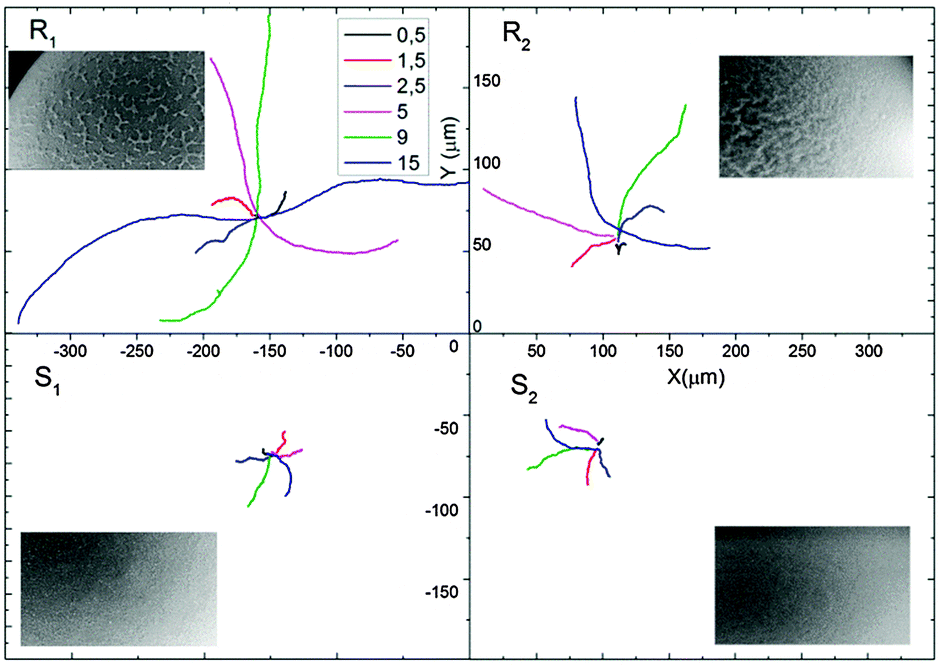 | ||
| Fig. 3 Examples of tracking trajectories of a single Janus particle of type R1, R2, S1 and S2 at different H2O2 concentrations tracked for 20 s. Particle R1 in 15% H2O2 covers a correspondingly largest distance. | ||
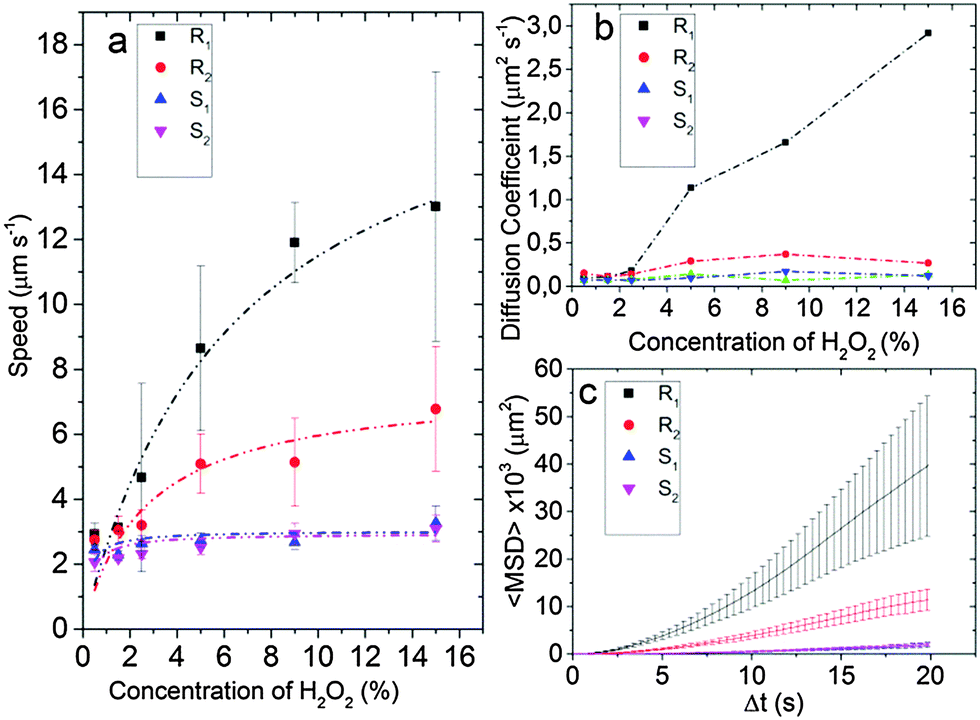 | ||
| Fig. 4 (a) Speed of Janus particles at different H2O2 concentrations. Smooth Particles S1 and S2 show a maximum mean speed of 3 μm s−1 while particles R1 and R2 have a maximum mean speed of 7 μm s−1 and 13 μm s−1, respectively, for a 15% H2O2 concentration. (b) Translational diffusion coefficient Ddiff of Janus particles R1, R2, S1 and S2 obtained by fitting eqn (1) for to the mean squared displacement of the trajectory (from 0 to 2 s) with the error bars as weights (see Fig. S1, ESI†). (c) MSD plot with error bars for the 15% H2O2 concentration for different particles. | ||
The difference in the speeds of R1 and R2 can be qualitatively explained by observing the morphology of the particles. While R1 has random rough patches on its surface, R2 has a more creased topology indicating denser growth of SiO2 patches. Subsequently, the deposition of Ti and Pt under normal incidence yields larger coverage of the catalyst Pt on the patchy surface of R1 than for R2, since it is easier for the metal to diffuse uniformly on the patchy morphology of R1, while self-shadowing only covers the tips of the structures in R2. Hence, the effective area of the catalyst will be higher in R1 than in R2 which will lead to increased propulsion speed of R1, as is experimentally observed.
In conclusion, we have presented a fabrication scheme for making rough Pt surfaces on microsphere surfaces with PVD. We have shown that this results in a four-fold increase in the speed of the self-propelled particles compared to Janus particles that have a smooth Pt surface. Furthermore, we have characterized the surface morphology of the rough spheres and theoretically estimated the increase of surface area of the particles fabricated by glancing angle growth. The simple fabrication strategy and a high increase in catalytic surface area and propulsion speed open up a new way to control the locomotion of microscale active swimmers. It also shows the range of speed increases that are available with PVD methods. It will be interesting to apply these techniques to rolled-up tubular micromotors where the roughness may also influence the formation of bubbles.
This work was in part supported by the European Research Council under the European Union's Seventh Framework Programme (FP7/20072013)/ERC grant agreement [no. 311529] and grant agreement 278213 and the DFG Research Grants Programme (Grant SA 2525/1-1) and as part of the SPP 1726 project (microswimmers, FI 1966/1-1). L.S. acknowledges the Beatriu de Pinós Program for financial support through project no. 2013 BP-B 00007.
Notes and references
- J. R. Howse, R. A. L. Jones, A. J. Ryan, T. Gough, R. Vafabakhsh and R. Golestanian, Phys. Rev. Lett., 2007, 99, 048102 CrossRef.
- S. J. Ebbens and J. R. Howse, Soft Matter, 2010, 6, 726–738 RSC.
- S. Sanchez, L. Soler and J. Katuri, Angew. Chem., 2015, 54, 1414–1444 CrossRef CAS PubMed.
- S. Sanchez, A. A. Solovev, S. M. Harazim, C. Deneke, Y. Feng Mei and O. G. Schmidt, Chem. Rec., 2011, 11, 367–370 CrossRef CAS PubMed.
- A. A. Solovev, Y. Mei, E. Bermúdez Ureña, G. Huang and O. G. Schmidt, Small, 2009, 5, 1688–1692 CrossRef CAS PubMed.
- J. Wang, Nanomachines: Fundamentals and Applications, John Wiley & Sons, 2013 Search PubMed.
- W. Wang, W. Duan, S. Ahmed, T. E. Mallouk and A. Sen, Nano Today, 2013, 8, 531–554 CrossRef CAS PubMed.
- T.-C. Lee, M. Alarcón-Correa, C. Miksch, K. Hahn, J. G. Gibbs and P. Fischer, Nano Lett., 2014, 14, 2407–2412 CrossRef CAS PubMed.
- G. Loget, J. Roche and A. Kuhn, Adv. Mater., 2012, 24, 5111–5116 CrossRef CAS PubMed.
- E. L. Khim Chng, G. Zhao and M. Pumera, Nanoscale, 2014, 6, 2119–2124 RSC.
- W. Wang, W. Duan, Z. Zhang, M. Sun, A. Sen and T. E. Mallouk, Chem. Commun., 2015, 51, 1020–1023 RSC.
- R. W. Carlsen, M. R. Edwards, J. Zhuang, C. Pacoret and M. Sitti, Lab Chip, 2014, 14, 3850–3859 RSC.
- N. S. Zacharia, Z. S. Sadeq and G. A. Ozin, Chem. Commun., 2009, 5856–5858 RSC.
- R. Laocharoensuk, J. Burdick and J. Wang, ACS Nano, 2008, 2, 1069–1075 CrossRef CAS PubMed.
- S. Wang and N. Wu, Langmuir, 2014, 30, 3477–3486 CrossRef CAS PubMed.
- H. Li, J. Wang, M. Liu, H. Wang, P. Su, J. Wu and J. Li, Nano Res., 2014, 7, 1007–1017 CrossRef CAS PubMed.
- D. Chen, Q. Tao, L. Liao, S. Liu, Y. Chen and S. Ye, Electrocatalysis, 2011, 2, 207–219 CrossRef CAS PubMed.
- M. M. Hawkeye and M. J. Brett, J. Vac. Sci. Technol., A, 2007, 25, 1317–1335 CAS.
- A. G. Mark, J. G. Gibbs, T.-C. Lee and P. Fischer, Nat. Mater., 2013, 12, 802–807 CrossRef CAS PubMed.
- L. Soler, J. Macanás, M. Muñoz and J. Casado, J. Power Sources, 2007, 169, 144–149 CrossRef CAS PubMed.
- S. Ebbens, M.-H. Tu, J. R. Howse and R. Golestanian, Phys. Rev. E: Stat., Nonlinear, Soft Matter Phys., 2012, 85, 020401 CrossRef.
Footnotes |
| † Electronic supplementary information (ESI) available. See DOI: 10.1039/c5cc01607j |
| ‡ These authors contributed equally to the work. |
| This journal is © The Royal Society of Chemistry 2015 |