 Open Access Article
Creative Commons Attribution 3.0 Unported Licence
The molecular motion of bovine serum albumin under physiological conditions is ion specific†
Luca
Medda
,
Maura
Monduzzi
and
Andrea
Salis
*
Department of Chemical and Geological Sciences, University of Cagliari-CSGI and CNBS, Cittadella Universitaria, S.S. 554 bivio Sestu, 09042- Monserrato (CA), Italy. E-mail: asalis@unica.it
First published on 11th March 2015
Abstract
Specific ion effects on the Brownian molecular motion of BSA protein under physiological conditions are investigated. New useful insights into Hofmeister phenomena related to electrolyte–protein interactions are presented.
There is at present an extraordinary interest toward ion specific ‘Hofmeister’ phenomena.1–3 In 1888 Franz Hofmeister studied the effect of salt addition on the aggregation of egg white proteins.4 He ordered the salts, with the same cation but different anions, according to their ability in promoting the precipitation (salting-out) or the solubility (salting-in) of a protein in aqueous solution. A conventional ‘Hofmeister series’ is:
| HPO42− > SO42− > F− > Cl− > Br− > NO3− > ClO4− > SCN− |
The ‘salting-out’ anions (left side of the series) are strongly hydrated, while ‘salting-in’ anions (right side) are only weakly hydrated. A similar series for cations was also observed:
| Cs+ > NH4+ > Rb+ > K+ > Na+ > Li+ > Mg2+ |
Proteins, depending on concentration and pH, often show remarkably different behaviours. Hence, the choice of concentration is quite important if the experiments must be related to physiological environments. As an example, the concentration of serum albumin (whose physiological function is the transport of hormones, fatty acids, etc. and the regulation of pH and osmotic pressure) ranges, for healthy individuals, between 35 and 50 mg mL−1.15
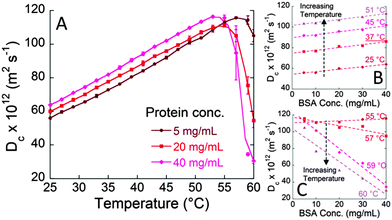
Here we investigated the specific effect of salts on the molecular motion of a concentrated solution of a model protein (bovine serum albumin, BSA) under physiological conditions. Before presenting the results of our experiments, it should be noticed that at pH 7, BSA is negatively charged since its pI (isoelectric point) is around 4.7.16 To investigate the subtle molecular protein–electrolyte interactions the ‘Brownian’ diffusion coefficient, Dc, obtained through dynamic light scattering (DLS) measurements is an extremely sensitive and convenient parameter. Fig. 1A shows the diffusion coefficient of BSA at different protein concentrations (pH 7 and 0.1 M NaCl) determined as a function of temperature. Dc increases upon increasing the temperature in the range 25–50 °C (Fig. 1A). At higher temperatures (51–57 °C) a maximum value of the diffusion coefficient (Dmax) is reached, and then the diffusion coefficient decreases to very low values. The initial part of the Dc/T curve is a straight line in agreement with the Stokes–Einstein equation that, for a spherical particle, is: D0 = kBT/6πηRH, where D0 represents the diffusion coefficient of the particle at infinite dilution, kB is the Boltzmann constant, η is the viscosity, and RH is the hydrodynamic radius of the diffusing particle. Differently, the steep decrease of Dc observed at T > 55 °C is very likely caused by BSA unfolding and resulting aggregation. The temperature ranges at which BSA aggregates start to form are consistent with the values found in the literature for similar conditions.17Fig. 1A also shows that the increase of BSA concentration from 5 to 40 mg mL−1, in the temperature range 25–51 °C, leads to an increase of the diffusion coefficient (Dc). The linear trend of Dc as a function of BSA concentration, at constant temperature (shown in Fig. 1B) can be described by the equation,12
| Dc = D0 [1 + kDcBSA] | (1) |
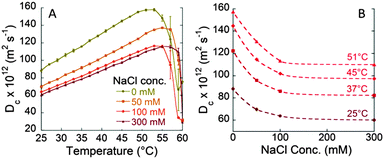
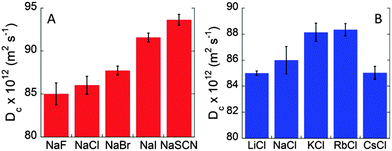
Fig. S2A (ESI†) shows the values of BSA diffusion coefficients as a function of temperature in the presence of different 0.1 M sodium salts. At each temperature the diffusion coefficients increase according to the typical Hofmeister sequence for anions (SCN− > I− > Br− > Cl− > F−), usually observed for pH > pI.23,24Fig. 3A shows the anion specific Dc values at the physiological temperature of 37 °C. The observed trend is consistent with specific anion adsorption on the BSA surface, despite its negative net charge at pH 7. The higher negative charge induced by SCN− adsorption at the BSA surface strengthens the repulsion among protein molecules and, hence, higher Dc values are measured. The marked anion specific effect between BSA molecules is confirmed by the values of Dmax that occur at 51 °C for NaF and increase up to more than 60 °C for NaSCN (see Fig. S3 in the ESI†). The increased stability of BSA solution against aggregation is about 10 °C. These striking findings highlight furthermore the importance of the nature of electrolytes at physiological concentrations.
The effect of different cations was then studied by collecting Dc/T values for BSA solutions (40 mg mL−1) at pH 7 in the presence of different 0.1 M chloride salts, as shown in Fig. S2B (ESI†). As observed elsewhere, the specific effect of cations is less marked than that of anions.6 This is in apparent contrast with what was expected from electrostatics. Due to the net negative charge of BSA at pH 7, cations should produce a more marked effect than anions. Nonetheless, we again observe a cation-specific trend at the physiological temperature of 37 °C (Fig. 3B). However, different from the anion case, here the Dc values do not follow a monotonic series but, rather, a “bell-shaped” trend: Rb+ ∼ K+ > Na+ > Cs+ ∼ Li+. This is a remarkable result. Indeed, cesium and lithium, two cations that are considered to be at the opposite sides of the Hofmeister series, behave very similarly giving rise to the lowest values of Dc. Rubidium and potassium, instead, increase BSA motion, while sodium is in between the two extremes. A similar “bell-shaped” series for cations was previously observed for other protein systems.6,7,25
At the present time, several approaches are being used to explain these peculiar Hofmeister effects.2 Among them, the empirical rule proposed by Collins known as the “law of matching water affinities” (LMWA)26 is worthy of consideration. LMWA is based on the classification of the ions as a function of the hydration degree (kosmotropic and chaotropic) and on the observation of the volcano plots. A theoretical approach due to Ninham explains ion–water, ion–ion and ion–surface specific interactions as the outcome of a delicate interplay between electrostatic and non-electrostatic (dispersion) forces.27
The most recent developments of Ninham's theory explain how to include Collins' rules.28 Here, in order to understand how ions affect the Brownian motion of BSA molecules we will consider the ‘interaction parameter’ kD introduced in eqn (1),12,29 calculated at 37 °C. kD values reported versus BSA concentration (see Fig. S4A in the ESI†) show, for 27 °C and 37 °C, a positive slope, which means that the repulsion among BSA molecules increases with increasing protein concentration. However, at 57 °C kD becomes negative (see Fig. S4B in the ESI†). This reflects the occurrence of non-electrostatic attractive forces likely due to the partial unfolding of BSA that leads to aggregation.
In order to investigate the molecular origin of the Hofmeister effect in protein systems, we propose in Fig. 4 the correlation of the interaction parameter kD, calculated at 37 °C, with either the difference in hydration enthalpies (ΔHhydration![[thin space (1/6-em)]](https://www.rsc.org/images/entities/char_2009.gif) anion − ΔHhydration
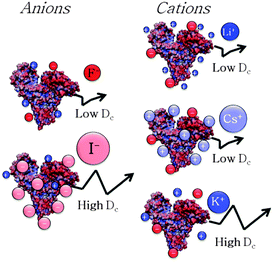
anion − ΔHhydration![[thin space (1/6-em)]](https://www.rsc.org/images/entities/char_2009.gif) cation) or the static polarisabilities of anions and cations (α0). Hydration enthalpies are related to LMWA,30 whereas ion polarisabilities are related to the theory of ion dispersion forces.2Fig. 4A shows a plot of kD as a function of difference in hydration enthalpies between the different anions and ammonium cation (taken as a reference cation due to its similarity to the amine groups of surface residues of protein). Similarly, kD was related to anion static polarisability α0 in Fig. 4B. We notice a quite good correlation between kD and both the difference in hydration enthalpies and α0 values. kD follows a monotonic increasing trend from F− to I− (SCN− does not follow the correlation trend likely because it is the only non-spherical ion and its polarisability is not isotropic). What emerges from the correlations is that both parameters seem to play a role in affecting ion specific BSA diffusion. Indeed, according to LMWA, the positive charges at the protein surface (due to amino, imidazole, or guanidinium groups) are classified as ‘chaotropes’ and thus would prefer to interact with chaotropic anions. That is, the interaction would decrease along the series: SCN− > I− > Br− > Cl−> F−. But (without considering SCN−) this is also the order of decreasing polarisability. Hence, we may argue that both parameters are at work and operate in the same direction. A higher adsorption of highly polarisable anions at the protein surface, indeed, would result in a stronger repulsion among BSA molecules. The same correlation was then evaluated for cations. In this case, kD was related to the difference in hydration enthalpies using the ΔHhydration of acetate (taken as a reference anionic group due to its similarity with carboxylates of protein surface residues) and those of the different cations, as well as with static polarisability, as shown in Fig. 4C and D. Different from the monotonic series observed for anions, cations again show a “bell-shaped” trend for both correlations (cf. Fig. 4D). If LMWA is the only mechanism at work, the strength of interaction between cations and negatively charged carboxylates (classified as kosmotropes) would decrease in going from the kosmotropic lithium to the chaotropic cesium. The order would be reversed if polarisability is accounted as the main factor. In fact, the observed trends agree neither with LMWA (Dc would have to decrease in the order: Cs+ > Rb+ > K+ > Na+ > Li+) nor with the polarizability order (Dc would have to decrease in the order: Li+ > Na+ > K+ > Rb+ > Cs+). The cation specific “bell-shaped” trend is a clear indication that both mechanisms are at work and operate in opposite directions. Similar findings were recently obtained by studying the ion specific aggregation of haemoglobin as a function of pH.6Scheme 1 represents the influence of ion specific interactions on the molecular motion of BSA protein, and deserves some important comments. In the case of anions, we notice that Dc is higher for I− than for F− because the former anion adsorbs on the BSA surface at a larger extent than the latter. This fact would make the BSA surface more negative and thus would increase the repulsion among protein molecules. In the case of cations we notice that Dc is lower for Li+ and Cs+ than for K+. Possibly, Li+ and Cs+ adsorb on the BSA surface at a larger extent than K+, making the surface less negative and thus decreasing the repulsion among protein molecules. It can be suggested that Li+ mainly interacts with carboxylates by ion-pairing according to LMWA, whereas Cs+ adsorbs on the uncharged patches of the protein, driven by its high polarisability according to the theory of ion dispersion forces.
cation) or the static polarisabilities of anions and cations (α0). Hydration enthalpies are related to LMWA,30 whereas ion polarisabilities are related to the theory of ion dispersion forces.2Fig. 4A shows a plot of kD as a function of difference in hydration enthalpies between the different anions and ammonium cation (taken as a reference cation due to its similarity to the amine groups of surface residues of protein). Similarly, kD was related to anion static polarisability α0 in Fig. 4B. We notice a quite good correlation between kD and both the difference in hydration enthalpies and α0 values. kD follows a monotonic increasing trend from F− to I− (SCN− does not follow the correlation trend likely because it is the only non-spherical ion and its polarisability is not isotropic). What emerges from the correlations is that both parameters seem to play a role in affecting ion specific BSA diffusion. Indeed, according to LMWA, the positive charges at the protein surface (due to amino, imidazole, or guanidinium groups) are classified as ‘chaotropes’ and thus would prefer to interact with chaotropic anions. That is, the interaction would decrease along the series: SCN− > I− > Br− > Cl−> F−. But (without considering SCN−) this is also the order of decreasing polarisability. Hence, we may argue that both parameters are at work and operate in the same direction. A higher adsorption of highly polarisable anions at the protein surface, indeed, would result in a stronger repulsion among BSA molecules. The same correlation was then evaluated for cations. In this case, kD was related to the difference in hydration enthalpies using the ΔHhydration of acetate (taken as a reference anionic group due to its similarity with carboxylates of protein surface residues) and those of the different cations, as well as with static polarisability, as shown in Fig. 4C and D. Different from the monotonic series observed for anions, cations again show a “bell-shaped” trend for both correlations (cf. Fig. 4D). If LMWA is the only mechanism at work, the strength of interaction between cations and negatively charged carboxylates (classified as kosmotropes) would decrease in going from the kosmotropic lithium to the chaotropic cesium. The order would be reversed if polarisability is accounted as the main factor. In fact, the observed trends agree neither with LMWA (Dc would have to decrease in the order: Cs+ > Rb+ > K+ > Na+ > Li+) nor with the polarizability order (Dc would have to decrease in the order: Li+ > Na+ > K+ > Rb+ > Cs+). The cation specific “bell-shaped” trend is a clear indication that both mechanisms are at work and operate in opposite directions. Similar findings were recently obtained by studying the ion specific aggregation of haemoglobin as a function of pH.6Scheme 1 represents the influence of ion specific interactions on the molecular motion of BSA protein, and deserves some important comments. In the case of anions, we notice that Dc is higher for I− than for F− because the former anion adsorbs on the BSA surface at a larger extent than the latter. This fact would make the BSA surface more negative and thus would increase the repulsion among protein molecules. In the case of cations we notice that Dc is lower for Li+ and Cs+ than for K+. Possibly, Li+ and Cs+ adsorb on the BSA surface at a larger extent than K+, making the surface less negative and thus decreasing the repulsion among protein molecules. It can be suggested that Li+ mainly interacts with carboxylates by ion-pairing according to LMWA, whereas Cs+ adsorbs on the uncharged patches of the protein, driven by its high polarisability according to the theory of ion dispersion forces.
 | ||
| Scheme 1 The molecular motion of BSA is ion specific. The arrow represents the molecular Brownian motion. | ||
In conclusion we have shown that ion specific phenomena modulate the molecular motion and the interactions among proteins under physiological conditions of temperature, pH, salt and protein concentration. This was only partially acknowledged, since only seldom Hofmeister related studies used high protein concentrations.23 In addition, most studies considered very high salt concentrations (up to 1 and 2 M). Here, we have confirmed that above the isoelectric point of the protein, anions (coions) still adsorb on the negatively charged protein surface to a higher extent than cations (counterions). This would be counterintuitive only if electrostatics is considered. These results can only be rationalised calling into play additional polarisability-dependent dispersion forces. Definitely, while for anions both hydration and polarisability work cooperatively thus producing a monotonic Hofmeister series, for cations the two mechanisms operate in opposite directions thus giving rise to a “bell-shaped” Hofmeister series.
MIUR, PRIN 2010–2011 grant number 2010BJ23MN-002, is thanked for financial support.
References
- P. Jungwirth and P. S. Cremer, Nat. Chem., 2014, 6, 261–263 CrossRef CAS PubMed.
- A. Salis and B. W. Ninham, Chem. Soc. Rev., 2014, 43, 7358–7377 RSC.
- P. Lo Nostro and B. W. Ninham, Chem. Rev., 2012, 112, 2286–2322 CrossRef CAS PubMed.
- W. Kunz, J. Henle and B. W. Ninham, Curr. Opin. Colloid Interface Sci., 2004, 9, 19–37 CrossRef CAS PubMed.
- N. Schwierz, D. Horinek and R. R. Netz, Langmuir, 2013, 29, 2602–2614 CrossRef CAS PubMed.
- L. Medda, C. Carucci, D. F. Parsons, B. W. Ninham, M. Monduzzi and A. Salis, Langmuir, 2013, 29, 15350–15358 CrossRef CAS PubMed.
- C. Carucci, P. Haltenort, M. Salazar, A. Salis and E. Magner, ChemElectroChem, 2015 DOI:10.1002/celc.201402412.
- C. A. Haynes and W. Norde, Colloids Surf., B, 1994, 2, 517–566 CrossRef CAS.
- S. Finet, Curr. Opin. Colloid Interface Sci., 2004, 9, 112–116 CrossRef CAS PubMed.
- K. Blennow, M. J. de Leon and H. Zetterberg, Lancet, 2006, 368, 387–403 CrossRef CAS.
- W. Dauer and S. Przedborski, Neuron, 2003, 39, 889–909 CrossRef CAS.
- D. Roberts, R. Keeling, M. Tracka, C. F. Van Der Walle, S. Uddin, J. Warwicker and R. Curtis, Mol. Pharmaceutics, 2015, 12, 179–193 CrossRef CAS PubMed.
- G. Yohannes, S. K. Wiedmer, M. Elomaa, M. Jussila, V. Aseyev and M.-L. Riekkola, Anal. Chim. Acta, 2010, 675, 191–198 CrossRef CAS PubMed.
- V. Vetri, F. Librizzi, M. Leone and V. Militello, Eur. Biophys. J., 2007, 36, 717–725 CrossRef CAS PubMed.
- D. C. Carter and J. X. Ho, Adv. Protein Chem., 1994, 45, 153–203 CrossRef CAS.
- A. Salis, M. Boström, L. Medda, F. Cugia, B. Barse, D. F. Parsons, B. W. Ninham and M. Monduzzi, Langmuir, 2011, 27, 11597–11604 CrossRef CAS PubMed.
- B. Jachimska, M. Wasilewska and Z. Adamczyk, Langmuir, 2008, 24, 6866–6872 CrossRef CAS PubMed.
- M. E. Young, P. A. Carroad and R. L. Bell, Biotechnol. Bioeng., 1980, 22, 947–955 CrossRef CAS.
- D. Brune and S. Kim, Proc. Natl. Acad. Sci. U. S. A., 1993, 90, 3835–3839 CrossRef CAS.
- A. Saluja, R. M. Fesinmeyer, S. Hogan, D. N. Brems and Y. R. Gokarn, Biophys. J., 2010, 99, 2657–2665 CrossRef CAS PubMed.
- C. Tanford and J. G. Buzzell, J. Phys. Chem., 1956, 60, 225–231 CrossRef CAS.
- L. Medda, B. Barse, F. Cugia, M. Boström, D. F. Parsons, B. W. Ninham, M. Monduzzi and A. Salis, Langmuir, 2012, 28, 16355–16363 CrossRef CAS PubMed.
- Y. Zhang and P. S. Cremer, Proc. Natl. Acad. Sci. U. S. A., 2009, 106, 15249–15253 CrossRef CAS PubMed.
- A. Salis, F. Cugia, D. F. Parsons, B. W. Ninham and M. Monduzzi, Phys. Chem. Chem. Phys., 2012, 14, 4343–4346 RSC.
- L. Medda, A. Salis and E. Magner, Phys. Chem. Chem. Phys., 2012, 14, 2875–2883 RSC.
- K. D. Collins, Methods, 2004, 34, 300–311 CrossRef CAS PubMed.
- B. W. Ninham and V. Yaminsky, Langmuir, 1997, 13, 2097–2108 CrossRef CAS.
- T. T. Duignan, D. F. Parsons and B. W. Ninham, Chem. Phys. Lett., 2014, 608, 55–59 CrossRef CAS PubMed.
- R. A. Curtis, C. Steinbrecher, M. Heinemann, H. W. Blanch and J. M. Prausnitz, Biophys. Chem., 2002, 98, 249–265 CrossRef CAS.
- J. Kherb, S. C. Flores and P. S. Cremer, J. Phys. Chem. B, 2012, 116, 7389–7397 CrossRef CAS PubMed.
Footnote |
| † Electronic supplementary information (ESI) available: Experimental details and additional experimental data. See DOI: 10.1039/c5cc01538c |
| This journal is © The Royal Society of Chemistry 2015 |


