 Open Access Article
Creative Commons Attribution 3.0 Unported Licence
Probing extracellular acidity of live cells in real time for cancer detection and monitoring anti-cancer drug activity†
Bhawana
Thakur
a,
S.
Jayakumar
b and
Shilpa N.
Sawant
*a
aChemistry Division, Mumbai 400085, India
bRadiation Biology & Health Sciences Division, Bhabha Atomic Research Centre, Mumbai 400085, India. E-mail: stawde@barc.gov.in; Tel: +91-22-25590288
First published on 9th March 2015
Abstract
We report a novel electrochemical strategy to probe the microenvironment of live cells in real time in terms of its extracellular pH. This approach allowed highly sensitive detection of cancer cells down to five cells. Utility of the sensor for evaluating the efficacy of glycolysis inhibiting anti-cancer drugs is also demonstrated.
Cancer is one of the major health challenges worldwide. Its detection in the early stage is crucial for an effective treatment. The conventional technique for detection of cancer is based on histopathology, which involves microscopic examination of the biopsy sample. Histopathology requires tedious sample preparation steps, which span over several hours.1 Moreover, trained pathologists are required for sample examination and interpretation. The other method commonly used is the estimation of biomarkers such as proteins, nucleic acids or hormones.2 However, low expression of biomarkers poses a limit on detection of cancer in the early stages. Hence, there is a need for a low cost, simple detection technique for initial screening of tumor samples irrespective of their origin. It is desirable to rely on a common biomarker or some inherent physiological properties, which is a signature of the cancer cell in general.
A universal property of primary and metastatic cancers is upregulation of glycolysis resulting in increased glucose consumption, which has been confirmed by positron emission tomography.3 Both primary and malignant lesions were found to consume glucose at a high rate irrespective of the oxygen status. The abnormal metabolism exhibited by cancer cells is characterized by excessive glycolysis, which leads to conversion of glucose to lactic acid (Warburg effect).4 The extent to which this phenomenon is expressed correlates with the tumor aggressiveness. Due to excessive production of lactic acid, the extracellular microenvironment of most tumors is found to be mildly acidic.5 Thus, tumors exhibit a substantially lower extra cellular pH (pHe) than normal tissues, whereas the intracellular pH of both tissues is similar6 (by virtue of proton pumps and intracellular buffers). This pH difference is exploited to a large extent for diagnosis and therapy by the design and use of pH sensitive agents that target the acidic tumor site. Studies by Lindner et al.7 reveal that pHe based studies can help to determine the efficacy of various non-surgical therapies, such as irradiation, chemotherapy and hyperthermia, and have significant impact on the management of cancer.8 In spite of its clinical significance, there are limited approaches (such as MRI, PET etc.; ESI,† Section 1a) for rapid, simple and low cost measurement of local pH which can facilitate early prediction in clinical settings.
Herein, we demonstrate for the first time, an electrochemical approach for real-time monitoring of the extracellular acidity (pHe) in the microenvironment of live cells. As the pHe values are correlated with the metabolic state of the cells, the sensor could probe the abnormal metabolism exhibited by the cancer cells thus corroborating its utility in potential clinical application for detection of cancer. By ingenious design of the electrodes, it was possible to achieve highly sensitive detection of as low as five cancer cells. The sensor is further utilized to evaluate the efficacy of glycolysis inhibiting drugs used in cancer therapy.
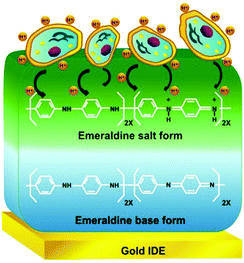
Our approach involves use of a conducting polymer, polyaniline, as the active platform for sensor development due to its high sensitivity to gauge pH change in its microenvironment, especially during the course of the biochemical process as corroborated in one of our earlier studies on detection of pesticide lindane at ppt levels.9 In the present case, the electrochemical transduction involves doping of polyaniline by the acidic metabolites released by the cells in their microenvironment upon glycolysis and the amperometric detection at an optimized voltage of 0.4 V. The acidic metabolites produced by the cells which are in direct contact with the sensor surface leads to conversion of the emeraldine base form of polyaniline to emeraldine salt (Scheme 1). This results in an increase in conductivity of the sensor film, which is measured by amperometry. We have investigated two different types of electrode (Fig. S1 in the ESI†) assemblies, sensors 1 and 2. Highly sensitive detection of the cancer cells could be attained due to the exponential increase in conductivity of polyaniline upon doping with the metabolites coupled with judicious design of the electrodes and the sensor assembly.
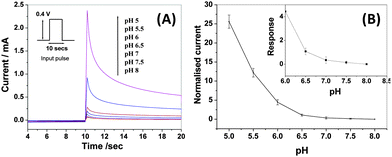
Each sensor was first calibrated (see details in the ESI,† Section 2C) for pH measurement using PBS solutions of different pH (Fig. 1A) to obtain a calibration curve as shown in Fig. 1B. The calibration curve enables direct read-out of pH values of test samples from the normalized current values (ESI,† Section 2C). As depicted in Fig. 1B, the increase in normalised current was more prominent at lower pH (5 to 6) as compared to that at higher pH. None-the-less, the response in the higher pH range of 6 to 8 (inset of Fig. 1B) is good enough for sensitive determination of pH values in this range. As a proof of concept, three cancer cell lines namely MCF7, PC3 and DU145 and non-cancerous human Peripheral Blood Mononuclear cells (PBMC) were studied. The cells were washed with PBS (pH = 8), centrifuged and re-suspended in 50 μL PBS (pH = 8). This pretreatment and buffer washing helped to eliminate the pH effect due to the previous history of cell culture so that the measured pH has contribution only from the metabolic acids freshly generated in situ by the cells upon glycolysis.
Before starting the measurements on cancer cells, the sensor was equilibrated with a PBS solution of pH 8 till a stable current output is obtained. Upon stabilization, a known amount of the cells under study were added to the PBS electrolyte in the sensor assembly and the resulting change in sensor response current was measured (see details in the ESI,† Section 2C). A representative set of amperometric responses of sensor 1 upon addition of MCF7 cells is depicted in the ESI,† Fig. S2A. For the various cell lines studied, the response obtained using sensor 1 at different cell densities is depicted in the ESI,† Fig. S2B. For each cell type studied, the response was found to rapidly increase with cell concentration up to 1 × 10⁶ cells after which the increase was marginal. Since the amount of metabolic acids produced would determine the extent of doping, it was expected that the response should increase with an increase in cell density. This led us to carry out further investigation on the sensing mechanism.
The surface of the polyaniline sensor film at various cell densities was studied by fluorescence and optical microscopy (Fig. S3 and S4 in the ESI†). At a cell density of 0.5 × 10⁶, the cells were found to be well separated and are able to directly interact with the polyaniline surface whereas above a cell number of 1 × 10⁶, the cells begin to stack over each other. This is exactly the cell density at which the sensor response begins to saturate. Only in the case of PBMC cells, the saturation in response is observed at higher cell density probably due to its smaller size (6–10 μm) as compared to the other cells (PC3 = 23 μm, MCF7 = 18 μm) studied.10 Thus, in the present system, the doping seems to be a surface phenomenon where only the cells directly adsorbed on the polyaniline surface are predominantly responsible for its doping and hence contribute to the sensor response. The metabolites released in the electrolyte seem to play a minor role as they get diluted and buffered by the PBS electrolyte and are also shielded from the sensor surface by the layer of adsorbed cells.
In order to corroborate the above interpretation, we designed another set of experiments where we separately studied pH of the supernatant solution and the cells. The cells were washed with PBS, centrifuged, re-suspended in 50 μL of PBS (pH = 8), and were allowed to remain undisturbed at room temperature for one hour. After this, the cell suspension was centrifuged and the pH of the supernatant solution (containing the acidic metabolic products) and the precipitated cells were determined independently using the polyaniline sensor films. In the case of 1 × 10⁶ MCF7 cells, the pH of the centrifuged cells was found to be 5.71 ± 0.40 (N = 5) and that of the supernatant solution was found to be 6.74 ± 0.09 (N = 5). Similarly, for 0.5 × 10⁶ DU145, the pH of the centrifuged cells was found to be 7.37 and the pH of supernatant solution was found to be 7.8. The results clearly indicate that the contribution to reduction in pH of the sensor film is mainly from the cells as compared to the supernatant solution. Thus, the sensor is capable of measuring pH at the cell membrane surface. The present approach thus allowed discrimination between the pH at the cell membrane surface vis-a-vis that in the bulk cell suspension. Zeta potential measurements were also carried out to elucidate the nature of an extracellular environment and its probable correlation with pHe. The pHe values measured using the sensor were found to be independent of the charge on the cell membrane and depend on the amount of metabolites released by the cells in their microenvironment (ESI,† Section 3C). Thus, the pHe values recorded using the sensor give an estimate of the metabolic status of the cells.
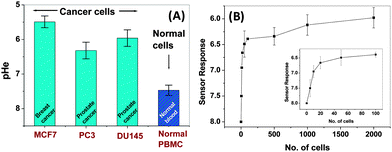
The extracellular pH (pHe) measured using sensor 1 for 2 × 10⁶ cells of PC3, MCF7, DU 145, and normal PBMC (N = 5) is depicted in Fig. 2A. Among the cells studied, MCF7 cells displayed the highest acidity with a pH value of 5.5 followed by DU145 (5.96), PC3 (6.34) and PBMC (7.47). MCF7 cells are known to form intracellular large acidic (pH below 4) vesicles (LAVs) which are also found in vitro in breast cancer cells.11 The LAVs could probably have some extracellular action resulting in higher acidity in MCF7 as compared to other cancer cells. Using a microelectrode tip, Montcourrier et al.12 observed that the free surface of MCF7 has a pH of 0.33 ± 0.14 units lower than that of the surrounding medium. But when the microelectrode tip was inserted beneath the attached surface of the cells, the pH was lowered by up to 1.7 units. This value matches very well with the pH values estimated for MCF7 using our polyaniline based sensor. The pH value of PC3 measured using sensor 1 (6.34) is slightly lower that the pHe value (of 6.83) recently reported by Macholl et al.13 using 31P MRS. However, they have indicated that the overall local pHe near the cell membrane may be even lower than the pHe reported by them as the 31P MRS measured pHe is an indicator of the pH at the site of insertion of the pHLIP membrane on cell membranes. Thus, the pH values obtained using our sensor assembly give a better estimate of pHe and the local microenvironment of the cells as they are in direct contact with the sensor surface. The present electrode assembly can be modified to develop a catheter type insertable electrode for in vivo pHe determination at the tumor site, thus reducing the cases of biopsy.
Overall, the measured pHe values were found to be much lower for the cancer cells as compared to normal PBM cells. The pH values reported in the literature for a range of tumors as well as normal cells using a variety of techniques are summarized in Table S2 in the ESI,† where values ranging from 5.5 to 7.6 have been reported. From Fig. 2A, it can be clearly seen that the cancer cells give much higher sensor response as compared to normal cells. Thus, further investigation was carried out to develop a sensor for potential clinical application in detection of cancer.
Sensor 2 with reduced electrode spacing and area (Fig. S1b, ESI†) was designed so as to allow highly sensitive detection of cancer cells. As discussed earlier, sensing in the present case is a surface phenomenon, where only the cells directly adsorbed on the sensor surface lead to doping of the polyaniline film and thus contribute to the sensor response. In the case of sensor 1, the sensor surface area is large to accommodate as high as 1 × 10⁶ cells and hence, the response saturates at cell densities above 1 × 10⁶ cells and is linear below this cell number. To improve the sensitivity of detection, sensor 2 with reduced polyaniline surface area (radius 1 mm) was designed so that the surface gets saturated in the presence of a few thousands of cells and shows a linear response for a lower cell number. However, reduction in sensor surface area would lead to very small current output hence, the electrode spacing was reduced to 25 μm, which helped to obtain high current values. Polyaniline was deposited by placing a (5 μL) droplet of the monomer solution over the 25 μm electrode spacing followed by electropolymersation to bridge the gap between the electrodes (see details in the ESI,† Section 2 C2). The resulting sensor electrode, i.e. sensor 2, gave a linear response in the presence a few numbers of cells as depicted in Fig. 2B and displayed high sensitivity for detection of as low as 5 cells (inset of Fig. 2B).
The sensor characteristics for the different cell types studied are compiled in Table S3 in the ESI.† The sensor is generic in nature as no specific antigens or markers were used for recognition. The sensor response was dependent on the nature of metabolism exhibited by the individual cell type. The detection limit of the sensor (estimated at 3σ, σ = standard deviation of the background signal) was found to be ∼0.02 pH units for sensor 1 and 0.002 pH units for sensor 2. In terms of the cell number, the detection limit was ∼4.9 × 10³ and 2 MCF7 cells for sensor 1 and sensor 2, respectively. The limit of quantification based on measurements using progressively more dilute cell suspension (for sensor 2) was five cells. Studies were also carried out to detect the presence of cancer cells in a cocktail of cancer and normal cells. Sensor 1 could detect 0.01 × 10⁶ MCF7 cells in the presence of 0.5 × 10⁶ normal CHO cells. This sensitivity for detection of cancer cells in the presence of normal cells can be further increased by using sensor 2.
Overall, the sensors displayed a low relative standard deviation of less than 3–4% (N = 5), which indicated a good reproducibility of the sensor. As far as the response time is concerned, sensor 1 reached a steady-state current in ∼20 min (sensor 2 ∼15 min) upon addition of an aliquot of cells, thus exhibiting a fairly fast response time as compared to the other traditional methods for cancer detection. Thus, the reported sensor demonstrated satisfactory characteristics when compared with other methods for tumor pH determination listed in Table S2 in the ESI.†
We have further demonstrated the utility of the sensor for screening of drugs used in cancer therapy. Among the various strategies for developing anti-cancer drugs, glycolysis inhibition is one of the routes followed. The preferential dependence of cancer cells on the glycolytic-pathway for ATP generation provides a biochemical basis for design of therapeutic agents which preferentially kill the cancer cells by inhibition of glycolysis.14
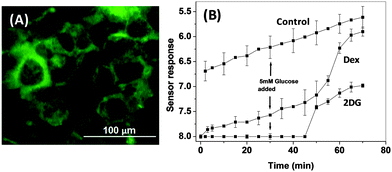
Glucocorticoids like dexamethasone (Dex) are most active therapeutic agents in the treatment of leukemia and lymphoid malignancies.15 Dex is known to decrease the levels of plasma membrane-associated glucose transporter GLUT1, thus inhibiting glucose uptake.15 Another glycolytic inhibitor 2-DG, a glucose analogue, competes with glucose for transmembrane transport (Fig. 3A) and exhibits a cytotoxic effect in cancer cells.14 Since our sensor measures pHe, which is correlated with the generation of metabolic acids via glycolysis, the sensor could be utilized for real time monitoring of the glycolysis inhibiting the efficacy of these drugs at sub-lethal concentrations (see cell viability data in the ESI,† Section 3F). MCF7 cells treated for 24 h with either 100 μM dexamethasone (Dex) or 100 μM 2-deoxyglucose (2DG) exhibited higher pHe as compared to untreated cells indicating an efficient glycolysis inhibition by both the drugs (Fig. 3B). Between the two drugs, 2DG exhibited marginally higher glycolysis inhibition (99.8%) as compared to Dex (99.72%) in the absence of glucose in the sensor assembly. Later, 5 mM of glucose was added to the sensor and the inhibition efficiency of the internalized (cell entrapped) drug in the presence of glucose was studied. After 20 min of addition of glucose, both the drug treated MCF7 cells started showing signs of commencement of glycolysis. However, the internalized 2DG was able to inhibit glycolysis to a higher extent as compared to Dex (98.5% and 88.3% inhibition, respectively, 30 min after addition of glucose), indicating better glycolysis inhibition efficacy of 2DG as compared to Dex. The results are consistent with the reports of Buentke et al.,15 where inhibition efficiency was studied by assessing the metabolites by liquid chromatography and mass spectrometry.
To summarize, we have devised a novel multifunctional platform having three fold potential application in: (a) biological research for determination of extracellular acidity i.e. pHe in real time, (b) diagnosis for highly sensitive detection of cancer cells, and (c) drug discovery for evaluating the efficiency of glycolysis inhibiting anti-cancer drugs in real time.
Another advantage of using a polyaniline-based sensor is its biocompatibility, which we have demonstrated in one of our earlier studies.16 Thus, the sensor film will not alter the physiological functioning of the cells and can be utilized for in vivo spatiotemporal measurements of extracellular pH. The novel concept demonstrated herein opens a way, not only for preliminary screening and diagnosis of cancer, but also in cancer metabonomics for monitoring the response to various therapies during the treatment of cancer.
BT is thankful to the BARC-UoP collaborative PhD program for the fellowship.
Notes and references
- U. Meyer, T. Meyer, J. Handschel and H. P. Wiesmann, Fundamentals of Tissue Engineering and Regenerative Medicine, Springer-Verlag, Berlin, Heidelberg, 2009, p. 79 Search PubMed.
- X. Li, Y. Pei, R. Zhang, Q. Shuai, F. Wang, T. Aastrup and Z. Pie, Chem. Commun., 2013, 49, 9908 RSC; S. Krishnan, E. G. Hvastkovs, B. Bajrami, I. Jansson, J. B. Schenkman and J. F. Rusling, Chem. Commun., 2007, 1713 RSC; J. Liu, C.-Y. Lu, H. Zhou, J.-J. Xu, Z.-H. Wang and H.-Y. Chen, Chem. Commun., 2013, 49, 6602 RSC; P. Chandra, H.-B. Noh and Y.-B. Shim, Chem. Commun., 2013, 49, 1900 RSC.
- J. W. Wojtkowiak, J. M. Rothberg, V. Kumar, K. J. Schramm, E. J. Haller, B. Proemsey, M. C. Lloyd, B. F. Sloane and R. J. Gillies, Cancer Res., 2012, 72, 3938 CrossRef CAS PubMed.
- M. F. MacCarty and J. Whitaker, Altern. Med. Rev., 2010, 15, 264 Search PubMed.
- A. Schulze and A. L. Harris, Nature, 2012, 491, 364–373 CrossRef CAS PubMed.
- L. E. Gerweck, S. Vijayappa and S. Kozin, Mol. Cancer Ther., 2006, 5, 1275 CrossRef CAS PubMed.
- D. Lindner and D. Raghavan, Br. J. Cancer, 2009, 100, 1287 CrossRef CAS PubMed.
- F. Kallinowski and P. Vaupel, Br. J. Cancer, 1988, 58, 314 CrossRef CAS.
- M. U. A. Prathap, A. K. Chaurasia, S. N. Sawant and S. K. Apte, Anal. Chem., 2012, 84, 6672 CrossRef PubMed.
- S. K. Arya, K. C. Lee, D. B. Dah'alan, Daniel and A. R. A. Rahman, Lab Chip, 2012, 12, 2362–2368 RSC.
- P. Montcourrier, P. H. Mangeat, C. Valembois, G. Salazar, A. Sahuquet, C. Duperray and H. Rochefort, J. Cell Sci., 1994, 107, 2381 Search PubMed.
- P. Montcourrier, I. Silver, R. Farnoud, I. Bird and H. Rochefort, Clin. Exp. Metastasis, 1997, 15, 382 CrossRef CAS.
- S. Macholl, M. S. Morrison, P. Iveson, B. E. Arbo, O. A. Andreev, Y. K. Reshetnyak, D. M. Engelman and E. Johannesen, Mol. Imaging Biol., 2012, 14, 725 CrossRef PubMed.
- H. Pelicano, D. S. Martin, R.-H. Xu and P. Huang, Oncogene, 2006, 25, 4633 CrossRef CAS PubMed.
- E. Buentke, A. Nordström, H. Lin, A. C. Björklund, E. Laane, M. Harada, L. Lu, T. Tegnebratt, S. Stone-Elander, M. Heyman, S. Söderha, A. Porwit, C. G. Östenson, M. Shoshan, K. P. Tamm and D. Grandér, Blood Cancer Journal, 2011, 1, e31 CrossRef CAS PubMed.
- P. K. Prabhakar, S. Raj, P. R. Anuradha, S. N. Sawant and M. Doble, Colloids Surf., B, 2011, 86, 146 CrossRef CAS PubMed.
Footnote |
| † Electronic supplementary information (ESI) available. See DOI: 10.1039/c5cc01445j |
| This journal is © The Royal Society of Chemistry 2015 |


