 Open Access Article
Structure transition of Au18 from pyramidal to a hollow-cage during soft-landing onto a TiO2(110) surface†
Lei
Li
a,
Hui
Li
b and
Xiao Cheng
Zeng
*a
aDepartment of Chemistry, University of Nebraska-Lincoln, Lincoln, NE 68588, USA. E-mail: xzeng1@unl.edu
bInstitute of Physics, Chinese Academy of Sciences, Beijing, 100190, China
First published on 21st April 2015
Abstract
Au18 is a unique gold cluster in that, in the gas phase, two distinct isomers, namely, golden hollow-cage and golden pyramid, can coexist (ACS Nano, 2009, 3, 1225). We perform a Born–Oppenheimer molecular dynamics (BOMD) simulation to confirm the structural stability of the two isomers at ambient temperature. Most importantly, we study the possible structure conversion between the two isomers when they are soft-landed onto a rutile TiO2(110) surface. Our BOMD simulation indicates that the Au18 cluster can undergo a transition from pyramidal to a hollow-cage structure during soft landing onto the rutile TiO2(110) surface at ambient temperature, suggesting the high selectivity of the hollow-cage structure over the pyramidal structure in realistic soft-landing experiments.
Au clusters and nanoparticles have been intensively studied due to their exceptional catalytic activity towards numerous reactions, including CO oxidation,1–6 thiophenol oxidation, propylene epoxidation7 and the water-gas shift reactions.8,9 One feature focused on in experimental and theoretical studies has been the size- and structure-dependent catalytic activity of Au clusters with or without metal-oxide support. It has been recognized that the catalytic activity of supported Au clusters can be strongly correlated with the local structure at the Au–TiO2 interface. In reality, however, the local structure at the Au/support interface depends on the kinetically relaxed structure of the Au cluster after landing or growing on the support, or on the preparation method and environmental conditions. One experimental approach that has been used to prepare precisely controlled Au cluster/support systems for nanocatalysis studies is the so-called soft-landing, in which the clusters are size-selected through mass spectrometry.10–15 During the soft landing process, structural deformation of the Au clusters may occur after collision with the support.15,16 Significant structural deformation may dramatically affect the contact area between the Au clusters and the support, thereby leading to different catalytic activities. Ab initio molecular dynamic simulation of the soft-landing process of sub-nanometer gold clusters not only allows us to monitor the time-dependent structure evolution of the Au clusters on the surface of the metal oxide support but also allows us to assess the structural stability and possible structure transition of different isomers at different temperatures.
In a recent study, we have shown the high catalytic activity of the hollow-cage Au18 (Au18-cage) cluster soft-landed onto a rutile TiO2(110) surface, as well as the high structural stability of the hollow-cage Au18 cluster during collision with the rutile TiO2(110) surface or in the reaction environment of CO oxidation.16 Nevertheless, besides the hollow-cage isomer, the pyramidal isomer (Au18-pyrd) is another abundant isomer in gas phase reactions although it is much less active towards CO oxidation.16–19 From the standpoint of increasing the catalytic activity, it would be desirable to convert the pyramidal isomer to the hollow-cage isomer for Au18. To explore this possibility, we simulate the soft-landing process of Au18-pyrd onto the rutile TiO2(110) surface. Interestingly, our BOMD simulation shows that the structural transition of Au18 from pyramidal to the hollow-cage can occur during the soft-landing process onto the rutile TiO2(110) surface at room temperature.
Our BOMD simulation is performed on the basis of the density functional theory method in the form of Perdew–Burke–Ernzerhof (PBE) functional, implemented in the CP2K code.20–22 A mixed Gaussian and plane-wave (GPW) basis set with the Goedecker–Teter–Hutter (GTH) pseudopotential is adopted to treat the interaction between the core and valence electrons.21,22 The plane-wave energy cutoff is set as 280 Ry. The energy convergence is set to 1.0 × 10⁻⁷ a.u. so that the total energy drift does not exceed 0.67% of the initial kinetic energy per picosecond (ESI,† Fig. S1). A (110)-terminated rutile TiO2 slab (6 × 3) is used to model the TiO2 surface. The slab contains 12 atomic layers with the top six atomic layers free to relax while the bottom six atomic layers are fixed at their lattice position. To simulate the soft-landing process, a neutral Au18-pyrd cluster is initially located ∼5.0 Å above the rutile TiO2(110) surface so that only weak dispersion interaction exists between the Au cluster and the rutile TiO2(110) surface. The initial thermal velocities of the atoms of the Au cluster and the top 6 atomic layers of the TiO2 substrate are given based on the Boltzmann distribution at 298 K. Then, the velocities of the Au atoms along the z direction (perpendicular to the rutile TiO2(110) surface) are reset so that the initial relative velocity (νz) between the Au cluster and the TiO2 support is ∼207 m s−1. The sum of the thermal kinetic energy and translation kinetic energy of the Au cluster amounts to ∼0.1 eV per atom, satisfying the soft-landing conditions (in experiments, the kinetic energy in the range of 0.02 to 0.2 eV per atom is typically used for soft landing of nanoparticles onto hard surfaces, i.e., oxide surface).12,13,23–27 In the size-selection step involved in all soft-landing experiments, the Au clusters must carry a charge.27,28 It is expected that during the soft-landing, the charge would be lost to the support, leaving the charge of the Au clusters neutral.29,30 Hence, in our simulation, the neutral Au cluster is selected. The BOMD simulation is performed in the constant-energy, constant-volume (NVE) ensemble with a timestep of 1.0 fs.
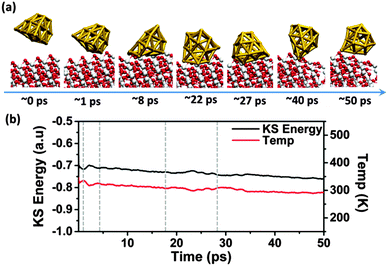
Snapshots at several stages of the BOMD simulation, time-evolution of the Kohn–Sham (KS) energy and the temperature of the Au18/TiO2 system are displayed in Fig. 1. As shown in Fig. 1a, energy conversion from the kinetic energy to KS potential energy can be seen in the following three time intervals: collision period (∼1–4 ps), structure transition period (∼18–27 ps), and post-transition period (>27 ps). In the collision period, the Au18 cluster starts to collide with the TiO2 surface at ∼1 ps and structural deformation is induced. During this period, the temperature decreases first and then increases while the KS potential energy increases first and then decreases. The structure of Au18 continues to evolve due to the deformation. At ∼20 ps, the potential energy starts to increase with a concomitant decrease in the temperature. Such energy conversion corresponds to the structure transition of the Au cluster to the hollow-cage structure. The increase in the KS potential energy manifests the climbing of the energy barrier that is required to complete the structure transition from pyramidal to the hollow-cage. Upon the structure transition, the Au18 cluster starts to shift along the (100) direction and even flips over on the TiO2 surface (ESI,† Movie S1), manifested by post fluctuation of the KS energy and the kinetic energy. Subsequently, no further structure deformation is observed upon the formation of the hollow-cage structure at ∼27 ps, indicating the higher stability of the hollow-cage Au18 isomer over the pyramidal isomer after the soft landing.
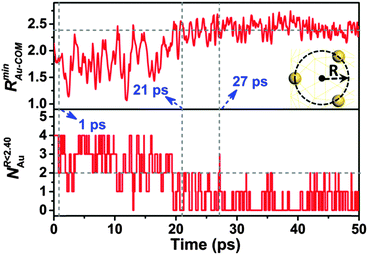
To further confirm the occurrence of the structure transition, we calculate the minimum distance of the Au atom that is closest to the center of the mass (COM) of the Au18 cluster, and the number of Au atoms within 2.40 Å of the COM of the Au18 cluster at each time step during the BOMD simulation. The two quantities are denoted as RminAu–COM and NR<2.40Au, respectively, as shown in Fig. 2. Before the structure transition (<18 ps), RminAu–COM fluctuates around the average value ∼1.75 Å with a relatively large fluctuation range (from ∼1.10 to 2.40 Å) due to the structure deformation induced by the collision. Beyond 18 ps, the mean value of RminAu–COM starts to increase and reaches ∼2.40 Å at ∼21 ps. Beyond 21 ps, RminAu–COM mainly fluctuates around ∼2.40 Å and the amplitude of the fluctuation becomes gradually smaller, implying that a relatively stable structure is attained. Furthermore, the time variation of NR<2.40Au describes the dynamic behavior of the Au atoms near the core area within a radius of ∼2.40 Å. As shown in the lower panel of Fig. 2, before the collision (t < 1 ps), NR<2.40Au is about 4, indicating that four Au atoms are favored to stay in the core region, corresponding to the existence of the four facet atoms (yellow atoms in Fig. 3(b) upper panel) in the Au18-pyrd. From 1 to ∼18 ps, NR<2.40Au starts to fluctuate between 1 and 4, with an average value of ∼2, suggesting a relatively high probability of finding the Au atoms in the core region. After the structure transition (t > 21 ps), the number of Au atoms in the core region is not more than 2, and sometimes there are no Au atoms in this region. In other words, the probability of the Au atoms appearing in the core region (r < 2.40 Å) is greatly reduced. To summarize, the increment of RminAu–COM results in an enlargement of the empty core region rarely occupied by the Au atoms, indicating the formation of a cage-like structure.
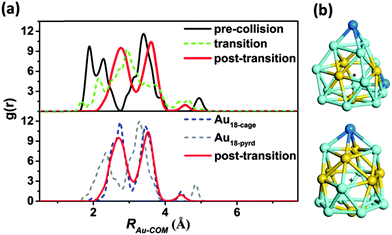
For the purpose of comparison, we performed a BOMD simulation to compute the radial distribution functions (g(r)) of the Au–COM distance for both the hollow-cage and pyramidal Au18 clusters in the gas phase (see Fig. 3). The simulation was carried out in the constant-volume and -temperature (NVT) ensemble with the temperature controlled at ∼300 K. As shown in the ESI,† movies S2 and S3, both gas-phase Au18 isomers can maintain their original structures with little structure deformation at least within 20 ps of the BOMD simulation, indicating the thermal stability of both gas-phase clusters. In their g(r) functions, three main peaks are observed, which are corresponding to the inner-, middle- and outer-shell Au atoms, respectively, as depicted in Fig. 3b. In Fig. 3a, we also plot computed radial distribution functions g(r) of the Au–COM distance over three time periods: the pre-collision period (t < 1 ps), the structure-transition period (18 ps < t < 27 ps), and the post-transition period (t > 27 ps). Comparison of the three g(r) functions illustrates the structure evolution of the Au18 cluster during the soft-landing process. Before the collision, three peaks are located at ∼1.846, ∼3.315 and ∼4.822 Å. These peaks are mostly consistent with those shown in the g(r) of the bare Au18-pyrd cluster, although the long-range interaction between the Au18 cluster and the rutile TiO2(110) surface results in splitting and left shifting of the first peak. The structure deformation induced by the collision leads to the outer-shell shifting of Au atoms as reflected by the lowered first peak from the pre-collision to the structure transition stage. As a result, the g(r) in the structure transition stage shows structural features of both the Au18-pyrd and Au18-cage clusters. In the post-transition stage, the peak at ∼1.846 Å disappears. Instead, a peak at ∼2.749 Å is seen. This apparent shifting of the first peak to a longer distance by ∼0.903 Å signifies expansion of the empty core region with the radius increasing from ∼1.741 to ∼2.413 Å (the values are taken from the half-height positions of the first peak). On the contrary, the peak originally located at ∼4.822 Å is lowered by half in height, and shifts to a shorter-distance range. This results from the disappearance and the inner-shell shifting of the two corner-atoms in the pyramidal structure (blue Au atoms in Fig. 3b). Such changes result in a good agreement between the g(r) of the Au–COM distance with that of the bare Au18-cage cluster, confirming the formation of a hollow-cage structure in the post transition period. Here, the variation of the g(r) function of the Au–COM distance illustrates the structure evolution of the Au18 cluster from the pyramidal to the hollow-cage structure during the soft-landing process.
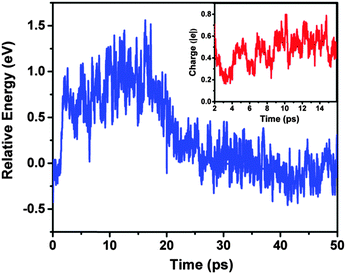
To understand the origin of the transition from the pyramidal to the hollow-cage structure, we have computed the time evolution of the total energy of the Au18 cluster during the soft-landing process (Fig. 4). From the energy evolution of the Au18 cluster, an energy barrier is seen from the pyramidal to the hollow-cage structure. The collision between the Au18 cluster and the rutile TiO2(110) surface assists the surmounting of this energy barrier to trigger the structure transition. In addition, the Mulliken charge analysis indicates that the Au18 cluster is positively charged during 2–16 ps due to electron transfer from Au to the surface oxygen atoms. Our DFT calculation shows that the pyramidal Au18 cluster with a positive charge is less stable than the positively charged hollow-cage Au18 cluster by ∼0.15 eV in energy. In other words, the electron transfer from the Au cluster to the TiO2 surface can also destabilize the pyramidal Au18 cluster. Hence, the observed structure transition is likely resulted from a combined effect of the collision and the charge transfer between the Au18 cluster and the TiO2 surface.
To further confirm the pyramid-to-cage transition, another two independent BOMD simulations (denoted as Run 2 and Run 3) of the soft-landing of the pyramidal Au18 onto the rutile TiO2(110) surface were performed. As shown in the ESI,† Fig. S2, a relatively stable structure is seen at ∼30 and ∼35 ps for Run 2 and Run 3, respectively. Our simulations indicate that the stable structure seen in both BOMD runs is the distorted hollow-cage structure (see Fig. 5a). The time-evolution of RminAu–COM for both BOMD runs indicates expansion of the empty core region from ∼1.75 to 2.40 Å (ESI,† Fig. S2c). A comparison of g(r) of the Au–COM distance for the pre-collision (t < 1 ps, ESI,† Fig. S3) and post-transition period (t > 30 and 35 ps for both Run 2 and Run 3; see Fig. 5c) suggests that the Au atoms tend to shift to the outer shell. Such an outer-shell shifting behavior is consistent with the formation of an empty core region with a radius of ∼2.435 Å, and with the time evolution of RminAu–COM. As shown in both runs, collision of the Au18 cluster with the rutile TiO2(110) surface leads to the formation of a hollow-cage structure.
As aforementioned, the pyramidal and hollow-cage structures are the two dominant structures for the mass-spectrometry selected Au18 clusters in the gas phase. Our previous study had shown that the hollow-cage Au18 cluster exhibits a much higher catalytic activity towards CO oxidation than the pyramidal isomer.16 Also, the BOMD simulations have demonstrated that the hollow-cage isomer can maintain its structure not only during the soft-landing process, but also in the reaction environment of CO oxidation. Hence, in realistic soft-landing experiments involving Au18 clusters, the hollow-cage isomer is expected to be the most popular isomer and should play a dominant role in the high catalytic activity of the rutile TiO2(110) supported Au18 clusters.
In conclusion, we have simulated the soft-landing process of pyramidal Au18 onto the rutile TiO2(110) surface by using the large-scale BOMD simulations. All three independent BOMD simulations show that collision of the Au18 clusters with the TiO2 surface leads to the outer-shell shifting of the Au atoms, thus resulting in the formation of a hollow-cage structure. Such a structure transition from the pyramidal isomer to the hollow-cage isomer indicates that the Au18 clusters tend to exhibit the hollow-cage structure after soft-landing onto the rutile TiO2(110) surface. In view of the higher catalytic activity of the hollow-cage Au18 clusters, the conversion of the pyramidal isomer to the hollow-cage isomer through soft-landing is quite desirable. Our simulation also suggests that the size selection through mass-spectrometry combined with soft-landing of the Au clusters on the rutile TiO2(110) surface offers an effective experimental approach for isomer-specific nanocatalysis studies.
Notes and references
- M. Haruta, T. Kobayashi, H. Sano and N. Yamada, Chem. Lett., 1987, 405–408 CrossRef CAS.
- M. Valden, X. Lai and D. W. Goodman, Science, 1998, 281, 1647–1650 CrossRef CAS.
- M. Haruta, N. Yamada, T. Kobayashi and S. Iijima, J. Catal., 1989, 115, 301–309 CrossRef CAS.
- X. W. Xie, Y. Li, Z. Q. Liu, M. Haruta and W. J. Shen, Nature, 2009, 458, 746–749 CrossRef CAS PubMed.
- N. Weiher, A. M. Beesley, N. Tsapatsaris, L. Delannoy, C. Louis, J. A. van Bokhoven and S. L. M. Schroeder, J. Am. Chem. Soc., 2007, 129, 2240–2241 CrossRef CAS PubMed.
- C. Y. Liu, Y. Z. Tan, S. S. Lin, H. Li, X. J. Wu, L. Li, Y. Pei and X. C. Zeng, J. Am. Chem. Soc., 2013, 135, 2583–2595 CrossRef CAS PubMed.
- T. Hayashi, K. Tanaka and M. Haruta, J. Catal., 1998, 178, 566–575 CrossRef CAS.
- F. Boccuzzi, A. Chiorino, M. Manzoli, D. Andreeva and T. Tabakova, J. Catal., 1999, 188, 176–185 CrossRef CAS.
- W. D. Williams, M. Shekhar, W. S. Lee, V. Kispersky, W. N. Delgass, F. H. Ribeiro, S. M. Kim, E. A. Stach, J. T. Miller and L. F. Allard, J. Am. Chem. Soc., 2010, 132, 14018–14020 CrossRef CAS PubMed.
- S. A. Miller, H. Luo, S. J. Pachuta and R. G. Cooks, Science, 1997, 275, 1447–1450 CrossRef CAS.
- S. S. Lee, C. Y. Fan, T. P. Wu and S. L. Anderson, J. Am. Chem. Soc., 2004, 126, 5682–5683 CrossRef CAS PubMed.
- G. E. Johnson, T. Priest and J. Laskin, ACS Nano, 2012, 6, 573–582 CrossRef CAS PubMed.
- G. E. Johnson, C. Wang, T. Priest and J. Laskin, Anal. Chem., 2011, 83, 8069–8072 CrossRef CAS PubMed.
- Z. W. Wang and R. E. Palmer, Nanoscale, 2012, 4, 4947–4949 RSC.
- H. Li, Y. Pei and X. C. Zeng, J. Chem. Phys., 2010, 133, 134707 CrossRef PubMed.
- L. Li, Y. Gao, H. Li, Y. Zhao, Y. Pei, Z. F. Chen and X. C. Zeng, J. Am. Chem. Soc., 2013, 135, 19336–19346 CrossRef CAS PubMed.
- W. Huang, S. Bulusu, R. Pal, X. C. Zeng and L. S. Wang, ACS Nano, 2009, 3, 1225–1230 CrossRef CAS PubMed.
- S. Bulusu and X. C. Zeng, J. Chem. Phys., 2006, 125, 154303 CrossRef PubMed.
- S. Bulusu, X. Li, L. S. Wang and X. C. Zeng, Proc. Natl. Acad. Sci. U. S. A., 2006, 103, 8326–8330 CrossRef CAS PubMed.
- J. P. Perdew, K. Burke and M. Ernzerhof, Phys. Rev. Lett., 1996, 77, 3865–3868 CrossRef CAS.
- C. Hartwigsen, S. Goedecker and J. Hutter, Phys. Rev. B: Condens. Matter Mater. Phys., 1998, 58, 3641–3662 CrossRef CAS.
- S. Goedecker, M. Teter and J. Hutter, Phys. Rev. B: Condens. Matter Mater. Phys., 1996, 54, 1703–1710 CrossRef CAS.
- H. Haberland, M. Mall, M. Moseler, Y. Qiang, T. Reiners and Y. Thurner, J. Vac. Sci. Technol., A, 1994, 12, 2925–2930 CAS.
- S. H. Baker, S. C. Thornton, K. W. Edmonds, M. J. Maher, C. Norris and C. Binns, Rev. Sci. Instrum., 2000, 71, 3178–3183 CrossRef CAS PubMed.
- D. C. Lim, R. Dietsche, M. Bubek, G. Gantefor and Y. D. Kim, ChemPhysChem, 2006, 7, 1909–1911 CrossRef CAS PubMed.
- R. Dietsche, D. C. Lim, M. Bubek, I. Lopez-Salido, G. Gantefoer and Y. D. Kim, Appl. Phys. A: Mater. Sci. Process., 2008, 90, 395–398 CrossRef CAS PubMed.
- W. P. Peng, M. P. Goodwin, Z. X. Nie, M. Volny, O. Y. Zheng and R. G. Cooks, Anal. Chem., 2008, 80, 6640–6649 CrossRef CAS PubMed.
- Z. X. Nie, G. T. Li, M. P. Goodwin, L. Gao, J. Cyriac and R. G. Cooks, J. Am. Soc. Mass Spectrom., 2009, 20, 949–956 CrossRef CAS PubMed.
- J. Laskin, P. Wang and O. Hadjar, J. Phys. Chem. C, 2010, 114, 5305–5311 CAS.
- G. E. Johnson and J. Laskin, Chem. – Eur. J., 2010, 16, 14433–14438 CrossRef CAS PubMed.
Footnote |
| † Electronic supplementary information (ESI) available: Time-evolution of the total energy and a video of the trajectory of the BOMD simulation for simulating the soft-landing of the Au18 cluster onto a TiO2(110) surface, snapshot structures, the corresponding time-evolution of RminAu–COM, the g(r) functions of the Au–COM distance for the second and the third BOMD simulations Run 2 and 3, videos of the trajectories of the thermal stability test of the pyramidal and the hollow-cage Au18 clusters, and coordinates of the optimized clusters on the TiO2 surface. See DOI: 10.1039/c5cc01316j |
| This journal is © The Royal Society of Chemistry 2015 |


