 Open Access Article
Creative Commons Attribution 3.0 Unported Licence
A mitochondrion targeting fluorescent probe for imaging of intracellular superoxide radicals†
Fang
Si
 ab,
Yang
Liu
c,
Kelu
Yan
a and
Wenwan
Zhong
*bc
aCollege of Chemistry, Chemical and Biological Engineering, Donghua University, Shanghai 201620, P. R. China
bDepartment of Chemistry, University of California, Riverside 92521, USA. E-mail: wenwan.zhong@ucr.edu; Fax: +1-951-827-4732; Tel: +1-951-827-4925
cEnvironmental Toxicology Program, University of California, Riverside 92521, USA
First published on 25th March 2015
Abstract
An amine-reactive fluorogenic molecule specifically turned on by superoxide radicals (O2˙−) was synthesized and coupled to a mitochondrial (MT) targeting peptide. The obtained probe showed superior uptake and MT targeting capabilities; and successfully detected the change in O2˙− levels in cells treated with chemical stimuli or single-walled carbon nanotubes.
Biological systems continuously produce free radicals via a wide range of physiological processes. The radicals can act as secondary messengers and control diverse activities like host defense, inflammation, and cellular signalling.1–4 The levels of radicals are tightly controlled by a series of antioxidants and enzymes.5,6 If the balance is broken due to malfunctioning of the antioxidant protection systems, damage including aging and pathological conditions like cancer, cardiovascular, inflammatory and degenerative diseases, could occur.3,4,7,8 Still, not enough is known about the mechanisms of oxidant and antioxidant action so that effective interventions can be designed, calling for more powerful methodologies to be developed for detecting oxidant production specifically and quantitatively.
Generally produced from oxygen reduction by electrons leaked out from the mitochondrial respiratory chains, the superoxide radical (O2˙−) is the common source of most of the reactive oxygen or nitrogen species (ROS or RNS) found in cells.7,9–11 It can go through dismutation and form H2O2;12 or be oxidized by NO and generate ONOO−.6,9,13,14 These products then continue to react and produce a series of ROS and RNS. Such an essential role makes it imperative to assess O2˙− generation in mechanistic studies on oxidative damage and antioxidant protection.10,11
Current tools for O2˙− assessment often fall in three categories: detection of the unpaired electron by electron spin resonance (EPR); electrochemical sensors based on its redox properties; and optical methods that permit high-throughput screening and imaging in live cells and animals. They can effectively detect the presence of superoxide radicals, but still have limitations. For example, spin traps have been developed to detect superoxide and hydroxyl radicals by EPR, but they are only suitable for measurement of extracellular radicals.15–19 Similarly, electrochemical sensors utilizing immobilized enzymes, nanoparticles, or microelectrodes have been fabricated for detection of superoxide released by cells or in solutions.20–24 Electrodes with immobilized enzymes can provide good specificity but are complicated and delicate to fabricate.21–23 Because of their measurement simplicity and capability to enable in vitro and even in vivo imaging, optical methods have been widely used, taking advantage of various fluorescent and chemiluminescent probes.25,26 They offer good sensitivity, either by the dye itself27 or by nanoparticle-assisted signal enhancement;28 and can dynamically image O2˙− fluctuation using the two-photon technology.29 However, specificity is a big concern. The cyanine-based sensors simultaneously detect other ROS like hydroxyl radicals together with superoxide.30,31 Hydroethidine (HE), the most common fluorescent sensor for detection of O2˙−, can be oxidized by other intracellular processes involving peroxidase and cytochromes to more than one red fluorescence product.32,33 Specificity of the HE-based fluorescence assay can be enhanced by HPLC separation of the multiple products,34,35 or by using two different excitation wavelengths.33 Similar cross-reaction problems could exist for other fluorescent probes that sense superoxide radicals based on redox reactions.
Besides high sensitivity and specificity, imaging probes should target specific organelles, because superoxide radicals are typically generated in mitochondria via respiration, in phagosomes by NADPH oxidase for defense against invading pathogens, or in endoplasmic reticulum during the process of protein folding.11 Their anionic nature makes them impermeable through the organelle membranes and they are converted at their production sites by enzymes or other processes. Monitoring their production and conversion for mechanistic study thus requires probes that can specifically locate at the production sites to gain more information.
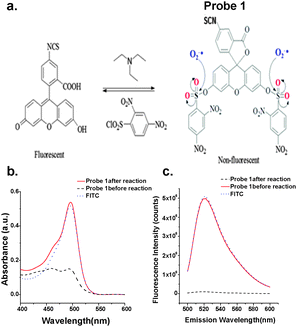
A group of fluorescent probes that detect superoxide via a nonredox mechanism have been reported by Itoh et al.36,37 Superoxide reacts with this group of bis(2,4-dinitrobenzenesulfonyl)fluorescein molecules as a nucleophile, instead of as a reductant. The reaction causes the cleavage of the benzenesulfonyl groups, turning on the fluorescence of fluorescein. A similar reaction mechanism was also employed to design the turn-on O2˙− sensor molecule, bis(diphenylphosphinyl)fluorescein.38 However, localized detection of endogenous O2˙− has not been demonstrated for such dyes. Following the same synthetic route discovered by the Itoh group, we prepared the bi-substituted bis(2,4-dinitrobenzenesulfonyl)fluorescein isothiocyanate (1) (Fig. 1a). The isothiocyanate (–SCN) group is not only readily reactive to free amines, which enables easy conjugation to biological molecules, but also enhances the probe's specificity to O2˙−. Conjugated to the mitochondrial locating signal (MLS) peptide (NH2-MSVLTPLLLRGLTGSARRLPVPRAK-COOH),39 it successfully detected the dynamic change in mitochondrial O2˙− stimulated by various xenobiotics like phorbol 12-myristate 13-acetate (PMA),29,31,36 2-methoxyestradiol (2-ME),40,41 and single-walled carbon nanotubes (SWCNTs).
The reaction scheme is shown in Fig. 1a. In brief, fluorescein isothiocyanate (FITC) reacted with 2,4-dinitrobenzenesulfonyl chloride in dichloromethane (DCM) under the catalysis of trimethylamine. The obtained product was characterized by H1-NMR (Fig. S1a, ESI†) and MS (Fig. S1b, ESI†) to confirm the high purity of the bi-substituted compound. This is important because the mono-substituted product is prone to hydrolysis and is reactive to thiol-containing compounds, both able to turn on its fluorescence.36,37 The bi-substituted compound, probe 1, absorbed poorly between 450 and 520 nm (Fig. 1b), and exhibited negligible fluorescence at λem of 520 nm when excited at 494 nm (Fig. 1c). After reaction with KO2, the superoxide generator, the absorption and fluorescence emission spectra were similar to those of FITC at the same concentration (Fig. 1b and c). The probe reacts with O2˙− very rapidly, reaching the plateau in less than 10 minutes after being mixed with KO2 (Fig. S2a, ESI†). The resulting fluorescence linearly increased with KO2 concentration. As low as 0.65 μM KO2 could be detected using 10 μM probe 1 (Fig. S2b, ESI†). The signal levelled off once all the probes were consumed with KO2 higher than 25 μM (Fig. S2a, ESI†). This result suggests that two O2˙− radicals were needed to remove the two dinitrobenzenesulfonyl groups and convert one probe 1 molecule back to FITC.
Probe 1 has no targeting capability for mitochondria (MT). Therefore, we conjugated it to one of the MLS targeting peptides at the N-terminal via the reaction between –SCN and –NH2. This peptide is the N-terminal portion of one of the endogenous nuclear-encoded MT proteins.39 This portion is responsible for transportation of such proteins into MT, via its interaction with the translocator inner membrane/translocator outer membrane protein complex. The selected peptide contains one lysine residue at the C-terminal that could also be labelled. HPLC analysis showed that all free probe 1 have been conjugated with the peptide (Fig. S3, ESI†).
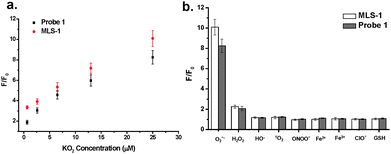
The MLS-1 conjugate displayed comparable fold change to probe 1 in fluorescence intensity upon reaction with KO2 (Fig. 2a). The fluorescent product of probe 1 is fluorescein, the fluorescence of which is very sensitive to pH.43 We observed only background fluorescence from probe 1 or MLS-1 after reaction with KO2 if the solution pH was 5.8. The fluorescence increased dramatically at pH 6.5, reaching the maximum at 8 and being stable up to pH 10 (Fig. S4, ESI†). This result points out that our probe is suitable for superoxide measurement in cytosol (pH 7.0–7.5), endoplasmic reticulum (pH ∼ 7.2), Golgi apparatus (pH ∼ 6.6), and most importantly mitochondrion (7.9–8.0).44,45 But it cannot be used to image superoxide in the acidic organelles like endosome and lysosome. The pH sensitivity of probe 1 also highlights the necessity of using the MLS peptide to deliver the probe to the right intracellular location. The MLS-1 conjugate maintained good selectivity to superoxide radicals over other common interferences like H2O2, ˙OH, ONOO−, ClO−, and the iron ions (Fig. 2b). Both probe-1 and MLS-1 showed no reactivity to GSH, a potential interfering compound present at substantial levels in cells.36,42
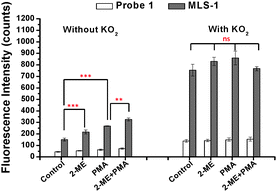
We tested the cellular uptake of MLS-1 and its capability to detect O2˙− change in cells. The Raw 264.7 macrophages (grown in a 24-well microtiter plate at an approximate density of 1 × 10⁴ per well) were treated sequentially with 20 μg mL−1 2-ME for 4 h, 5 μM probe 1 or MLS-1 for 40 min, and 5 μg mL−1 PMA for 30 min. The culture medium was refreshed after incubation with the probes. Thereafter, the cells were washed with 1 × PBS 3 times to remove any residual chemicals not entering the cells, and then incubated with CelLytic™ M, the mammalian cell lysis/extraction reagent from Sigma, for 15 min in a shaker. Upon cell lysis, an aliquot 60 μl of 50 mM phosphate buffer at pH 7.4 was added to each well to suspend the released probe 1 or MLS-1 before fluorescence measurement in a Victor 2 Microplate Reader (Perkin Elmer). The results are shown on the left panel labelled “without KO2” in Fig. 3. The control sample was not treated with either 2-ME or PMA, showing the base level of O2˙− in cells. Some of the O2˙− may have been generated during cell lysis. Nevertheless, the MLS-1 detected a significantly higher level of O2˙− in the cells treated with 2-ME compared to the control cells. This chemical is an inhibitor of superoxide dismutase (SOD), the dominant working machine in converting superoxide into H2O2. Deactivating SOD caused accumulation of O2˙− in cells and thus a higher fluorescence signal was observed for MLS-1. The paired t-test confirmed that the fluorescence signals for MLS-1 in control cells and in cells treated with 2-ME were significantly different at a confidence level of 95% with a p-value smaller than 0.005 (n = 3). Similarly, the O2˙− content was significantly higher in cells treated with PMA, a chemical known to stimulate superoxide generation, with a p-value smaller than 0.01. The combined effect of 2-ME and PMA generated the highest level of O2˙− in cells.
Using probe 1, the overall fluorescence was very low, although a noticeable increase in fluorescence was found in cells treated with PMA or with PMA + 2-ME. The weak signal was due to its low cellular uptake. Cellular uptake was evaluated by adding 10 μM KO2 to react with all probe 1 or MLS-1 molecules used in cell treatment, after the aforementioned fluorescence measurement was finished. Such a KO2 concentration is sufficient to convert all probe 1 molecules to fluorescein in cell lysate. The resulting fluorescence is shown in Fig. 3 on the right panel, labelled “with KO2”. The fluorescence levels for probe 1 or MLS-1 among all cells went up to the same level after reaction with KO2. About 8 times more MLS-conjugate probe 1 was taken by the cells compared to probe 1. This result highlights the necessity of using the MLS peptide to increase the cellular uptake of the superoxide sensor. With the concern that the –SCN group may lead to conjugation of proteins or other free amine containing components in the cell culture medium and thus removal of probe 1 during the washing step, we reacted the –SCN group with a small amine, methylamine, and tested the cellular uptake of the product. No improvement was observed and the overall uptake of the methylamine labelled probe 1 was still much lower than that of the MLS-1 (Fig. S5, ESI†). This means that the low uptake was the result of the fluorophore structure.
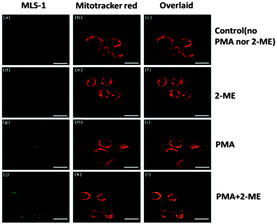
It is also important that the intracellular sensor does not generate a harmful effect on cells. Thus, we treated the Raw 264.7 macrophages at various probe 1 and MLS-1 concentrations (1, 2.5, 5, and 10 μM), and tested the cell viability using the MTT assay. After 6, 12, or 24 h incubation with MLS-1, the viability of the Raw 264.7 cells was not affected (Fig. S6, ESI†). Probe 1 at 10 μM reduced the cell viability to around 90% after 24 h incubation. While the superior safety of MLS-1 permits its usage as an intracellular sensor for O2˙−, the MLS peptide should locate the probe right at MT, so that localized monitoring of radical production can be achieved. Dye localization was confirmed by co-staining the cells with both the superoxide sensor and Mitotracker™ Red (Invitrogen). Since probe 1 or MLS-1 was not fluorescent before reacting with superoxide, the cells were also treated with 2-ME and PMA to stimulate radical generation so that MT localization could be observed clearly. The procedure was similar to the cell uptake experiment, except that the dye was mixed with Mitotracker Red before being added to the cells. After all treatments, the cells were washed and subsequently fixed with 4% formaldehyde at 37 °C for 15 min before fluorescence observation using a Leica SP5 Inverted Confocal Microscope (Leica Microsystems, Inc.). Fig. 4 shows the fluorescence images of MLS-1 (green) and Mitotracker (red), respectively. Both the green fluorescence and red fluorescence were found in the cytosol around the nucleus, which was completely dark without being stained; and the overlaid images confirmed the co-localization of both MLS-1 and Mitotracker Red. In contrast, probe 1 was found at other places without red fluorescence, and even within the nucleus (Fig. S7, ESI†). Agreeing with the cell lysis experiments, the confocal images clearly showed the enhanced green fluorescence while both PMA and 2-ME were used to stimulate the cells, compared to the control cells and to those treated only with 2-ME, under the same light acquisition settings.
Superoxide radicals have short life time because they will be converted to other ROS/RNS by enzymes. One of the main conversion routes is by SOD and the process forms H2O2. To demonstrate that our probe is suitable to image the dynamic change of superoxide radicals, we imaged this conversion process by using both our probe and the red H2O2 sensor from Tocris™ Bioscience, peroxy orange 1 (PO1).46 PO1 can be excited at 543 nm, and emits between 555 and 700 nm. Thus, we can image the fluorescence resulting from both O2˙− and H2O2 simultaneously using PO1 and MLS-1. Both dyes were lit up when the cells were incubated with PMA (Fig. S8, ESI;† fluorescence from PO1 is represented in red). However, in the cells treated with both PMA and 2-ME, the fluorescence from PO1 was much weaker, because 2-ME impeded with the conversion of O2˙− to H2O2, while the green fluorescence from MLS-1 remained intense and was accumulated at specific sites where the MT was located. This result also serves as convincing support for our probe's high selectivity for superoxide radicals over H2O2.
Using this superoxide-specific and MT-targeting conjugate, MLS-1, we studied the oxidative stress induced by invasion of single-walled carbon nanotubes (SWCNTs). MTT assay showed that incubating the Raw 264.7 macrophages with the carboxylated SWCNTs at concentrations of 5, 10, 25, and 50 μg mL−1 caused significant cell death (Fig. S6, ESI†). Correspondingly, the green fluorescence from MLS-1 in MT increased gradually with the increase of SWCNT concentration and/or incubation duration (fluorescent images displayed in Fig. S9, ESI†). This result points out that SWCNT invasion enhanced superoxide production, which was rapidly converted to H2O2 (confirmed by PO1 staining; data not provided). Finally the elevated oxidative stress resulted in cell death.
The MLS-1 was also applied to image superoxide production in epithelial cells (Hela ATCC® CCL-2™) (Fig. S10, ESI†). Similar toxicity, MT targeting, and O2˙− sensing results to those from macrophages were obtained, demonstrating its applicability to diverse cell types.
We have generated a MT-targeting fluorescent probe useful in monitoring the dynamic change of superoxide radical levels in cells. The amine reactivity of probe 1 also permits labelling with biomolecules targeting other organelles to locate superoxide radicals inside the cells. Considering the central role of superoxide radicals in cellular production of ROS/RNS, our probe can be a useful tool for deciphering its functions in cell signalling and host defense.
This work was supported by NSF CAREER CHE #1057113 and the City of Hope Biomedical Research Initiative to W. Zhong. S. Fang was sponsored by the China Scholarship Council.
Notes and references
- T. Akaike, Rev. Med. Virol., 2001, 11, 87 CrossRef CAS PubMed.
- I. Bokkon, Curr. Neuropharmacol., 2012, 10, 287 CrossRef CAS PubMed.
- P. C. Goswami and K. K. Singh, Oxid. Stress, Dis. Cancer, 2006, 705 CAS.
- M. Majzunova, I. Dovinova, M. Barancik and J. Y. H. Chan, J. Biomed. Sci., 2013, 20, 69 CrossRef CAS PubMed.
- M. G. Bonini and A. B. Malik, Cell Res., 2014, 24, 908 CrossRef CAS PubMed.
- M. Inoue, E. F. Sato, A.-M. Park, M. Nishikawa, E. Kasahara, M. Miyoshi, A. Ochi and K. Utsumi, Free Radical Res., 2000, 33, 757 CrossRef CAS.
- A. W. Linnane, M. Kios and L. Vitetta, Mitochondrion, 2007, 7, 1 CrossRef CAS PubMed.
- T. Takeuchi, M. Nakajima and K. Morimoto, Carcinogenesis, 1996, 17, 1543 CrossRef CAS PubMed.
- I. B. Afanas'ev, Mol. Biotechnol., 2007, 37, 2 CrossRef PubMed.
- C. C. Winterbourn, Free Radical Biol. Med., 1993, 14, 85 CrossRef CAS.
- C. C. Winterbourn, Nat. Chem. Biol., 2008, 4, 278 CrossRef CAS PubMed.
- I. A. Abreu and D. E. Cabelli, Biochim. Biophys. Acta, 2010, 1804, 263 CrossRef CAS PubMed.
- G. Ferrer-Sueta and R. Radi, ACS Chem. Biol., 2009, 4, 161 CrossRef CAS PubMed.
- R. Radi, J. Biol. Chem., 2013, 288, 26464 CrossRef CAS PubMed.
- K. Abbas, M. Hardy, F. Poulhes, H. Karoui, P. Tordo, O. Ouari and F. Peyrot, Free Radical Biol. Med., 2014, 71, 281 CrossRef CAS PubMed.
- R. Chen, J. T. Warden and J. A. Stenken, Anal. Chem., 2004, 76, 4734 CrossRef CAS PubMed.
- B. Gopalakrishnan, K. M. Nash, M. Velayutham and F. A. Villamena, J. Visualized Exp., 2012, E2810 Search PubMed.
- D. G. Mitchell, G. M. Rosen, M. Tseitlin, B. Symmes, S. S. Eaton and G. R. Eaton, Biophys. J., 2013, 105, 338 CrossRef CAS PubMed.
- H. B. Hong, H. J. Krause, S. W. Sohn, T. K. Baik, J. H. Park, S. W. Shin, C. H. Park and D. Y. Song, Anal. Biochem., 2014, 447, 141 CrossRef CAS PubMed.
- X. J. Chen, A. C. West, D. M. Cropek and S. Banta, Anal. Chem., 2008, 80, 9622 CrossRef CAS PubMed.
- B. Derkus, E. Emregul and K. C. Emregul, Talanta, 2015, 134, 206 CrossRef CAS PubMed.
- H. Flamm, J. Kieninger, A. Weltin and G. A. Urban, Biosens. Bioelectron., 2015, 65, 354 CrossRef CAS PubMed.
- M. Ganesana, J. S. Erlichman and S. Andreescu, Free Radical Biol. Med., 2012, 53, 2240 CrossRef CAS PubMed.
- G. Moschopoulou and S. Kintzios, Anal. Chim. Acta, 2006, 573–574, 90 CrossRef PubMed.
- C. Lu, G. Song and J.-M. Lin, TrAC, Trends Anal. Chem., 2006, 25, 985 CrossRef CAS PubMed.
- N. Soh, Anal. Bioanal. Chem., 2006, 386, 532 CrossRef CAS PubMed.
- J. J. Gao, K. H. Xu, B. Tang, L. L. Yin, G. W. Yang and L. G. An, FEBS J., 2007, 274, 1725 CrossRef CAS PubMed.
- N. Li, H. Wang, M. Xue, C. Chang, Z. Chen, L. Zhuo and B. Tang, Chem. Commun., 2012, 48, 2507 RSC.
- W. Zhang, P. Li, F. Yang, X. Hu, C. Sun, W. Zhang, D. Chen and B. Tang, J. Am. Chem. Soc., 2013, 135, 14956 CrossRef CAS PubMed.
- B. Bekdeser, M. Ozyurek, K. Guclu and R. Apak, Anal. Chem., 2011, 83, 5652 CrossRef CAS PubMed.
- D. Oushiki, H. Kojima, T. Terai, M. Arita, K. Hanaoka, Y. Urano and T. J. Nagano, J. Am. Chem. Soc., 2010, 132, 2795 CrossRef CAS PubMed.
- J. Zielonka and B. Kalyanaraman, Free Radical Biol. Med., 2010, 48, 983 CrossRef CAS PubMed.
- K. M. Robinson, M. S. Janes, M. Pehar, J. S. Monette, M. F. Ross, T. M. Hagen, M. P. Murphy and J. S. Beckman, Proc. Natl. Acad. Sci. U. S. A., 2006, 103, 15038 CrossRef CAS PubMed.
- C. D. Georgiou, I. Papapostolou and K. Grintzalis, Nat. Protoc., 2008, 3, 1679 CrossRef CAS PubMed.
- l. Wang, S. Liu, Z. Zheng, Z. Pi, F. Song and Z. Liu, Anal. Methods, 2015, 7, 1535 RSC.
- H. Maeda, K. Yamamoto, Y. Nomura, I. Kohno, L. Hafsi, N. Ueda, S. Yoshida, M. Fukuda, Y. Fukuyasu, Y. Yamauchi and N. Itoh, J. Am. Chem. Soc., 2005, 127, 68 CrossRef CAS PubMed.
- H. Maeda, K. Yamamoto, I. Kohno, L. Hafsi, N. Itoh, S. Nakagawa, N. Kanagawa, K. Suzuki and T. Uno, Chem. – Eur. J., 2007, 13, 1946 CrossRef CAS PubMed.
- K. Xu, X. Liu, B. Tang, G. Yang, Y. Yang and L. G. An, Chem. – Eur. J., 2007, 13, 1411 CrossRef CAS PubMed.
- G. Manfredi, J. Fu, J. Ojaimi, J. E. Sadlock, J. Q. Kwong, J. Guy and E. A. Schon, Nat. Genet., 2002, 30, 394 CrossRef CAS PubMed.
- Y. Chen, M. B. Azad and S. B. Gibson, Cell Death Differ., 2009, 16, 1040 CrossRef CAS PubMed.
- P. Huang, L. Feng, E. A. Oldham, M. J. Keating and W. Plunkett, Nature, 2000, 407, 390 CrossRef CAS PubMed.
- H. Zheng, X.-Q. Zhan, Q.-N. Bian and X.-J. Zhang, Chem. Commun., 2013, 49, 429 RSC.
- R. Sjoback, J. Nygren and M. Kubista, Spectrochim. Acta, Part A, 1995, 51, L7–L21 CrossRef.
- N. Demaurex, News Physiol. Sci., 2002, 17, 1–5 CAS.
- J. Llopis, J. M. Mccaffery, A. Miyawaki, M. G. Farquhar and R. Y. Tsien, Proc. Natl. Acad. Sci. U. S. A., 1998, 95, 6803–6808 CrossRef CAS.
- B. C. Dickinson, C. Huynh and C. J. Chang, J. Am. Chem. Soc., 2010, 132, 5906 CrossRef CAS PubMed.
Footnote |
| † Electronic supplementary information (ESI) available: Experimental procedures, NMR and MS results, reaction rate investigation, detection calibration curve for probe 1 only, HPLC results to demonstrate the purity of MLS-1, comparison of response with excess O2˙− between 1 and MLS-1 in solution, cell viability when incubated with probe 1, MLS-1, and SWCNTs, imaging results for probe 1 intracellular location, images from MLS-1 to test SWCNT-induced generation of superoxide, and all results obtained in HeLa cells. See DOI: 10.1039/c5cc01075f |
| This journal is © The Royal Society of Chemistry 2015 |


