
 Open Access Article
 This Open Access Article is licensed under a
 Creative Commons Attribution 3.0 Unported Licence
Assessing dimerisation degree and cooperativity in a biomimetic small-molecule model by pulsed EPR†
K.
Ackermann
,
A.
Giannoulis
,
D. B.
Cordes
,
A. M. Z.
Slawin
and
B. E.
Bode
*
EaStCHEM School of Chemistry, Biomedical Sciences Research Complex and Centre of Magnetic Resonance, University of St Andrews, North Haugh, St Andrews KY16 9ST, UK. E-mail: beb2@st-andrews.ac.uk
First published on 8th January 2015
Abstract
Pulsed electron paramagnetic resonance (EPR) spectroscopy is gaining increasing importance as a complementary biophysical technique in structural biology. Here, we describe the synthesis, optimisation, and EPR titration studies of a spin-labelled terpyridine Zn(II) complex serving as a small-molecule model system for tuneable dimerisation.
Pulsed (or pulse) electron paramagnetic resonance (EPR) spectroscopy can be used to determine reliable distance information on the nanometre scale.1 In recent years, the pulsed electron–electron double resonance (PELDOR or DEER) method,2 in combination with site-directed spin-labelling,3 has been increasingly employed to tackle structural questions on biomacromolecules, such as proteins4 and nucleic acids.5 In addition to the determination of inter-spin distances, the local spin concentration can be accessed via the coupling of randomly distributed molecules.6 Furthermore, the information gained from PELDOR experiments can also be used to assess the number of spins (“spin counting”) present in the system under study using the modulation depth (Δ) of the time trace.7–9 Many proteins form dimers or even higher oligomers in their biologically active state, a dynamic and often equilibrium-driven process. Inter-monomer contacts observed by X-ray crystallography are not necessarily functionally relevant.10 Thus, studying dimerisation processes by EPR would be a major advance in our understanding of such systems. However, the number of EPR oligomerisation studies comprising a quantitative assessment of the experimental modulation depth is limited,8 presumably due to the lack of systematic benchmarking using appropriate model systems.7 Here, we demonstrate a tuneable, templated dimerisation in a small-molecule biomimetic model system. We suggest that further studies on homologous synthetic model systems exhibiting different dimerisation equilibria and kinetics could provide the experimental benchmarks required for successful translation of the PELDOR characteristics involved to corresponding biological systems.
We have chosen a terpyridine (tpy)-based Zn(II) complex as our induced dimerisation model due to the expected high binding constant of the ligand to the metal ion facilitating complex formation.11 Specifically, the model is built from a spin-labelled terpyridine (tpyNO)-based ligand, with Zn(II) as the template. In addition to solvent components, the octahedrally coordinated zinc ion binds a maximum of two tridentate ligand molecules, thereby forming the bis-complex Zn(tpyNO)2. Zn(tpyNO) is the mono-complex and, together with tpyNO, resembles the monomeric state, while the bis-complex resembles the dimer.
Metal–tpy complexes have been widely studied in the field of supramolecular chemistry using both dia- and paramagnetic metal ions,11–15 and have also been of interest in EPR spectroscopy for the determination of nitroxide–nitroxide and metal–nitroxide distance measurements.16 While paramagnetic metal ions could allow measuring the metal–nitroxide distance,16 here, we chose the diamagnetic Zn(II) as it does not shorten relaxation times of the tpyNO ligands by paramagnetic relaxation enhancement.17
In this proof-of-principle study we monitor metal–tpyNO complex formation to benchmark the use of PELDOR modulation depths for quantifying monomer–dimer equilibria. Scheme 1 illustrates the synthesis of the ligand 3 from compounds 1 and 2. 118 and 219,20 were obtained by modified literature procedures. Ligand 3 was synthesised by a Sonogashira coupling between 1 and 2. Full details on the syntheses and characterisations are given in the ESI.†
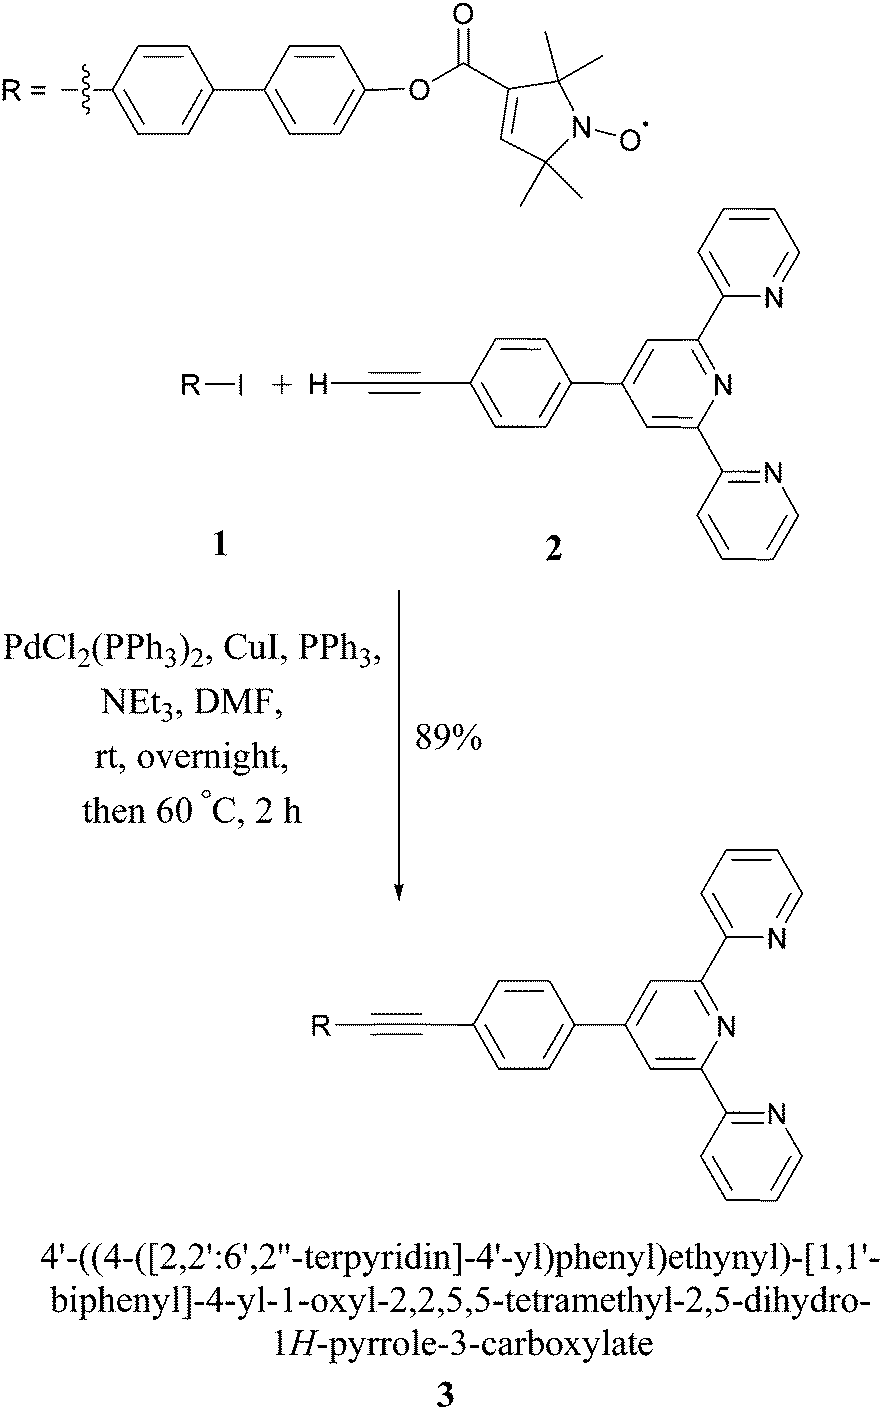 | ||
| Scheme 1 Synthesis of the tpy-based ligand (tpyNO). | ||
The crystal structures of compounds 1 and 3 are shown in Fig. 1. 1 displays significant disorder in the biphenyl unit. This is in agreement with the finding that PELDOR experiments on molecules with similar linkers could only be satisfactorily simulated by assuming large conformational flexibilities and pronounced bending of the aromatic units.21,223 displays disorder in the biphenyl as 1 does, however, it also shows a significant deviation from the linearity that might be expected from a ‘rigid’ and ‘rod-like’ ligand.23 This nicely demonstrates the amount of bending these molecules easily undergo.
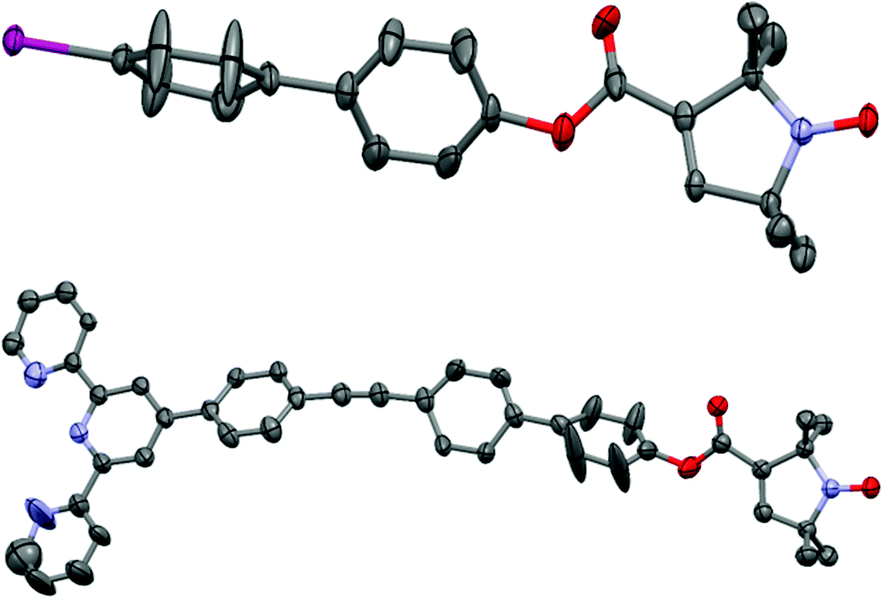 | ||
| Fig. 1 Crystal structures of compounds 1 (top) and 3 (bottom). Displacement ellipsoids are drawn at 50% probability; hydrogen atoms, solvent molecules, and minor components of the disorder are omitted for clarity. | ||
Initially, the Zn(II)–tpyNO bis-complex was synthesised and isolated by precipitation as hexafluorophosphate salt. MALDI mass spectrometry of this precipitate gave the mass of the dication confirming the formation of the bis-complex. However, these samples showed poor solubility and very short phase memory times. Solubility and phase memory times were significantly improved by adding NaBPh4 to the EPR sample. Thus, all samples for this study were prepared with a ten-fold excess of NaBPh4. All PELDOR distance measurements were performed in frozen-solution at 50 K.
For this study, using the in situ generated bis-complex and NaBPh4, the glass-forming solvent system was optimised to 80% DMSO-d6![[thin space (1/6-em)]](https://www.rsc.org/images/entities/char_2009.gif) :10% D2O:10% ethylene glycol. Deuterated solvents allow increasing the evolution time of the PELDOR experiments compared to protonated solvents.24 Conditions to obtain the Zn(II)–nitroxide bis-complex were further modified to allow preparation of a series of small-scale reaction batches for titration, with each reaction batch containing reagents for exactly one EPR sample. Comparing PELDOR results from samples obtained by overnight refluxing with a modified “mix-and-measure” procedure16 showed practically no difference in modulation depths and overall sample quality. Thus, the titration series was prepared on a nanomole scale. The putative structure of the complex used in the titration series is shown in Fig. 2.
:10% D2O:10% ethylene glycol. Deuterated solvents allow increasing the evolution time of the PELDOR experiments compared to protonated solvents.24 Conditions to obtain the Zn(II)–nitroxide bis-complex were further modified to allow preparation of a series of small-scale reaction batches for titration, with each reaction batch containing reagents for exactly one EPR sample. Comparing PELDOR results from samples obtained by overnight refluxing with a modified “mix-and-measure” procedure16 showed practically no difference in modulation depths and overall sample quality. Thus, the titration series was prepared on a nanomole scale. The putative structure of the complex used in the titration series is shown in Fig. 2.
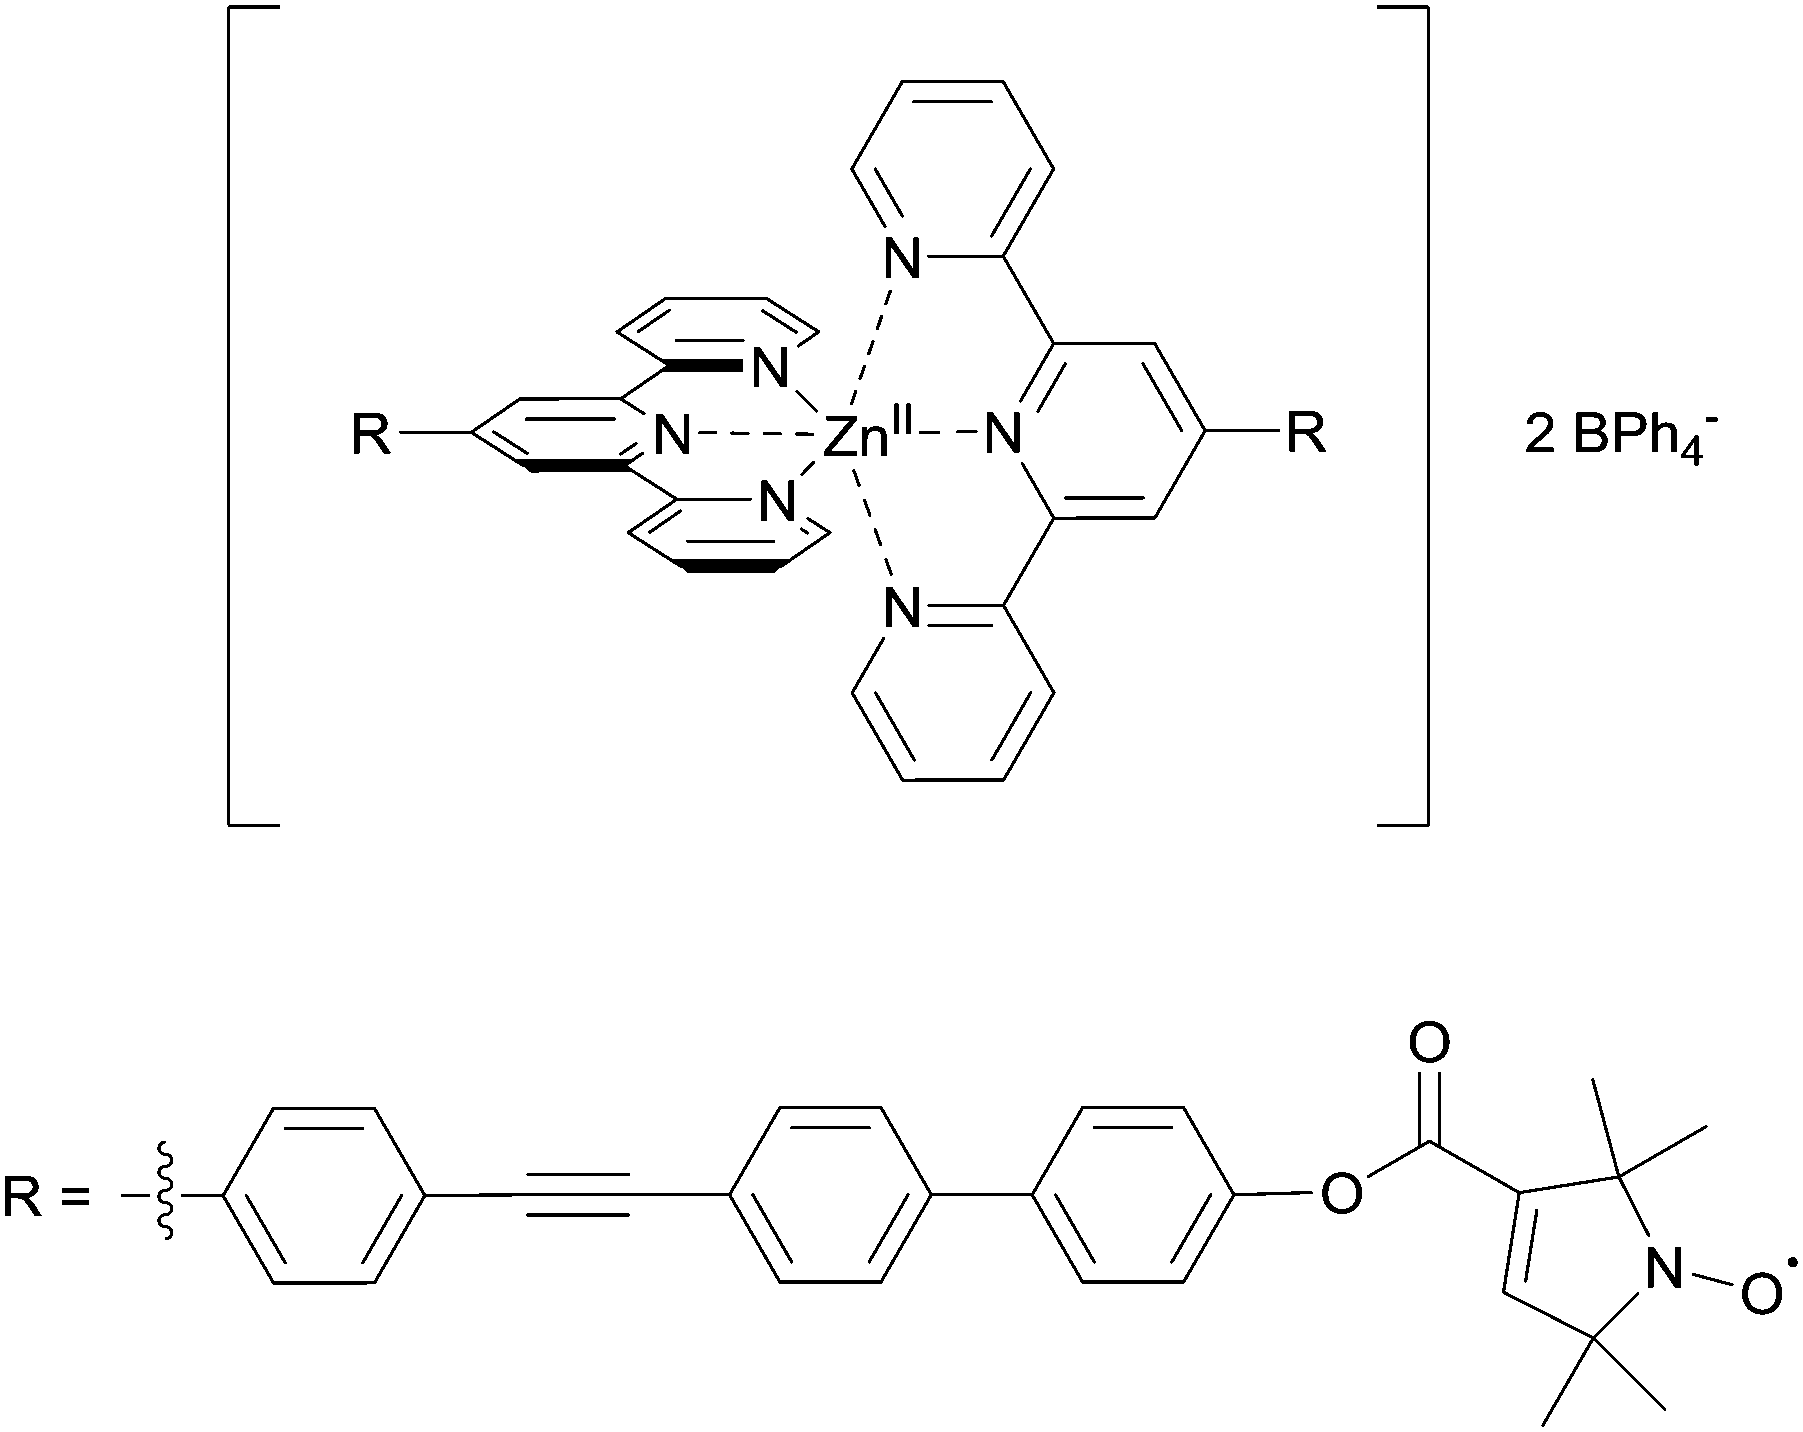 | ||
| Fig. 2 Putative structure of the Zn(II)–tpyNO bis-complex used for the pulsed EPR titration experiment. | ||
Linearity of the complex is enforced by the octahedral coordination leading to a trans-configuration of the two central pyridines bearing the spin-labels. A total of 11 samples was prepared for the PELDOR titration experiment, and the complete series was measured 3 times with independent experiments. In addition, a second titration series was prepared independently to assess the effect of sample preparation. For both series, the concentration of the ligand was kept constant, while the Zn(II)/ligand ratio was varied from 0.0 to 1.0 in 0.1 steps. Thus, the optimum metal-to-ligand ratio in terms of bis-complex concentration is expected at 0.5,11 the point at which each metal ion is complexed with two ligand molecules. To eliminate the contribution caused by intermolecular dipolar interactions we exploited the fact that the sample not containing any Zn(II) only has intermolecular contributions. This negative control allows determining the background contribution experimentally.25,26 As the nitroxide concentration and pulse lengths are identical for all samples the background contribution (i.e. time constant of a monoexponential decay) is known for all samples. Raw data were processed in DeerAnalysis2013.27 Distance distributions were obtained via Tikhonov regularisation using the L-curve criterion.28
All derived distance distributions (see ESI†) gave a single well-defined peak with a mean of 5.2(1) nm (the number in parentheses giving the standard deviation, i.e. the peak width not the error), which is in good agreement with increment models.21,23Fig. 3 shows the PELDOR traces with intermolecular contributions removed and analysis of the modulation depths of the samples used in the titration experiment. As expected, the sample with ratio 0.0 (ligand only) did not show any modulation. Formation of the bis-complex could be followed by changes in the modulation depth (Fig. 3, middle and bottom).7,8 As expected, a gradual increase in the modulation depth was observed up to a metal–nitroxide ratio of 0.5. The maximum modulation depth observed (Δ ± root mean square deviation (RMSD): 0.325 ± 0.014) was smaller than expected. The modulation depth of a biradical equals the modulation depth parameter (λ) which was found to be 0.43 ± 0.02 under similar conditions.7 However, Fig. 3 shows that all modulation depths seem systematically reduced, suggesting that the stoichiometry of the titration samples is correct. Furthermore, in our chosen system the deviation in the expected maximum modulation depth is unlikely to be due to incomplete dimerisation.11,15 Potential reasons for the smaller modulation depth may be linked to the solvent system used and/or diamagnetic impurities competing with the ligand. Further increasing the ratio led to a successive decrease in modulation depth, indicating an increasing concentration of the mono-complex.
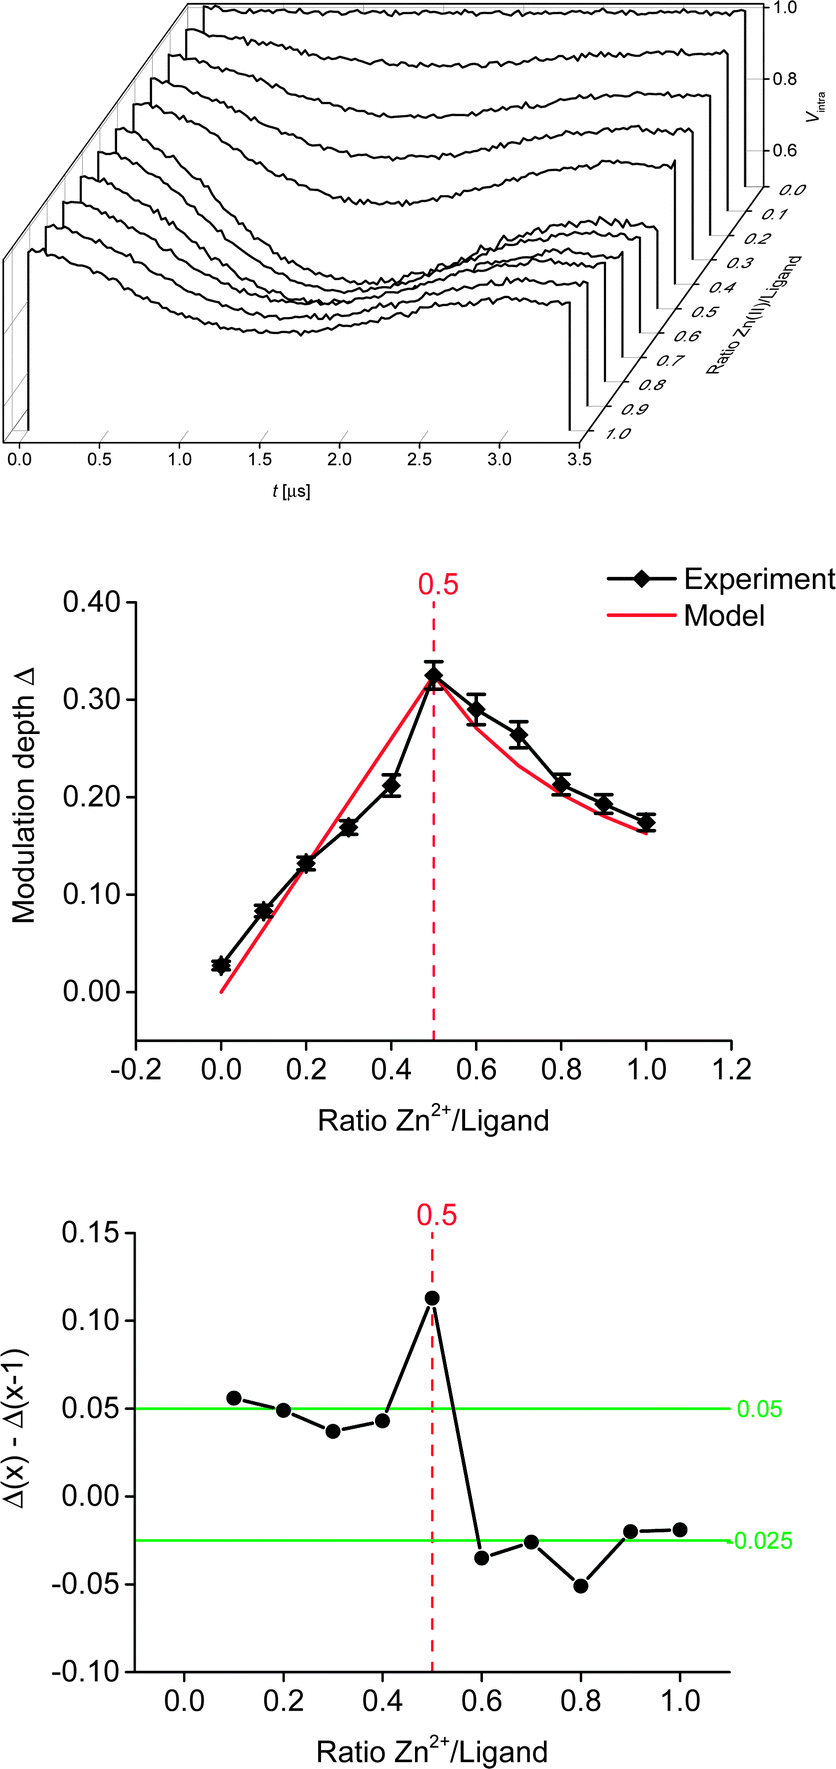 | ||
| Fig. 3 Top: waterfall plot of the background-corrected PELDOR traces. Middle: experimental (±RMSD) and modelled modulation depth. Bottom: respective changes in mean modulation depth in relation to the metal–nitroxide ratio. | ||
However, even at a ratio of 1:1, theoretically allowing 100% mono-complex, ∼54% of bis-complex was still present. This is in good agreement with a previous study, where 60% bis-complex was found at a 1:1 ratio of zinc perchlorate hexahydrate and tpy, using proton NMR in acetonitrile.11 To further investigate the experimental modulation depth, we compared it to a statistical model (normalised to the experimental modulation depth at ratio 0.5) which does not take into account any potential cooperativity of the binding of the ligand to the metal ion, but is purely based on the concentrations present in the mixture. In theory, assuming a fully positive cooperativity, modulation depth would not change any more at ratios >0.5 (strong preference for the bis-complex), whereas at fully negative cooperativity (strong preference for the mono-complex) the modulation depths after ratio 0.5 would mirror the corresponding values before ratio 0.5. Within the experimental error (given here as the RMSD obtained from the DeerAnalysis software, see Fig. 3, which is in good agreement with the standard deviation obtained from three independent measurements per sample, see ESI†) the model closely resembles our data throughout the range of ratios investigated. This indicates that, in this solvent system and with our choice of anions, the Zn–tpyNO binding was not cooperative (neither positive nor negative; see ESI†). This suggestion is further supported by analysing the actual changes in modulation depth in-between each titration step (Fig. 3, bottom). To assess the effect of sample preparation, a second titration series (i.e. 11 samples with ratio 0.0 to 1.0) was set up and analysed as before. While the shape of the titration curve could be accurately reproduced the actual deviations from the obtained modulation depths were larger than in-between the independent measurements of the first series (see ESI†). This suggests that in most practical cases the uncertainties introduced during sample preparation and by background correction will exceed those from reproducibility of modulation depths. It should be noted that the high accuracy shown in this study owes to the correct determination of the background from the control sample without Zn(II).
The fraction of dimer present in a monomer/dimer equilibrium is equal to the ratio Δ over λ. Thus, for a non-templated dimerisation system such as a protein dimer, the dissociation constant KD can in principle be derived from the PELDOR modulation depth and sample concentration (see ESI† for details).
In this proof-of-principle study, we demonstrate for the first time that pulsed EPR spectroscopy can be used to systematically and quantitatively assess complexation processes by inducing dimer formation using a biomimetic templated model system. The degree of complex formation was tuneable via the metal/ligand ratio, and it was possible to quantify changes in the concentration of bis-complex from the modulation depth of the PELDOR experiment. Studies on homologous systems and corresponding mixtures could help improve our understanding of the PELDOR characteristics of dimerisation processes commonly encountered in biomacromolecules.
We thank the EPSRC National Mass Spectrometry Facility, Swansea, Mr Stephen Boyer for elemental analyses and Dr Tomas Lebl and Mrs Melanja Smith for solution NMR spectra. BEB acknowledges Dr Jörn Plackmeyer for his initial work on the spin-labelled ligand. AG is grateful for a postgraduate fellowship by the EPSRC funded doctoral training centre ‘integrated magnetic resonance’. BEB is grateful for an EaStCHEM Hirst Academic Fellowship by the School of Chemistry, St Andrews, and funding from the People Programme (Marie Curie Actions) of the European Union's Seventh Framework Programme (REA 334496).
Notes and references
- A. D. Milov, K. M. Salikov and M. D. Shirov, Fiz. Tverd. Tela, 1981, 23, 975 CAS.
- M. Pannier, S. Veit, A. Godt, G. Jeschke and H. W. Spiess, J. Magn. Reson., 2000, 142, 331–340 CrossRef CAS PubMed.
- C. Altenbach, S. L. Flitsch, H. G. Khorana and W. L. Hubbell, Biochemistry, 1989, 28, 7806–7812 CrossRef CAS.
- G. Jeschke, Annu. Rev. Phys. Chem., 2012, 63, 419–446 CrossRef CAS PubMed.
- O. Schiemann, A. Weber, T. E. Edwards, T. F. Prisner and S. T. Sigurdsson, J. Am. Chem. Soc., 2003, 125, 3434–3435 CrossRef CAS PubMed.
- G. Jeschke and Y. Polyhach, Phys. Chem. Chem. Phys., 2007, 9, 1895–1910 RSC.
- B. E. Bode, D. Margraf, J. Plackmeyer, G. Dürner, T. F. Prisner and O. Schiemann, J. Am. Chem. Soc., 2007, 129, 6736–6745 CrossRef CAS PubMed.
- D. Hilger, H. Jung, E. Padan, C. Wegener, K. P. Vogel, H. J. Steinhoff and G. Jeschke, Biophys. J., 2005, 89, 1328–1338 CrossRef CAS PubMed.
- A. D. Milov, A. B. Ponomarev and Y. D. Tsvetkov, Chem. Phys. Lett., 1984, 110, 67–72 CrossRef CAS.
- P. S. Kerry, H. L. Turkington, K. Ackermann, S. A. Jameison and B. E. Bode, J. Phys. Chem. B, 2014, 118, 10882–10888 CrossRef CAS PubMed.
- R. Dobrawa, P. Ballester, C. R. Saha-Moller and F. Wurthner, in Metal-containing and metallosupramolecular polymers and materials, ed. U. S. Schubert, G. R. Newkome and I. Manners, American Chemical Society, 2006, vol. 928, pp. 43–62 Search PubMed.
- R. Dobrawa and F. Wurthner, J. Polym. Sci., 2005, 43, 4981–4995 CrossRef CAS.
- D. Hinderberger, O. Schmelz, M. Rehahn and G. Jeschke, Angew. Chem., Int. Ed., 2004, 43, 4616–4621 CrossRef CAS PubMed.
- M. A. Meier, B. G. Lohmeijer and U. S. Schubert, J. Mass Spectrom., 2003, 38, 510–516 CrossRef CAS PubMed.
- R. Shunmugam, G. J. Gabriel, K. A. Aamer and G. N. Tew, Macromol. Rapid Commun., 2010, 31, 784–793 CrossRef CAS PubMed.
- E. Narr, A. Godt and G. Jeschke, Angew. Chem., Int. Ed., 2002, 41, 3907–3910 CrossRef CAS.
- S. Lyubenova, M. K. Siddiqui, M. J. Vries, B. Ludwig and T. F. Prisner, J. Phys. Chem. B, 2007, 111, 3839–3846 CrossRef CAS PubMed.
- B. E. Bode, J. Plackmeyer, T. F. Prisner and O. Schiemann, J. Phys. Chem. A, 2008, 112, 5064–5073 CrossRef CAS PubMed.
- W. B. Austin, N. Bilow, W. J. Kelleghan and K. S. Y. Lau, J. Org. Chem., 1981, 46, 2280–2286 CrossRef CAS.
- A. Winter, A. M. J. van den Berg, R. Hoogenboom, G. Kickelbick and U. S. Schubert, Synthesis, 2006, 2873–2878 CAS.
- A. Godt, M. Schulte, H. Zimmermann and G. Jeschke, Angew. Chem., Int. Ed., 2006, 45, 7560–7564 CrossRef CAS PubMed.
- D. Margraf, B. E. Bode, A. Marko, O. Schiemann and T. F. Prisner, Mol. Phys., 2007, 105, 2153–2160 CrossRef CAS.
- P. F. Schwab, M. D. Levin and J. Michl, Chem. Rev., 1999, 99, 1863–1934 CrossRef CAS PubMed.
- S. S. Eaton and G. R. Eaton, in Biological Magnetic Resonance, ed. L. Berliner, J. S. S. Eaton and G. R. Eaton, Kluwer Academic/Plenum Publishers, New York, 2000, vol. 19, pp. 29–154 Search PubMed.
- B. E. Bode, R. Dastvan and T. F. Prisner, J. Magn. Reson., 2011, 211, 11–17 CrossRef CAS PubMed.
- G. Jeschke, V. Chechik, P. Ionita, A. Godt, H. Zimmermann, J. Banham, C. R. Timmel, D. Hilger and H. Jung, Appl. Magn. Reson., 2006, 30, 473–498 CrossRef CAS.
- G. Jeschke, V. Chechik, P. Ionita, A. Godt, H. Zimmermann, J. Banham, C. R. Timmel, D. Hilger and H. Jung, Appl. Magn. Reson., 2006, 30, 473–498 CrossRef CAS.
- Y. W. Chiang, P. P. Borbat and J. H. Freed, J. Magn. Reson., 2005, 172, 279–295 CrossRef CAS PubMed.
Footnote |
| † Electronic supplementary information (ESI) available: General experimental information; synthesis and characterisation of compounds; optimisation of the complex and sample preparation for EPR; EPR instrumentation and collection of PELDOR data; additional PELDOR data from the EPR titration series; models for bis-complex formation; effect of background correction and sample preparation; determination of dissociation constant and error propagation references. CCDC 1029722 and 1029723. For ESI and crystallographic data in CIF or other electronic format see DOI: 10.1039/c4cc08656b |
| This journal is © The Royal Society of Chemistry 2015 |