 Open Access Article
Creative Commons Attribution 3.0 Unported Licence
Aptamer based dispersion assay using tunable resistive pulse sensing (TRPS)†
E. R.
Billinge
and
M.
Platt
 *
*
Chemistry Department, Loughborough University, Loughborough, Leicestershire LE11 3TU, UK. E-mail: m.platt@lboro.ac.uk
First published on 26th August 2015
Abstract
Aggregates of micron sized beads were formed by the binding of anti-thrombin aptamer to its complement. The addition of the thrombin protein target caused a concentration-dependant dispersion of these aggregates, and their number was measured by tunable resistive pulse sensing. The technique allowed the detection of thrombin down to sub picomolar concentrations, and an increase in sensitivity over previous assays on the same platform. The sensitivity of the assay is attributed to each thrombin protein disrupting multiple aggregates resulting in a signal amplification.
In recent decades there has been an increased drive towards the development of rapid, affordable and user-friendly assay techniques; this has been in part directed by the need to reduce assay times and widen the availability of assays available for routine clinical measurements.1–3 Increasingly nanoparticle based assays are the platform of choice for new sensor technologies.4 Significant advancements have been made in synthesis strategies to selectively modify materials and their surface chemistries adding protein and DNA capture probes to enable the development of bioassays.5
The ability of the capture probe to successfully interact with its target is key to providing an assay which is both selective and sensitive. Whilst antibodies have remained the capture probe of choice, aptamer technologies are gaining interest.6 Aptamers are short single stranded oligonucleotides which are able to bind to a wide range of targets with high selectivity and specificity.7 Aptamers are most commonly generated by a process known as the Systematic Evolution of Ligands by Exponential Enrichment (SELEX)8,9 or by Closed Loop Aptameric Directed Evolution (CLADE).6,10,11 Since their discovery aptamers have been increasingly integrated into both existing and emerging sensor platforms – reviews on aptasensors are available.12,13
Aptamers to thrombin have been widely used to test emerging sensor technologies. Thrombin is a protein involved in feedback mechanisms for haemostasis and in the clotting cascade where it catalyses the formation of fibrin.14 The concentration of thrombin must therefore be tightly regulated by biological systems and monitored as any deviations from normal physiological concentrations could pose a risk of blood clot formation leading to heart attack or stroke.15,16 The thrombin aptamer has a well characterised binding mechanism and high affinity, making it an ideal protein target to test emerging sensors.10 Attaching aptamers to nanoparticles allows the combination of the selectivity of the aptamer capture probe with established detection methods of nanoparticles.13 Assay formats include colorimetry,17 lateral flow assays,18 fluorescence,19 light-scattering20 and electrochemistry21 with detection levels as low as 100 fM.21
A recent technology that used aptamer modified particles was pioneered by this laboratory based upon a variation of the Coulter principle.22–26 Coulter-based technologies, known collectively as resistive pulse sensing (RPS), are able to provide a particle-by-particle analysis in situ as individual particles are driven through pores by a combination of electrophoretic, electroosmotic and gravitational forces. RPS has been demonstrated to be useful in many fields, including biological detection27,28 and particle characterisation.22,26 In brief, a single pore in a non-conductive membrane separates two electrolyte-filled fluid chambers with electrode in each; the electrodes establish a stable baseline current and sample is loaded into one of the fluid chambers. As the sample moves through the pore, deformations in the baseline current occur (“blockade events”) as discussed in more detail elsewhere.29 The use of polyurethane, elastomeric membranes in conjunction with RPS has allowed the creation of tunable resistive pulse sensing (TRPS). In TRPS the pore is able to be mechanically manipulated in real time to alter pore geometry and investigate a range of particle sizes with a single pore in addition to allowing significant optimisation and the removal of blockages. Images and a schematic of the instrumentation are displayed in the ESI in Fig. S1.† TRPS has been successfully used to study the concentration,29,30 size31 and charge32,33 of colloidal dispersions as well as monitoring the concentration-dependent aggregation of superparamagnetic beads (SPBs) and the aggregation of nanorods.26
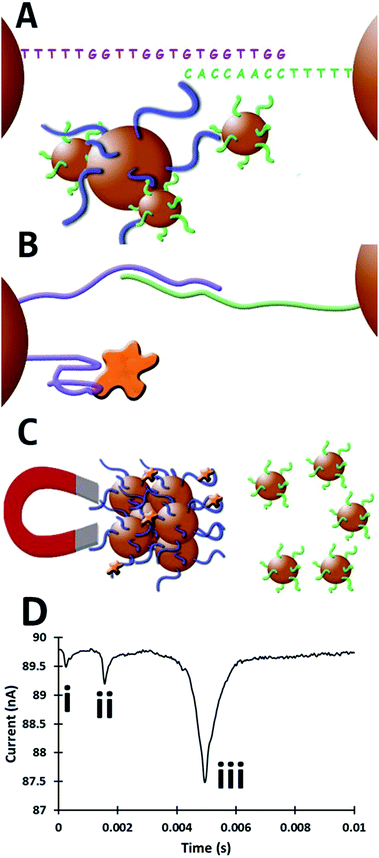
In this assay 1 μm SPBs, (Dynabeads MyOne carboxylic acid) were coated with amine-terminated anti-thrombin-15 aptamer (3′amine-TTTTTGGTTGGTGTGGTTGG5′)35 and either 800 nm or 400 nm carboxyl beads which are not superparamagnetic (Izon Sciences, CPC800, SKP400) were coated with an amine-terminated complementary sequence to the aptamer (3′amine-TTTTTTTTTCCAACCACA5′) as illustrated in Fig. 1. All experiments were conducted in PBST (0.05% Tween-20) buffer unless otherwise stated. Full materials and methods information is provided as ESI.† Initially the two bead populations form aggregates through double-stranded DNA. Upon the introduction of the target protein, the dsDNA structure is disrupted causing the dispersion of the aggregate. By using two bead populations, the SPBs with the anti-thrombin aptamer are able to be removed from the solution by a magnet leaving the dispersed smaller particles for analysis. A schematic of this assay is illustrated in Fig. 1. The number of smaller particles that are dispersed increases with increasing protein concentrations. Herein we present an assay capable of producing a signal at concentrations as low as 100 fM.
In previous work thrombin was detected down to 1.4 nM using aptamer modified beads on the TRPS platform.34 In brief, this previous assay entailed anchoring the aptamer directly to beads surface measuring the relative change in frequency and speed at which the particles move through the pore.34 This approach, while a useful proof-of-concept for the detection of proteins and for aptamer characterisation, involved measuring the diminution of the signal with increased concentration of protein. In addition with the previous method the protein concentration was measured by monitoring the protein–bead conjugate, requiring many proteins to cover the bead to produce an observable signal. Here proteins that bind to aptamers on the larger 1 μm SPBs results in the release of several smaller particles, each individual protein causes a measurable signal producing a more sensitive assay. This new method is favourable for two key reasons: firstly, a positive signal is generated i.e. increased bead concentration with increased thrombin and secondly an increase in assay sensitivity was observed due to a more efficient ratio between protein and measurable signal in comparison with our previous work.34
To first confirm that the DNA had been conjugated to the beads surface, the translocation rate, J, was monitored.
 | (1) |
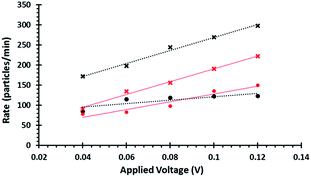
When the pore size, charge, and solution viscosity remain constant, changes to the blockade frequency, J, can be used to infer a change in surface charge. Thus the addition of DNA onto the beads surface should cause an increase in blockade frequency.
The blockade frequencies of DNA modified and unmodified beads were measured under several voltage biases, Fig. 2. Using the relationship between J and V it was possible to get qualitative information that the DNA was present on the beads surface: DNA loading onto the beads increases the negative surface charge density, thereby increasing the rate (particles per min) of beads traversing the pore as well as the gradient when plotting J versus V. This same technique was also used to verify the immobilisation of the aptamer and the partial complementary sequences on the smaller beads.
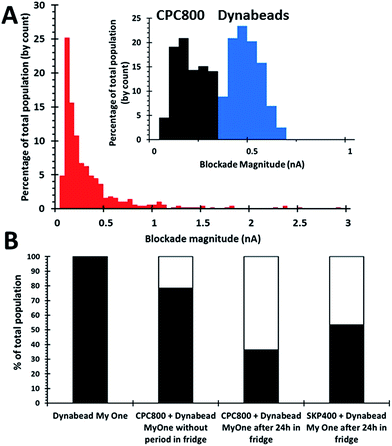
To form SPB beads loaded with their smaller particle payload, the two bead populations are mixed together. Initially 1 × 10⁹ 1 μm beads per mL were mixed with 8 × 10⁹ 800 nm beads per mL on a rotary wheel for 30 minutes. This mixing alone was found to form insufficient aggregate numbers, Fig. 3, and to increase the numbers of aggregates after the initial 30 minute incubation the samples were then stored for a 24 hour period, upright in the fridge. An alternative bead size was prepared under the same conditions, containing 1 × 10⁹ 1 μm beads per mL and 5 × 10¹⁰ 400 nm beads per mL to investigate the effect of bead size of the dispersant on this aptamer-based assay.
Two methods were used to verify the formation of aggregates. Firstly by measuring an increase in blockade magnitude as displayed in Fig. 3A, aggregates typically produce a signal >0.66 nA. As the blockade magnitude is proportional to the volume of the object moving through the pore, it is possible to estimate the number of beads in each aggregate, the modal aggregate size suggested that the aggregates comprised of 2.9 × 800 nm bead per dynabead or 15 × 400 nm beads per dynabead. This is likely to be an underestimation of the number and size of the aggregates as larger clusters could be excluded from the analysis as they are unable to traverse the pore opening.
Further confirmation that the 1 μm beads had picked up their smaller particle cargo was done by simply counting a decrease in the concentration of smaller beads. The total concentration of particles moving through the pore decreases as they form clusters. For the 800 nm particles the concentration of particles in solution had decreased to 2.6 × 10⁹ beads per mL from 8 × 10⁹ beads per mL, whereas the 400 nm the concentration had decreased to 1.3 × 10⁹ beads per mL from 5.1 × 10¹⁰ beads per mL. This decrease in concentration suggests that aggregates have been successfully formed, and these figures as shown as a percentage in Fig. 3B. Based upon these numbers an alternative calculation can then be done to determine the average number of smaller beads per dynabead based upon the particle concentrations before and after incubation. This yielded a mean number smaller beads per dynabead of 5.4 × 800 nm beads or 49 × 400 nm beads.
The discrepancy between the two techniques is most likely be due to a lack of resolution for the pore to successfully resolve the binding of individual beads, and/or the occlusion of some of the larger aggregates due to size.
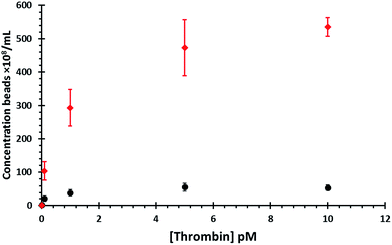
Following the formation of aggregates the prepared bead mixtures were washed by magnetic separation four times and then incubated with varying concentrations of thrombin (thrombin from bovine plasma, Sigma Aldrich) or when a blank control experiment was required with BSA. After 30 minutes the samples were placed into a MagRack until a cluster was visible on the side of the vials (5 minutes) and the supernatant carefully removed to a clean sample vial (Fig. 1C). The concentration of the non-superparamagnetic 800 nm or 400 nm beads within the blank was then also measured, to determine the number of dispersant beads released in the absence of the target, data shown in Fig. 4 and separately displayed in Fig. S2.† The sensitivity of this assay relies upon the ability of TRPS to accurately count dispersed beads. To illustrate the sensitivity of the system in its current configuration a calibration curve was constructed, and is shown in Fig. S3.† The LOD measured by TRPS is highly dependent on the pore size, applied voltage, and pressure. The applied voltage was chosen to be sufficient to observe the particle above the level of baseline noise whilst not causing an increase in baseline noise. The pore size was chosen to allow a clear signal for the beads, and a pressure of 5 cm H2O was applied to decrease the sample capture time and increase sensitivity of the concentration calibrations. The calibration curve was conducted under the same TRPS conditions used for Fig. 4.
Fig. 4 displays the data for both bead sizes, and illustrates that as the concentration of thrombin increases so does the number of dispersed beads. By dividing the number of proteins by the number of dynabeads it is possible to calculate a ratio of proteins![[thin space (1/6-em)]](https://www.rsc.org/images/entities/char_2009.gif) :
:![[thin space (1/6-em)]](https://www.rsc.org/images/entities/char_2009.gif) particle and is listed in Table 1. As each thrombin protein collides with a dynabead it disrupts the dsDNA and stimulates the release of the smaller particles into solution. The interaction of the aptamer and its target is dynamic, and the protein is likely to dissociate from its aptamer and be released back into solution where is can bind to another aptamer, most likely on the same dynabead. The authors acknowledge that the number of aptamers on each dynabead will greatly outnumber the number of proteins. If the protein stays associated with the dynabeads it first makes contact with, it has the opportunity to bind and then dissociate with multiple aptamers on the same bead. As such a lot of protein–aptamer interactions will not cause the release of a smaller bead. But eventually as the protein moves across the particles surface more than one dsDNA interaction will be disrupted. Therefore the magnitude, and speed at which all the particles are dispersed from the dynabead resulting in the “amplification” may well be related to the dissociation rate and as such other targets may not produce the same amplification factor.
particle and is listed in Table 1. As each thrombin protein collides with a dynabead it disrupts the dsDNA and stimulates the release of the smaller particles into solution. The interaction of the aptamer and its target is dynamic, and the protein is likely to dissociate from its aptamer and be released back into solution where is can bind to another aptamer, most likely on the same dynabead. The authors acknowledge that the number of aptamers on each dynabead will greatly outnumber the number of proteins. If the protein stays associated with the dynabeads it first makes contact with, it has the opportunity to bind and then dissociate with multiple aptamers on the same bead. As such a lot of protein–aptamer interactions will not cause the release of a smaller bead. But eventually as the protein moves across the particles surface more than one dsDNA interaction will be disrupted. Therefore the magnitude, and speed at which all the particles are dispersed from the dynabead resulting in the “amplification” may well be related to the dissociation rate and as such other targets may not produce the same amplification factor.
| Thrombin concentration (pM) | Ratio of thrombin proteins per dynabead | %CPC800s released | %SKP400s released |
|---|---|---|---|
| 0 | 0 | 2 ± 1 | 1 ± 0 |
| 0.1 | 0.06 | 38 ± 18 | 20 ± 5 |
| 1 | 0.6 | 70 ± 17 | 55 ± 15 |
| 5 | 3 | 100 ± 18 | 88 ± 14 |
| 10 | 6 | 98 ± 20 | 100 ± 7 |
As the number of beads attached to the dynabeads is finite, as the amount of thrombin increases the curve reaches a maximum which represents all of the smaller beads released from the surface. The percentage of particles released, listed in Table 1, was calculated as the ratio between the number of observed particles divided by the total number of particles observed at 10 pM thrombin.
From Fig. 4 it is apparent that a greater concentration of 400 nm beads are ejected from the dynabeads in solution than the 800 nm beads, although there was minimal difference in the blank values. It was hypothesised that this is due to their smaller size therefore more 400 nm beads would be able to fit around each individual dynabead. Calculations show that the surface area of the dynabeads is large enough to bind to circa 33 × 400 nm particles, and as indicated by the measured values above the TRPS system does not seem capable of measuring such small volume changes. However this increased number of smaller beads per dynabead leads to the release of a larger number of particles per thrombin protein. As we observe from the shape of the concentration curves using the 400 nm beads appears to increase the dynamic range of the assay.
To ensure that the dispersion of the non-SPBs was due to the specific thrombin–aptamer interaction, formed aggregates were also incubated with 3 μM bovine serum albumin solution (Sigma Aldrich, UK). Addition of non-specific protein did not result in any deviation from the measured concentration when no thrombin was present as displayed in Fig. S2.† These control experiments were conducted 4 times across 4 different days (ESI Fig. S2†).
During this dispersion assay we have improved upon sensitivity by three orders of magnitude and are able to measure a signal at 100 fM of thrombin. To enable a comparison between these methods the number of thrombin molecules per bead and the percentage signal output elicited for our initial work is displayed in Table S1.† Although this proof-of-concept assay focusses on the measurement of thrombin protein, it would be possible to easily adapt the assay by simply changing the aptamer which is conjugated to the bead surface and creating a matching complementary sequence.
We present the detection of thrombin protein as low as 100 fM concentration. By using superparamagnetic beads it is possible to easily separate protein-laden beads, which can be difficult to analyse with pore-based technologies, enabling rapid analysis and improving run quality. Though we chose thrombin to act as a proof-of-concept demonstration of the technique in theory this technique could be easily applied to any protein of interest for which there is an available aptamer. As such, this development represents a great advancement in aptamer-based TRPS assays and could pave the way for sensitive protein detecting in a sub 5 minute assay.
Acknowledgements
The authors thank the Centre for Analytical Science at Loughborough University. The work was supported by Loughborough University Chemistry Department (start-up fund) and the European Commission for Research (Nano4Bio FP7-PEOPLE-2012-CIG-321836).Notes and references
- C. Chan, W. Mak, K. Cheung, K. Sin, C. Yu, T. Rainer and R. Renneberg, Annu. Rev. Anal. Chem., 2013, 6, 191–211 CrossRef CAS.
- Y. Song, Y.-Y. Huang, X. Liu, X. Zhang, M. Ferrari and L. Qin, Trends Biotechnol., 2014, 32, 132–139 CrossRef CAS PubMed.
- P. Yager, G. J. Domingo and J. Gerdes, Annu. Rev. Biomed. Eng., 2008, 10, 107–144 CrossRef CAS PubMed.
- V. Gubala, C. C. N. Lynam, R. Nooney, S. Hearty, B. McDonnell, K. Heydon, R. O’Kennedy, B. D. MacCraith and D. E. Williams, Analyst, 2011, 136, 2533–2541 RSC.
- A. H. Latham and M. E. Williams, Acc. Chem. Res., 2008, 41, 411–420 CrossRef CAS PubMed.
- M. Platt, W. Rowe, D. C. Wedge, D. B. Kell, J. Knowles and P. J. Day, Anal. Biochem., 2009, 390, 203 CrossRef CAS PubMed.
- D. H. Bunka and P. G. Stockley, Nat. Rev. Biotechnol., 2006, 4, 588–596 CAS.
- C. Tuerk and L. Gold, Science, 1990, 249, 505–510 CAS.
- A. D. Ellington and W. Szostak Jack, Nature, 1992, 355, 850 CrossRef CAS PubMed.
- M. Platt, W. Rowe, J. Knowles, P. J. Day and D. B. Kell, Integr. Biol., 2009, 1, 116–122 RSC.
- C. G. Knight, M. Platt, W. Rowe, D. C. Wedge, F. Khan, P. J. Day, A. McShea, J. Knowles and D. B. Kell, Nucleic Acids Res., 2009, 37, 1–10 CrossRef PubMed.
- E. J. Cho, J.-W. Lee and A. D. Ellington, Annu. Rev. Anal. Chem., 2009, 2, 241–264 CrossRef CAS PubMed.
- T.-C. Chiu and C.-C. Huang, Aptamer-functionalized nano-biosensors, Sensors, 2009, 9(12), 10356–10388 CrossRef CAS PubMed.
- E. Di Cera, Mol. Aspects Med., 2008, 29, 203–254 CrossRef CAS PubMed.
- T. J. Tegos, E. Kalodiki, S.-S. Daskalopoulou and A. N. Nicolaides, Angiology, 2000, 51, 793–808 CrossRef CAS PubMed.
- I. Martínez-Martínez, A. Østergaard, R. Gutie, N. Bohdan, A. Min, C. Pascual, C. Martínez and M. E. de Morena-barrio, Blood, 2012, 120, 900–904 CrossRef PubMed.
- H. Wei, B. Li, J. Li, E. Wang and S. Dong, Chem. Commun., 2007, 3735–3737 RSC.
- H. Xu, X. Mao, Q. Zeng, S. Wang, A.-N. Kawde and G. Liu, Anal. Chem., 2009, 81, 669–675 CrossRef CAS PubMed.
- W. Wang, C. Chen, M. Qian and X. S. Zhao, Anal. Biochem., 2008, 373, 213–219 CrossRef CAS PubMed.
- R. J. C. Brown and M. J. T. Milton, J. Raman Spectrosc., 2008, 1313–1326 CrossRef CAS PubMed.
- C. Deng, J. Chen, Z. Nie, M. Wang, X. Chu, X. Chen, X. Xiao, C. Lei and S. Yao, Anal. Chem., 2009, 81, 739–745 CrossRef CAS PubMed.
- E. L. C. J. Blundell, L. J. Mayne, E. R. Billinge and M. Platt, Anal. Methods, 2015, 1–12 Search PubMed.
- E. Weatherall and G. R. Willmott, Analyst, 2015, 7, 7055–7066 Search PubMed.
- R. R. Henriquez, T. Ito, L. Sun and R. M. Crooks, Analyst, 2004, 129, 478–482 RSC.
- D. Kozak, W. Anderson, R. Vogel and M. Trau, Nano Today, 2011, 6, 531–545 CrossRef CAS PubMed.
- M. Platt, G. R. Willmott and G. U. Lee, Small, 2012, 8, 2436–2444 CrossRef CAS PubMed.
- K. D. Connolly, G. R. Willis, D. B. N. Datta, E. A. Ellins, D. A. Price, I. A. Guschina, D. A. Rees and P. E. James, J. Lipid Res., 2014, 55, 2064–2072 CrossRef CAS PubMed.
- J. C. Patton, A. H. Coovadia, T. M. Meyers and G. G. Sherman, Clin. Vaccine Immunol., 2008, 15, 388–391 CrossRef CAS PubMed.
- G. R. Willmott, R. Vogel, S. S. C. Yu, L. G. Groenewegen, G. S. Roberts, D. Kozak, W. Anderson and M. Trau, J. Phys.: Condens. Matter, 2010, 22, 454116 CrossRef CAS PubMed.
- G. S. Roberts, S. Yu, Q. Zeng, L. C. L. Chan, W. Anderson, A. H. Colby, M. W. Grinstaff, S. Reid and R. Vogel, Biosens. Bioelectron., 2012, 31, 17–25 CrossRef CAS PubMed.
- R. Vogel, G. Willmott, D. Kozak, G. S. Roberts, W. Anderson, L. Groenewegen, B. Glossop, A. Barnett, A. Turner and M. Trau, Anal. Chem., 2011, 83, 3499–3506 CrossRef CAS PubMed.
- R. Vogel, W. Anderson, J. J. Eldridge, B. Glossop and G. R. Willmott, Anal. Chem., 2012, 84, 3125–3131 CrossRef CAS PubMed.
- D. Kozak, W. Anderson, R. Vogel, S. Chen, F. Antaw and M. Trau, ACS Nano, 2012, 6, 6990–6997 CrossRef CAS PubMed.
- E. R. Billinge, M. Broom and M. Platt, Anal. Chem., 2014, 86, 1030–1037 CrossRef CAS PubMed.
- L. C. Bock, L. C. Griffin, J. A. Latham, E. H. Vermaas and J. J. Toole, Nature, 1992, 355, 564–566 CrossRef CAS PubMed.
Footnote |
| † Electronic supplementary information (ESI) available: Materials and methods section detailing experimental protocols, supplementary Fig. 1 displaying control experiments. See DOI: 10.1039/c5ay01655j |
| This journal is © The Royal Society of Chemistry 2015 |


