
 Open Access Article
 This Open Access Article is licensed under a Creative Commons Attribution-Non Commercial 3.0 Unported Licence
Determination of methiocarb pesticide using differential pulse voltammetry with a boron-doped diamond electrode
J.
Chýlková
a,
M.
Tomášková
*a,
I.
Švancara
b,
L.
Janíková
a and
R.
Šelešovská
a
aInstitute of Environmental and Chemical Engineering, Faculty of Chemical Technology, University of Pardubice, Studentská 573, CZ-532 10 Pardubice, Czech Republic. E-mail: Marketa.Tomaskova@upce.cz
bDepartment of Analytical Chemistry, Faculty of Chemical Technology, University of Pardubice, Studentská 573, CZ-532 10 Pardubice, Czech Republic
First published on 29th April 2015
Abstract
In this article, a simple and rapid method is described for voltammetric determination of methiocarb (MTC, a pesticide of the carbamate type). Direct oxidation of MTC at a highly positive potential of about +1.4 V vs. Ag/AgCl was found to be feasible, thanks to the excellent performance of the working boron-doped diamond electrode in combination with the differential pulse voltammetric ramp. After optimisation of important parameters, the signal of MTC could be calibrated in an interval of 1–55 μg mL−1 MTC, when offering a detection limit (3σ) of ca. 0.15 μg mL−1 MTC. The practical applicability of the method has been demonstrated on analyses of a commercial pesticide, either with respect to the total content of MTC or as its gradual and time-controlled dissolution in the model sample of the natural aquatic system.
Introduction
Carbamates are one of the major classes of synthetic pesticides and due to their broad biological activities, these compounds are used on a large scale around the world.1 The most commonly used pesticide with insecticidal and molluscicidal activity is methiocarb (MTC; 3,5-dimethyl-4-(methylthio)phenyl methylcarbamate); see Scheme 1. Since the 1960s, this substance has been used as a pesticide for variety of invertebrate pests and also in the form of a bird repellent on fruit crops.2–4 Outdoor use of MTC is likely to have adverse effects on aquatic and terrestrial species that can be divided into several groups:3–8 from slight toxicity towards waterfowl and practical harmfulness for upland game birds, via significant impact on many species of coldwater and warmwater fish, up to high toxicity for aquatic invertebrates and honey bees. | ||
| Scheme 1 Methiocarb (MTC). | ||
In Czech Republic, commonly used pesticides are also organophosphates,9–11 representing, however, the compounds with the most frequent poisoning due to their substantial neurotoxic activity.
It is quite well known that the application of these compounds in commercial formulations is effective with respect to their rapid bio-degradability in the environment and, in general, high selectivity.2 On the other hand, organophosphates are rather dangerous to human health when used inappropriately or even carelessly. Similarly to the above-mentioned carbamates, the main principle of action is an inhibition of acetylcholinesterase (ACHE) in the central nervous system.3,7 Nevertheless, there is a certain difference in the mechanism, in that organophosphate inhibitors are bound irreversibly, whereas the carbamates are pseudo-irreversible in nature and the application of the latter is therefore more friendly from an environmental point of view. In particular this is the reason why the latest applications of pesticides are turning in favour of carbamates, including methiocarb; a typical example being its use for reducing the overgrowth of zooplankton.9–11
In order to monitor and control the content of MTC, there is an increasing demand for reliable, sufficiently sensitive, and accessible analytical methods with the respective procedures. Herein, a collection of about twenty such approaches can be presented, comprising the employment of HPLC,12–19 gas chromatography,20–25 or the so-called QuEChERS, a special extraction methodology26–28 that enables one to determine a wide variety of carbamates—often, in simultaneous analyses—in different types of samples.
Also electrochemical methods with typically inexpensive instrumentation are potentially applicable to the determination of various pesticides,29,30 offering a very good analytical performance in relatively simple procedures and usually without derivatisation step(s) incorporated in some chromatographic detections (see e.g.ref. 17 and 18). For instance, this can be demonstrated by an extensive study from the early 1980s,31 in which 13 different carbamates had been investigated with respect to their electrochemical activity and solely a quartet of compounds—namely, in alphabetical order: aminocarb, methiocarb, pirimicarb, and zectran—were found to give rise to measurable oxidation waves. The electroactive pesticides could be detected in buffered aqueous and methanolic solutions with a glassy carbon electrode (GCE). Regarding methiocarb, its oxidation signals appeared superposed upon the oxygen evolution wave, but their mutual resolution had varied from case to case, depending on the actual background current (or “signal-to-noise ratio”, respectively) and the measuring mode, when e.g. determination in flowing streams was found impossible.
Ni et al.32 reported on the determination of four carbamate pesticides; namely, carbaryl, carbofuran, isoprocarb, and propoxur in various water samples. Also in this case, the GCE was used combined with differential pulse voltammetry (DPV), when diluted perchloric acid had served as the supporting electrolyte of choice. As the voltammetric signals of the individual analytes largely overlapped and the resultant responses exhibited mostly non-linear character, various chemometric calibration models had to be applied in order to facilitate simultaneous determination of the individual analytes.
In a recent study,33 Inam and Bilgin examined voltammetric determination of methiocarb with a new type of (multiwalled) carbon nanotube electrode in combination with square-wave voltammetry (SWV). After inevitable optimisation, the signal(s) of interest could be calibrated in 0.1 mol L−1 H2SO4 over a concentration range of 1.5–59.1 mg L−1 MTC and with a detection limit of 0.45 mg L−1 MTC. The resultant method was characterised as simple, fairly insensitive to matrix effects, when the analyte could be determined in a commercial insecticide (formulation), as well as selected samples of natural water and polluted soil.
Finally, there is a study performed with boron-doped diamond-based electrodes (BDDEs34) capable of achieving a highly effective detection of four selected carbamates: bendiocarb, carbaryl, carbofuran, and methyl 2-benzimidazole-carbamate, after their chromatographic separation. It has been confirmed that the conductive diamond applied in the form of a thin film attached to the GCE substrate is a de luxe sensing material, when the corresponding electrodes were found to be far superior to other carbon-based configurations. The BDDEs exhibited stable and sensitive responses for all carbamate pesticides of the phenolic family despite the high oxidation potentials needed. At low(er) potentials, their performance was yet even better for almost all electroactive pesticides tested.
This article reports on the electrochemistry and voltammetric determination of methiocarb at such a BDDE, having been, for more than a decade, among the most popular electrode configurations in current-flow/faradic measurements.35–37 As shown in the following sections, the choice of this electrode and the elaboration of the respective method allowed us to obtain a simple and quick-to-use tool to determine methiocarb in two environments – in a commercial product and pond water.
Experimental
Chemical and reagents
Standard solutions of the substance of interest were prepared in a wide concentration range from 3.22 mg L−1 up to 980 mg L−1 by dissolving the appropriate amount of methiocarb (MTC; 99.5%, Merck) in methanol (p.a. grade; Penta, Chrudim, Czech Republic); all these solutions being stored in a dark place at 4 °C.The following stock solutions were used for adjusting the desired pH during measurements: (i) 1 mol L−1 sulphuric acid (prepared from 96% H2SO4; Penta, Chrudim, CZ), eventually, an adequately pipetted volume of conc. H2SO4 diluted 1![[thin space (1/6-em)]](https://www.rsc.org/images/entities/char_2009.gif) :1; (ii) 1 mol L−1 chloroacetate buffer with pH 3.50 and containing monochloroacetic acid (Lachema Brno, CZ) + an appropriate amount of 4 mol L−1 NaOH; (iii) 1 mol L−1 acetate buffer, pH 4.53, prepared from sodium acetate and acetic acid (both of p.a. grade, Lachema); (iv) 1 mol L−1 citrate buffer, pH 6.62, made from crystalline citric acid (p.a. grade, Penta) and an appropriate amount of 4 mol L−1 NaOH; (v) 1 mol L−1 phosphate buffer, pH 7.50, containing sodium hydrogen phosphate (Na2HPO4; p.a. grade, Lachema) with the addition of phosphoric acid (65% H3PO4; Lachema) and the addition of diluted NaOH.
:1; (ii) 1 mol L−1 chloroacetate buffer with pH 3.50 and containing monochloroacetic acid (Lachema Brno, CZ) + an appropriate amount of 4 mol L−1 NaOH; (iii) 1 mol L−1 acetate buffer, pH 4.53, prepared from sodium acetate and acetic acid (both of p.a. grade, Lachema); (iv) 1 mol L−1 citrate buffer, pH 6.62, made from crystalline citric acid (p.a. grade, Penta) and an appropriate amount of 4 mol L−1 NaOH; (v) 1 mol L−1 phosphate buffer, pH 7.50, containing sodium hydrogen phosphate (Na2HPO4; p.a. grade, Lachema) with the addition of phosphoric acid (65% H3PO4; Lachema) and the addition of diluted NaOH.
If not stated otherwise, the determination of MTC was performed in mixed media, containing 10% (v/v) MeOH. Regarding the commercial product selected for the first testing analysis, a weighed portion of Mesurol® (“Schneckenkorn”; AgroBio Opava, CZ) served as one of the real samples.
Apparatus, electrodes, and other instrumentation
Voltammetric analyses were performed using an electrochemical analyser (model “EP 100VA”, HSC Servis Bratislava, Slovakia) in connection with the 3-electrode cell comprising the working BDDE, an Ag|AgCl|3 M KCl reference, and a Pt-plate (3 × 5 mm) as the counter electrode (both Monokrystaly Turnov, CZ). The boron-doped diamond electrode was represented by an electrode chip configuration described previously38,39 and consisting of a BDD film lithographically deposited onto a Si-wafer substrate, tailored into a disc shape and so fixed in a plastic body (with inner diameter, ∅ = 3 mm). Its resistivity was 0.075 Ω cm at a boron doping level of 1000 ppm as declared by the producer (Windsor Scientific Ltd., UK).Whenever needed, the pH of solutions to be analysed was measured with an InoLab E-meter (model “pH 720”; WT Werke, Germany) equipped with a combined glass pH-electrode (“Sen Tix 41” type; the same manufacturer).
Voltammetric procedure(s)
Determination of methiocarb was performed in the differential pulse voltammetric mode (DPV) by direct measurement—i.e., without accumulation—and when using the instrumental setting as listed in Table 1 (most of these parameters were set based on our previous experience with measurements of similar substances).| Parameter/mode | Setting |
|---|---|
| Potential ramp | DPV |
| Current range | ±4 μA |
| Initial potential, Ein | +0.4 V |
| Final potential, Efin | +1.7 V |
| Scan rate (v) | 40 mV s−1 |
| Pulse amplitude (height) | 30 mV |
| Pulse length (increment) | 60 ms |
A typical analysis then proceeded as follows: into a mixture of 200 μL conc. H2SO4 (1:1) + 1 mL MeOH in a voltammetric vessel, 9 mL water (or adequate volume of the respective sample) were added and left to purge by bubbling with inert gas for ca. 5 min. After checking the set-up of all instrumental parameters (see Table 1), the model/sample solution (10 mL in total volume) was analysed by scanning the potential ramp in the anodic direction and the signal of interest at about +1.4 V vs. Ag/AgCl registered. In the case of serial analyses, the scanning was repeated as required (note: meanwhile, no special regeneration or mechanical cleaning of the working BDDE was needed). Last but not least, the concentration of MTC was quantified by means of the standard addition method with multiple aliquots.
Results and discussion
Optimisation of conditions for MTC determination
From the literature data it was evident that voltammetric detection of methiocarb would require an electrode with a sufficiently wide potential window during the anodic scanning like that reported for (electrocatalytically acting) nanotube-based sensors.33 Similar to this, also the boron-doped diamond might offer comparable polarisation capabilities with generally low background currents, which was one of the reasons why the BDDE had been selected for the study presented herein. Its other benefits then came along: the chemical stability, biological biocompatibility, and mechanical resistance;36,37,40 all representing important aspects for practical electroanalysis. Finally, for electroactive pesticides, the same working electrode has also been successfully used previously.38,39At first, the anodic oxidation of methiocarb was studied depending on the varied pH. The respective measurements were carried out in six solutions; namely: (i) 0.1 mol L−1 H2SO4; (ii) 0.1 mol L−1 chloroacetate (pH 3.50), (iii) 0.1 mol L−1 acetate (pH 4.53), (iv) 0.1 mol L−1 citrate (pH 6.62), and (v) 0.1 mol L−1 phosphate buffer (pH 7.20) plus (vi) 0.1 mol L−1 NaOH, completing the set. Regarding the concentration of the pesticide, it was intentionally varied in an interval from 9.70 μg mL−1 to 80.92 μg mL−1 MTC.
Based on the observations made, it can be stated that the increasing pH—i.e., the lower acidity—has given rise to the enhanced sensitivity of the detection except in highly alkaline media of sodium hydroxide with no evident response. Fig. 1 documents this behaviour, illustrating two sets of calibration voltammograms for the oxidation of MTC in 0.1 mol L−1 H2SO4 (A) and citrate buffer (B); both experiments resulting in a linear dependence between the peak height and concentration of MTC up to a certain limit (see below).
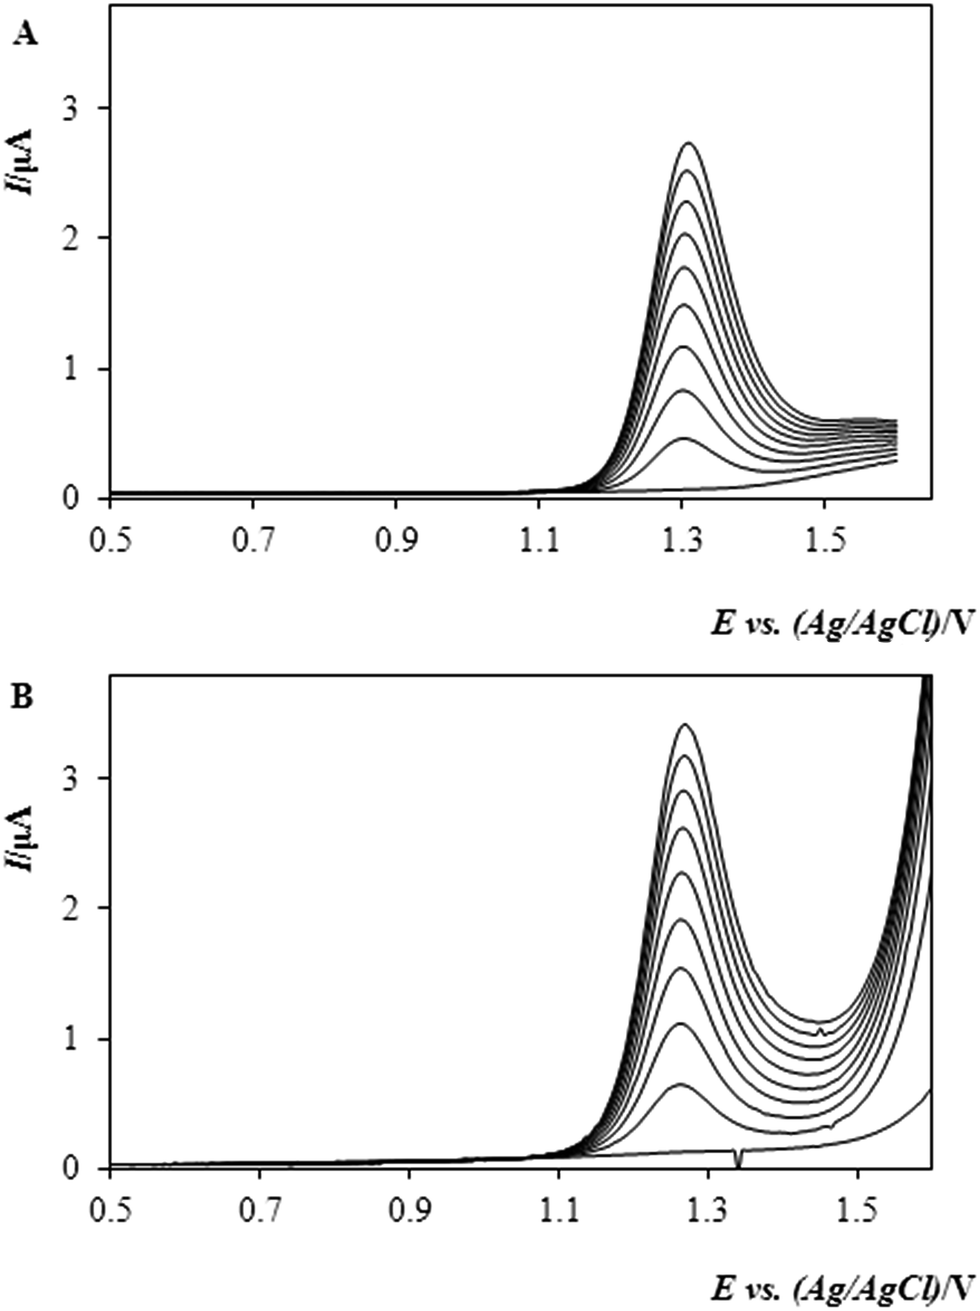 | ||
| Fig. 1 DP-voltammograms of MTC in the supporting electrolyte of (A) 0.1 mol L−1 H2SO4 and (B) 0.1 mol L−1 citrate buffer with pH 6.62. Exp. conditions: DPV ramp, Ein +0.3 V, Efin +1.6 V, scan rate: 40 mV s−1, MTC in the concentration range of 9.7 μg mL−1 to 80.9 μg mL−1. | ||
The corresponding regression equations, along with the other ones calculated from the analyses of the remaining solutions have been evaluated with the aid of statistical program “Adstat”41 and are given in Table 2, together with the individual correlation coefficients and detection characteristics summarising the results of this key study. By comparing the data in the table and taking the widest linearity as the criterion of primary importance, acidic media of 0.1 mol L−1 H2SO4 were selected for further measurements, allowing us to calibrate the system up to 55 μg mL−1. In order to widen the linearity range as much as one could get, the next assay was focused on the effect of the increasing content of methanol, MeOH, in the sample solution; herein, in mutual mixtures with 0.1 mol L−1 H2SO4 as the electrolyte of choice (see above).
| Solution # | Composition of the supporting electrolyte | Regression equation correlation coefficient; LOD/LOQ (both in [μg mL−1]) | Linear range up to ca. (in [μg mL−1]) |
|---|---|---|---|
| a I P: peak height; LOD: limit of detection, LOQ: limit of quantification; *: for explanation, see text. | |||
| 1 | 0.1 mol L−1 H2SO4 | I P = 0.0306c + 0.0711 | c max = 55 |
| R = 0.9984; 0.23/0.50 | |||
| 2 | 0.1 mol L−1 chloroacetate buffer; pH 3.5 | I P = 0.047c + 0.0904 | c max = 31 |
| R = 0.9986; 0.38/0.49 | |||
| 3 | 0.1 mol L−1 acetate buffer; pH 4.53 | I P = 0.043c + 0.0689 | c max = 32 |
| R = 0.9990; 0.29/0.38 | |||
| 4 | 0.1 mol L−1 citrate buffer; pH 6.62 | I P = 0.0456c + 0.121 | c max = 39 |
| R = 0.9984; 0.34/0.52 | |||
| 5 | 0.1 mol L−1 phosphate buffer; pH 7.24 | I P = 0.0524c + 0.122 | c max = 24 |
| R = 0.9992; 0.31/0.43 | |||
| 6 | 0.1 mol L−1 NaOH; pH ca. 13 | (The analyte could not be detected*) | |
It was found out that the increasing content of MeOH did not improve the resultant linearity so much; nevertheless, the presence of this solvent had revealed certain benefit. Namely, a percentage of about 10% (v/v) MeOH was found to give rise to the most satisfactory signal-to-noise ratio and hence, the solutions of 0.1 mol L−1 H2SO4 in 10% MeOH were used in the next experiments. Otherwise, the results of calibration measurements and their statistical evaluation from experimentation with the remaining MeOH-containing solutions are gathered in Table 3 in a similar arrangement like the previous survey. Concerning the effect of MeOH, it should be yet noted that measurements in solutions with a higher content of MeOH already suffered from unwanted shifts of the signal of interest to more positive potentials; i.e., towards the region with generally higher background.
| Solution # | Composition of the supporting electrolyte | Regression equation correlation coefficient; LOD/LOQ (both in [μg mL−1]) | Linear range up to ca. (in [μg mL−1]) |
|---|---|---|---|
| a I P: peak height; LOD: limit of detection, LOQ: limit of quantification. | |||
| 1 | 0.1 mol L−1 H2SO4 | I p = 0.0306c + 0.0711 | c max = 55 |
| R = 0.9984; 0.23/0.50 | |||
| 2 | 0.1 mol L−1 H2SO4 + 10% MeOH | I p = 0.0396c + 0.0480 | c max = 55 |
| R = 0.9997; 0.15/0.28 | |||
| 3 | 0.1 mol L−1 H2SO4 + 20% MeOH | I p = 0.0349c + 0.0333 | c max = 56 |
| R = 0.9982; 0.20/0.45 | |||
| 4 | 0.1 mol L−1 H2SO4 + 30% MeOH | I p = 0.0271c + 0.0497 | c max = 63 |
| R = 0.9999; 0.16/0.35 | |||
| 5 | 0.1 mol L−1 H2SO4 + 40% MeOH | I p = 0.0222c + 0.0214 | c max = 64 |
| R = 0.9999; 0.11/0.29 | |||
Fig. 2 illustrates a typical cyclic voltammogram obtained by analysing the behaviour of methiocarb with the BDDE and in mixed supporting medium of diluted sulphuric acid with MeOH (10%, v/v). A particularly well-developed curve – if one imagines the extremely high positive potential – documents clearly that the pesticide and its oxidation product represent a totally irreversible system unable to convert between the oxidised and reduced forms.
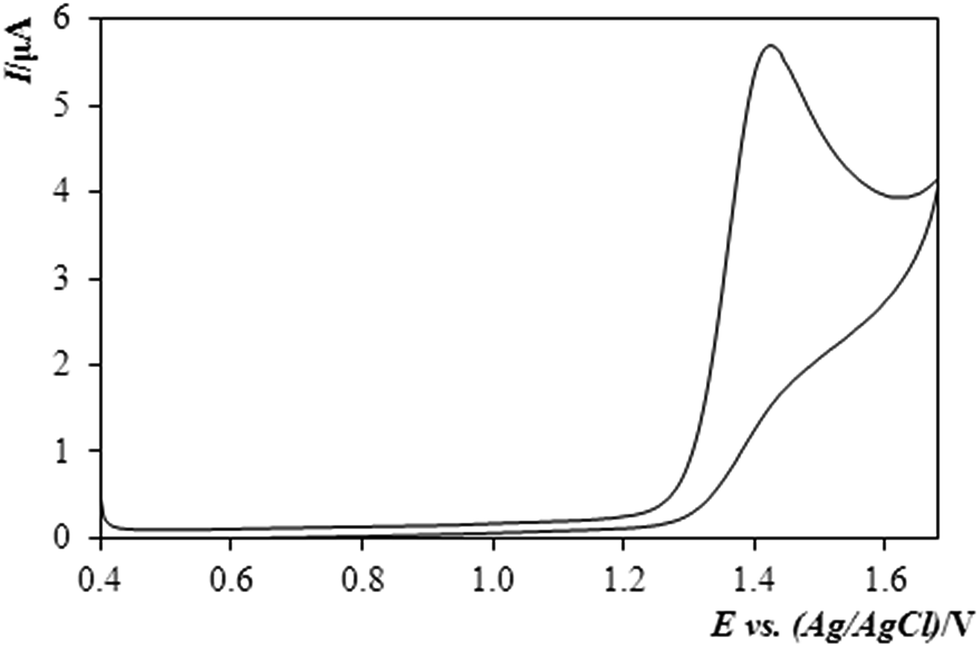 | ||
| Fig. 2 Cyclic voltammogram of methiocarb (MTC) in solution 0.1 mol L−1 H2SO4 + MeOH (10%, v/v) exp. conditions: CV, Ein +0.4 V, Efin +1.7 V vs. ref., scan rate: 40 mV s−1, c(MTC) = 9.8 mg mL−1. | ||
The accuracy and precision of the determination of methiocarb by DPV with a BDDE was examined by means of the recovery (rate) measurements, when the sought concentration was quantified via the standard addition method with two successive aliquots.
By analysing five identical samples spiked with 2.94 μg mL−1 MTC one after the other, the concentration of the pesticide was found to be within an interval of 2.74–3.12 μg mL−1, thus yielding a recovery of 93–106%, which could be regarded as a quite satisfactory result. One of such analyses is shown in Fig. 3, featuring typical DP-voltammograms.
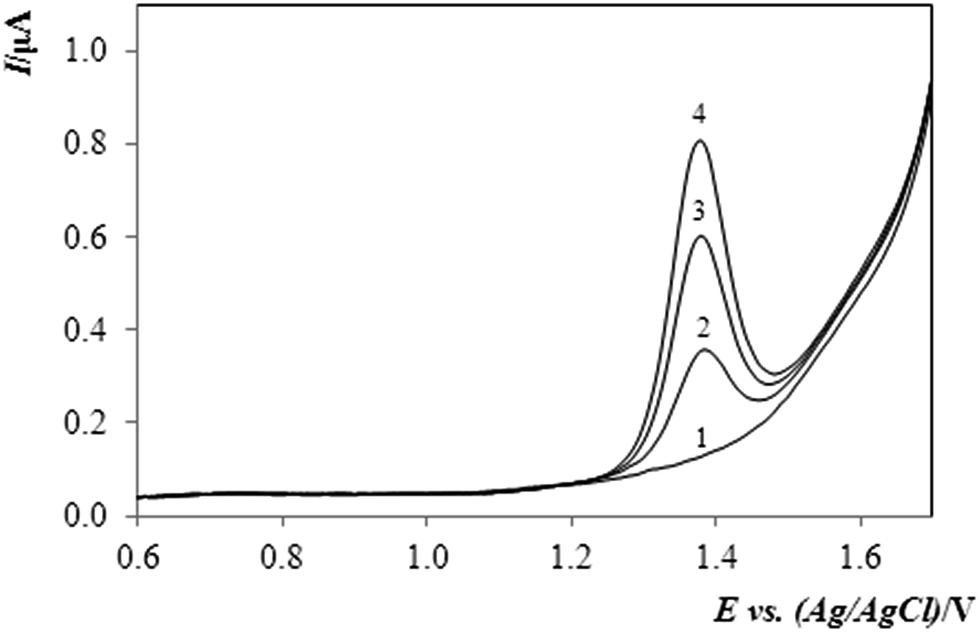 | ||
| Fig. 3 DP-voltammograms of MTC in the supporting electrolyte (0.1 mol L−1 H2SO4 in MeOH (10%, v/v)). Exp. conditions: DPV, Ein +0.4 V, Efin +1.85 V, scan rate: 40 mV s−1, curve (1) supporting electrolyte, (2) MTC in model sample (c = 2.94 μg mL−1), (3 and 4) additions of a 30 μL MTC standard solution (cMTC = 0.98 mg mL−1). | ||
Practical applicability of the method: determination of MTC and observation of its activity in dissolved form
The method elaborated and characterised with respect to calibration and electroanalytical performance in the DPV regime was tested on the determination of methiocarb (MTC) in two different experiments.• The first assay has been focused on the determination of MTC in Mesurol® (Mes; AgroBio Opava, CZ), which is a product applied as an effective slug killer in some agricultural localities and municipal gardens. In this case, mainly its controlled activity given by gradual dissolution of MTC in methanol was of interest. A chosen volume of the stock solution (made of 0.1045 g Mes in 25 mL MeOH) was pipetted into the above-optimised supporting electrolyte and the resultant mixture containing ca. 10% MeOH then served for quantification of MTC in a series of analyses. These were performed consecutively within 75 hours, thus allowing us to monitor the slowly increasing content of MTC up to a limiting value – the maximal release of the active pesticide.
It was found that the concentration of MTC has increased up to 25 hours and afterwards, it exhibited a nearly steady-state character with an almost constant content of the pesticide. This behavior was observed during next 50 hours. From the concentration found for the sample prepared taken from a period after 25 hours (i.e., after maximal release), the content of methiocarb in the commercial product could be determined to be ca. 3% (w/w) MTC. This was approximately 50% higher compared to the average percentage of 2% declared by the manufacturer or some dealers on the Internet; see e.g.ref. 42 Also, such a difference can be accepted, however, if one considers the low μg mL−1 concentration level of the substance to be analysed.
Fig. 4 shows typical sets of DP-voltammograms obtained by quantifying the methiocarb (MTC) in the sample of Mesurol. In the figure, the upper image “A” shows the original responses for blank (base-line, 1), sample (2), and two subsequent standard additions (3, 4), whereas the lower set “B” depicts the same sequence after the base-line subtraction.
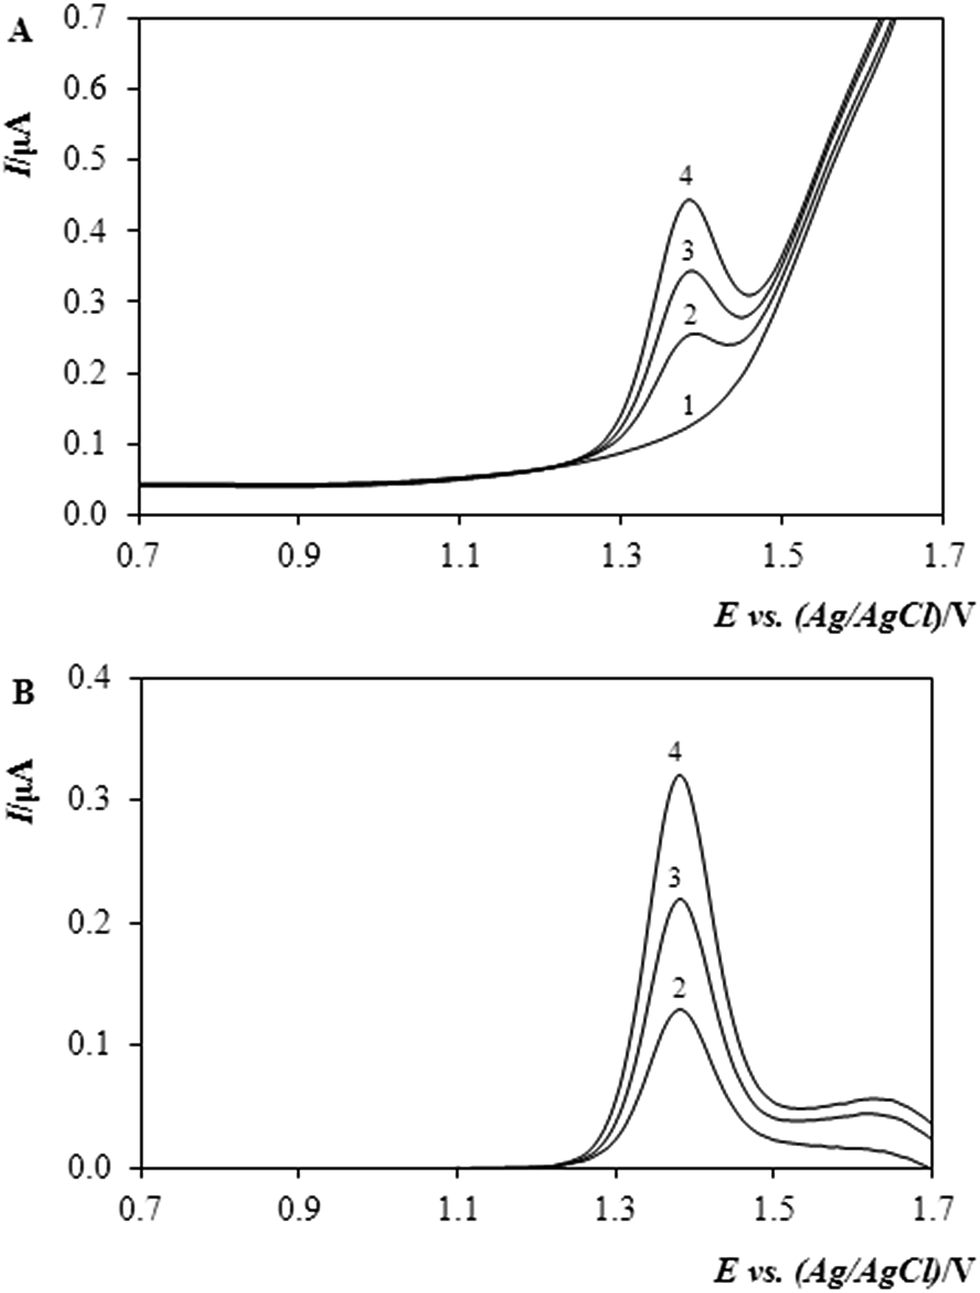 | ||
| Fig. 4 DP-voltammograms obtained by analysing the methanolic solution of methiocarb in Mesurol® commercial preparation before (A) and after (B) the subtraction of base-line (blank or the supporting electrolyte alone). Exp. con.: DPV, Ein +0.4 V, Efin +1.7 V, scan rate: 40 mV s−1, curve (1) 0.1 mol L−1 H2SO4 in MeOH (10%, v/v), (2) MTC in model sample of Mesurol (200 μL solution containing 0.1045 g MTC in 25 mL MeOH), (3 and 4) two additions of 20 μL MTC standard solution with cMTC = 0.98 mg mL−1. | ||
• The second experiment arranged to test the performance of a newly proposed method was inspired by the occasionally reported ability of methiocarb to suppress the undesirable growth of some zooplankton (during its gradual release from the preparation).40 Also, this assay has been made with Mesurol® product—which, in Czech Republic, is the only available source of MTC—added into natural water collected from a pond.
The suitable test was carried out with a model medium containing 5.127 g Mesurol in 1000 mL (pond) water, when the respective suspension-like solution was stored in a fridge before being taken for voltammetric determination and actually analysed in the mixture with the supporting electrolyte (0.1 mol L−1 H2SO4 in 10% MeOH).
A plot in Fig. 5 then illustrates how the pesticide has behaved in the model sample from pond water, which could be monitored via the gradual increase of the content of MTC in the time course: after 2 days of storage, the respective analysis resulted in a content of 5.1 mg L−1 MTC, after 10 days it increased to 9.9 mg L−1 and after yet another 10 days it attained 11.4 mg L−1 MTC. When considering the overall shape of this curve, the lastly quoted number represents again the highest concentration of MTC during the period of observation. It can be anticipated according to the shape of the plot – that this concentration will gradually increase probably up to the total dissolution of the active pesticide.
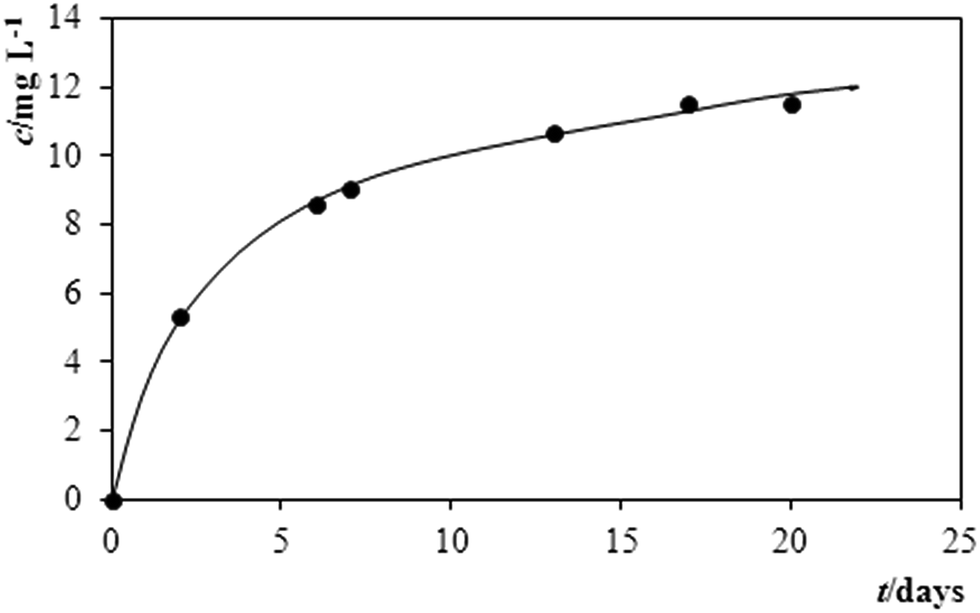 | ||
| Fig. 5 Monitoring the activity of MTC in Mesurol via the time dependence of its gradually increasing solubility in model solution made of pond water. | ||
Conclusions
In this article, a simple and rapid method for voltammetric determination of methiocarb pesticide of the carbamate type has been proposed, developed, and tested on selected samples. Undoubtedly, a major benefit to this achievement lies in the choice of the working electrode – the BDDE, enabling us to perform the oxidative transformation of the analyte of interest at extremely high potentials of about +1.4 V vs. Ag/AgCl, which is of value, where a majority of common electrodes suffer from high background or even fail.36,40,43During the examination of the method in practical analysis, methiocarb could be determined at the low μg mL−1 concentration level, which allowed us to follow the concentration variations during the controlled dissolution of the pesticide in aqueous media with a real matrix; with respect to the determination itself in the presence of ca. 10% (v/v) MeOH. Such a monitoring seems to be very useful in environmental analysis, when one can observe the actual behaviour of this pesticide – either its slow and gradual dissolution in aquatic systems (to prolong the effectivity of its interaction with the target pest), or—oppositely—to monitor its biological bio-degradability in the environment.
Because these approaches may require experimentation under field/outdoor conditions, simple and usually portable electrochemical devices are particularly convenient for this purpose; see e.g. discussion in ref. 29 or the already proposed procedures for monitoring some pesticides having demonstrated pretty well such a feasibility.44,45
Acknowledgements
Financial support was provided by The Ministry of Education, Youth and Sports of the Czech Republic (Project no. CZ.1.07/2.3.00/30.0021 “Strengthening of Research and Development Teams at the University of Pardubice”).References
- H. P. Li, J. H. Li, G. C. Li and J. F. Jen, Talanta, 2004, 63, 547–553 CrossRef CAS PubMed
.
-
W. J. Hayes and E. R. Laws, Handbook of pesticide toxicology (Classes of pesticides), Academic Press Inc., New York, 1991, vol. 3, pp. 1161–1163 Search PubMed
- S. Ozben, B. Catalgol, S. Gezginci-Oktayoglu, A. Karatug, S. Bolkent and B. Alpertunga, Toxicol. Ind. Health, 2012, 29, 60–71 Search PubMed
- I. Altinok, E. Capkin, S. Karahan and M. Boran, Environ. Toxicol. Pharmacol., 2006, 22, 20–26 CrossRef CAS PubMed
- I. Altinok and E. Capkin, Toxicol. Pathol., 2007, 35, 405–410 CrossRef CAS PubMed
- J. Han, M. Park, J. H. Kim, A. Kim, M. Won, D. R. Lee, J. J. Ko, H. Yoon, S. H. Sim, K. Lee and J. Bae, J. Appl. Toxicol., 2009, 29, 446–451 CrossRef CAS PubMed
- A. E. Essawy, N. E. Abdelmeguied, M. A. Radwan, S. S. Hamed and A. E. Hegazy, Cell Biol. Toxicol., 2009, 25, 275–290 CrossRef CAS PubMed
- G. Gras, C. Hasselman, C. Pellissier and R. Bruggers, Bull. Environ. Contam. Toxicol., 1981, 26, 393–400 CrossRef CAS
- V. Vlček and M. Pohanka, Chem. Listy, 2011, 105, 908–912 Search PubMed
- M. Pohanka, K. Musílek and K. Kuca, Curr. Med. Chem., 2009, 16, 1790–1798 CrossRef CAS
- R. Faina, J. Máchová, Z. Svobodová, H. Kroupová and O. Valentová, Použití přípravku Diazinon 60 EC v rybníkářské praxi k tlumení nadměrného rozvoje hrubého dafniového zooplanktonu, Jihočeská univerzita v Českých Budějovicích, Výzkumný ústav rybářský a hydrobiologický ve Vodňanech, 2007, pp. 18–19.
- K. C. Ting and K. Peng, J. Assoc. Offic. Anal. Chem., 1991, 74, 991–998 CAS
- T. M. Primus, D. J. Kohler, M. Avery, P. Bolich, M. O. Way and J. J. Johnston, J. Agric. Food Chem., 2001, 49, 5706–5709 CrossRef CAS PubMed
- V. A. Simon, K. S. Pearson and A. Taylor, J. Chromatogr., 1993, 643, 317–320 CrossRef CAS
- B. D. McGarvey, J. Chromatogr., 1993, 642, 89–105 CrossRef CAS
- C. Fernandez-Ramos, D. Satinsky and P. Solich, Talanta, 2014, 129, 579–585 CrossRef CAS PubMed
- J. F. Huertas-Perez and A. M. Garcia-Campana, Anal. Chim. Acta, 2008, 630, 194–204 CrossRef CAS PubMed
- F. Koc, Y. Yigit, Y. K. Das, Y. Gurel and C. Yaral, J. Food Drug Anal., 2008, 16, 39–45 CAS
- Z. H. Shi, J. D. Hu, Q. Li, S. L. Zhang, Y. H. Liang and H. Y. Zhang, J. Chromatogr. A, 2014, 1355, 219–227 CrossRef CAS PubMed
- R. Carabias-Martinez, U. Garcia-Hermida, E. Rodriguez-Gonzalo and L. Ruano-Miguel, J. Sep. Sci., 2005, 28, 2130–2138 CrossRef CAS PubMed
- M. J. Redondo, M. J. Ruiz, R. Boluda and G. Font, J. Chromatogr. A, 1994, 678, 375–379 CrossRef CAS
- Q. Xia, H. W. Yuan, C. D. Wu, J. Zheng, S. Y. Zhang, C. H. Shen, B. Yi and R. Q. Zhou, J. Food Sci., 2014, 79, 1854–1860 CrossRef PubMed
- W. M. Mo, H. L. He, X. M. Xu, B. F. Huang and Y. P. Ren, Food Control, 2014, 43, 251–257 CrossRef CAS PubMed
- B. Nagaraju and V. V. Rathnamma, Toxicol. Res., 2014, 3, 177–183 RSC
- T. L. Pham, T. H. Phan and T. D. Nguyen, Soil Sediment Contam., 2014, 23, 339–352 CrossRef CAS PubMed
- A. Placido, P. Paiga, D. H. Lopes, M. Correia and C. Delerue-Matos, J. Agric. Food Chem., 2013, 61, 325–331 CrossRef CAS PubMed
- F. A. S. Oliveira, F. D. Madureira, R. P. Lopes, M. G. Ferreira, B. Soto-Blanco and M. M. Melo, Quim. Nova, 2014, 37, 1699–1706 CAS
- J. Wang and D. Leung, J. AOAC Int., 2009, 92, 279–301 CAS
-
V. Guzsvány, Z. Papp, I. Švancara and K. Vytřas, Electroanalysis of insecticides at carbon Paste electrodes with particular emphasis on selected neonicotinoid derivatives; in: Insecticides – Advances in Integrated Pest Management, ed. F. Perveen, INTECH/Open Acces Publ., Rijeka (CRO), 2012, ch. 24, pp. 541–578 Search PubMed
-
E. Khaled and H. Y. Aboul-Eneim, Pesticides; in: Environmental Analysis by Electrochemical Sensors and Biosensors, Volume 2: Applications, ed. L. M. Moretto and K. Kalcher, Springer, New York, 2015, ch. 13, pp. 981–1020 Search PubMed
- G. E. Batley and B. K. Afgan, J. Electroanal. Chem., 1981, 125, 437–445 CrossRef CAS
- Y. Ni, P. Qiu and S. Kokot, Anal. Chim. Acta, 2005, 537, 321–330 CrossRef CAS PubMed
- R. Inam and C. Bilgin, J. Appl. Electrochem., 2013, 43, 425–432 CrossRef CAS
- T. N. Rao, B.-H. Loo, B. V. Sarada, C. Terashima and A. Fujishima, Anal. Chem., 2002, 74, 1578–1583 CrossRef CAS
-
A. Fujishima, Y. Einaga, T. N. Rao and D. A. Tryk, Diamond Electrochemistry, BKC Press, Tokyo (Japan), 2005 Search PubMed
- R. G. Compton, J. S. Foord and F. Marken, Electroanalysis, 2003, 15, 1349–1363 CrossRef CAS PubMed
- S. E. Jones Ward and R. G. Compton, Curr. Anal. Chem., 2008, 4, 170–176 CrossRef
- L. Bandžuchová, Ľ. Švorc, M. Vojs, M. Marton, P. Michniak and J. Chýlková, Int. J. Environ. Anal. Chem., 2014, 94, 943–953 CrossRef PubMed
- L. Janíková-Bandžuchová, R. Šelešovská, K. Schwarzová-Pecková and J. Chýlková, Electrochim. Acta, 2015, 154, 421–429 CrossRef PubMed
- J. Musilová, J. Barek and K. Pecková, Chem. Listy, 2009, 103, 469–478 Search PubMed
-
Anonymous: Tribology Statistical Software (Adstat). TriloByte, Pardubice, Czech Republic, 1995 Search PubMed
- http://www.e-zahradka.cz/store/goods-AB01034-112-mesurol-schneckenkorn250-g.html, accessed 23 March 2015.
-
R. N. Adams, Electrochemistry at Solid Electrodes, ed. M. Dekker, New York (USA), 1969 Search PubMed
- V. Guzsvány, M. Kádár, Z. Papp, L. Bjelica, F. Gaál and K. Tóth, Electroanalysis, 2008, 20, 291–300 CrossRef PubMed
-
V. Guzsvány, Z. Papp, L. Bjelica and F. Gaál, Voltammetric monitoring of photocatalytic degradation of Imidacloprid, Nitenpyram and Acetamiprid neonicotinoid insecticides, in Sensing in Electroanalysis, ed. K. Vytřas and K. Kalcher, Univ. Pardubice Press, Pardubice (CZ), 2008, pp. 105–116 Search PubMed
| This journal is © The Royal Society of Chemistry 2015 |