
 Open Access Article
 This Open Access Article is licensed under a
 Creative Commons Attribution 3.0 Unported Licence
Design and application of a versatile gas calibration for non-metal determination by carrier gas hot extraction†
Claus
Kramer
,
Peter
Ried
,
Stefan
Mahn
,
Silke
Richter
,
Nicole
Langhammer
and
Heinrich
Kipphardt
*
BAM Federal Institute for Materials Research and Testing, Richard-Willstätter-Str. 11, 12489 Berlin, Germany. E-mail: heinrich.kipphardt@bam.de; Tel: +49 30 8104 1116
First published on 19th May 2015
Abstract
In carrier gas hot extraction the calibration of low amounts of non-metals with masses of a few micrograms with small uncertainty remains a challenge. To achieve high flexibility a high precision gas mixture pump was combined with an automated syringe drive. The gas mixing pump allows filling the syringe with different gas compositions; the automated syringe drive allows matching to modulate the signal profiles to those of real samples. The system was designed and its experimental potential explored. The resulting calibration curves were comparable to those obtained by calibration using solid materials of sufficient purity and stoichiometry. However smaller uncertainties and lower limits of quantification (i.e. 0.5 μg and 0.6 μg for O and N, respectively) were found using the gas calibration device.
1 Introduction
Non-metal determination, namely the determination of oxygen, nitrogen, hydrogen, carbon, and sulfur, in solid materials is of wide technological relevance. The relevant concentrations range from stoichiometric contents (e.g. N in BN (ref. 1) or O in super conductors such as YBa2Cu3O7−x) on the one side to low concentrations (e.g. H in steel,2 S in turbine blades and O in high purity metals3) on the other side. Whereas with commercial instruments and related to the compact sample the limits of quantifications (LOQs) for metallic impurities are in the sub μg kg−1 range and even below, LOQs for non-metal determination are typically limited to the lower mg kg−1 range.For the determination of non-metals, two generally applicable measurement strategies, the use of direct instrumental methods and the use of multi-step methods, can be followed. With few specific exceptions instrumental methods play a minor role in non-metal determination as matrix matched calibration samples with respect to the analyte, content, binding form and matrix composition are rare. It is obvious that instrumental methods cannot be applied especially when aiming to certify reference materials for their non-metal content. For this purpose and also for universal applications multi-step methods consisting of decomposition, separation and determination of the analyte with an easy-to-calibrate detector are the strategy of choice.
Characteristics of CGHE
For non-metal determination this strategy is realized by the principle of carrier gas hot extraction (CGHE), sometimes also called ‘gas analysis’ as the analyte is determined in the gas phase. Variations of CGHE are summarized in Fig. 1. The variants of CGHE, i.e. nitrogen determination by inert gas fusion and thermal conductivity detection (TC) and sulfur determination by combustion and infra red (IR) detection, are indicated by arrows. Typical CGHE characteristics are summarized in Table 1. | ||
| Fig. 1 Varieties of CGHE. Through the rows paths for different combinations can be followed. Detector abbreviations are: TC, thermal conductivity; IR, infra red; OES, optical emission spectrometry; MS, mass spectrometry and ISE, ion selective electrode. | ||
| Sample mass | 50 μg to 1.5 g (100 g) |
| Limit of quantification wLOQ (based on 9 s) | Ca. 5 μg resp. 5 μg g−1 at a sample mass of 1 g |
| Precision | About 0.3% |
| Uncertainty u | About 0.5–3% |
Although the basic theoretical principles for the determination of H, N, O, C and S in metals by CGHE were established in the 1950s,4–6 it is observed that in practice method development is often based on empiricism. Even though CGHE is widely used in routine analysis – almost all laboratories related to metal or ceramic production are equipped with such commercial instruments – there are only few recent publications on CGHE in the literature [e.g.ref. 7–12] and, with few exceptions, for CGHE there is hardly any method oriented organized scientific community in comparison with, e.g., the field of atomic spectrometry.
Besides the control of blanks (e.g. oxygen contamination by oxidation of the sample surface) and contaminations, the main technical problem with CGHE is the quantitative release of the non-metal content of the sample and its complete transfer to the detector. For a given material it is almost impossible to predict on the degree of extraction completeness based on theoretical considerations as there is a lack of knowledge on specific processes related to the sample and its components taking place within and close to the furnace. The situation is complex, because the system is neither in thermodynamic equilibrium nor the kinetics are known for all processes. As a consequence, it is very difficult to prove complete recovery, when matrix matched samples with known compositions are not available.
It must be emphasized that the advantage of a multi-step process with respect to calibration can only be exploited if each individual step is well under control. Ignoring this can be a serious source of error (e.g.ref. 13). As a rule of thumb it is almost impossible by CGHE to find values that are too high, but it can be quite easy to find values that are too low.
Calibration of CGHE
For the calibration of CGHE the use of matrix matched calibration samples, preferably certified reference materials (CRMs), is preferred. Such materials are easy to use and their use is by nature the best strategy if matrix matching is fulfilled to good approximation. Matrix matching includes the analyte identity, analyte content, its binding form and distribution in a specific matrix. For a given sample as well as for a given calibration material usually not all parameters are specified. However, following this approach shifts the problem of correct non-metal determination to the CRM producer.Based on the benefit of a multi-step strategy, external calibration using sufficiently stable and stoichiometric compounds such as Fe2O3 for oxygen, KNO3 for nitrogen, BaCO3 for carbon, BaSO4 for sulfur and TiH2 for hydrogen in the form of pure materials is a way out, providing the potential for SI (International Systems of Units) traceability in the shortest possible way. However, in practice the problem comes with the purity of the material as typically the non-metal content with respect to the analyte is not well known. Although such materials are often known for their metallic purity, their total purity is hardly ever known. Moreover, if the calibration material and sample are not sufficiently matched, their decomposition behavior can be very different. Extreme examples are EDTA (ethylenediaminetetraacetic acid) and its salts, which seem to be advantageous calibration materials containing H, C, N and O at the same time, which however undergo incomplete decomposition due to the formation of pyrolysis products.
However, even in the rather simple case of comparing different metal oxides that could potentially be used as solid standards for oxygen calibration14 inconsistencies of several percent were observed. Such large inconsistencies just from calibration are disastrous, especially when aiming at the determination of the stoichiometry of an unknown sample. Similar discrepancies can be observed for the calibration of carbon using different carbonates, organic materials such as sugars, carbides or graphite. A technical disadvantage of pure compounds at the other end of the concentration scale (i.e. trace content determination) is that very small masses of calibration materials need to be handled. Although ultra-micro-balances can be successfully used for weighing such small masses, it can be difficult hitting a desired calibration point, when material masses of 300 μg or less are involved. Based on our own experience a reasonable mass limit to handle is 30 μg. For O in Fe2O3 this corresponds to an analyte mass (O) of 10 μg. It is possible to further reduce the analyte mass by applying a dilution of the calibration material by mixing it with an inert compound as applied in ref. 15 and 16. However, establishing homogeneous powder mixing is usually difficult to achieve and depends on densities, particle size and, finally, grain statistics.
As the analytes which are determined are gases, it is useful to apply gases for the detector calibration. Some of the commercial CGHE instruments in the market are equipped with built-in gas ‘loops’. The loops are flushed by pure analyte gas (e.g. O2, N2) or analyte containing gas (e.g. CO2) and then the loop can be switched to the analysis gas stream. By knowing the pressure, volume and temperature the amount of analyte in such a loop can be calculated via the (ideal) gas law. Aiming at e.g. 450 μg of analyte (O) this corresponds under ambient conditions to a volume as small as 344 μL for CO2. Typically the commercial producers of instruments with implemented gas calibration devices neither indicate how the loop volume has been determined nor give an uncertainty for the value. To measure such a small volume with sufficiently small uncertainty just from the geometric dimensions is almost impossible due to the small dimensions and dead volumes of the valves involved. The determination of the gas dosing volume is possible by gravimetry, i.e. filling the device with a liquid such as water or mercury or by using adsorption tubes after multiple dosing of a pure and reactive gas. However, to the authors there are also cases known, where producers of commercial instruments calculate the volume of the loops by comparing the peak size obtained from the loop against the peak size obtained from measuring (certified) matrix reference materials. As matrix reference materials (e.g. traces of N or O in steel) themselves are based on calibration, their use to establish the values for a gas calibration device does not seem to be appropriate. In order to obtain flexibility, multiple dosing with one loop and use of several to many loops with different volumes have been established. The application of loops with fixed volumes has two technical disadvantages. The minor disadvantage is the limitation of the calibration to specific calibration points corresponding to the fixed volumes. To overcome this limitation Schölz17 used a gas tight syringe for dosing very flexible volumes of a calibration gas. The more severe disadvantage of fixed volumes is that they result in a fixed peak shape when simply switched to the analysis stream. The resulting peak profile (e.g. high and narrow) might not match the peak profile (e.g. low and broad) obtained from a specific type of sample. This is even more significant for multiple dosing of the same volume when aiming for calibration of higher analyte amounts.
However, for calibration the peak form plays an important role as it reflects how actually the signal from the gas stream is running with changing composition through the detector function. It should be stated clearly that the measurand for gas calibration is actually not the integral of the peak itself as traditionally used, but rather the detector function itself, i.e. the detector output for a changing (given) gas composition. It is observed that the commercial instruments known to the authors do not foresee this type of calibration for the user at all. Matching the peak form of the sample with the peak form of the gas calibration can be well approximated also by using a syringe, which is not operated at a constant elution speed, but with a time programmed elution speed.
In gas calibration the volume is one issue, the composition of the filling gas is a second issue. Using a pure gas or a gas mixture to fill the gas calibration volume as foreseen with commercial instruments built in gas calibration devices is straightforward but still has a limitation concerning the flexibility of calibration points and matching the peak shape of the calibration and sample. Using different gas concentrations would be desirable, but difficult to establish with individual gas bottles. An elegant way to overcome this limitation is applying a gas mixing device to obtain a gas stream with a flexible and known composition from one bottle filled with the pure analyte (or one dilution) and one bottle of pure carrier gas. In gas analysis gas mixing pumps with at least two pistons of well-defined geometry and correlated in rotation speed by a shiftable but locked mechanical gear box are successfully used to obtain a gas stream with a flexible and known composition with very small uncertainty.
In this work, the experimental potential of the combination of a gas tight syringe in an automated drive and a gas mixing pump as a flexible and powerful gas calibration for CGHE is described. The external gas calibration was set up, tested with the measurement instrument and then compared against solid sample calibration.
2 Experimental
Fig. 2 shows the design of our external gas calibration device. The core parts are a gas mixing pump and a gas tight syringe in an automated syringe drive. The external gas calibration is connected to a commercial instrument. It should be noted that the measurement results reported here using the external gas calibration device therefore do not only depend on the calibration device but also on the whole chain of the calibration device and the detecting instrument. | ||
| Fig. 2 Simplified sketch of gas calibration in combination with a piston pump for mixing the carrier gas He with the analyte containing gas (i.e. CO2 or N2), a syringe (s) for gas dosage operated by an automated syringe drive, bubbling (a) and gas mixing (b) flasks, 3-port-valves (V1–V4) and the switch between the external (ext) and internal (int) gas mixing system. | ||
A piston pump DIGAMIX 6 (Wösthoff, Germany) was used. Two pistons (volume of (0.1370 ± 0.0007) and (13.70 ± 0.07) mL, respectively) were used to prepare a dilution of up to 1![[thin space (1/6-em)]](https://www.rsc.org/images/entities/char_2009.gif) :1000 from the pure analyte gas with the carrier gas. The mixture passes glass devices for homogenization and is then fed by a third piston to the syringe device. Piston four was not used. Depending on the mixing ratio the gas flow was typically 16.4 mL min−1. After an equilibration period of approximately 60 min, a stable calibration gas mixture was obtained. The expanded relative uncertainty for the composition of the gas mixture due to volume and temperature uncertainties is estimated to be Umix = 0.2%. Because the gas mixing pump is only allowed to operate at ambient pressure, a considerable part of the pure analyte gas, the pure carrier gas and the prepared gas mixture leaves through the exhaust consisting of glass devices filled with paraffin oil as a sealing liquid.
:1000 from the pure analyte gas with the carrier gas. The mixture passes glass devices for homogenization and is then fed by a third piston to the syringe device. Piston four was not used. Depending on the mixing ratio the gas flow was typically 16.4 mL min−1. After an equilibration period of approximately 60 min, a stable calibration gas mixture was obtained. The expanded relative uncertainty for the composition of the gas mixture due to volume and temperature uncertainties is estimated to be Umix = 0.2%. Because the gas mixing pump is only allowed to operate at ambient pressure, a considerable part of the pure analyte gas, the pure carrier gas and the prepared gas mixture leaves through the exhaust consisting of glass devices filled with paraffin oil as a sealing liquid.
For loading and dosing the gas mixtures an automated syringe drive PSD/2 (Hamilton Bonaduz AG, Switzerland) was used. The piston distance that can be pushed is 60 mm, at the fastest speed this takes, 1 s. To improve the flexibility of programming and operation of the syringe drive, specific controlling software operated from a PC was developed. The port valve number 3 (V3 in Fig. 2) built in the PSD/2 is used to either fill the syringe from the gas mixing pump or to inject the filled volume into the carrier gas stream of the instrument to be calibrated. By injecting the analyte gas at once in the fastest mode (1 s for a full syringe stroke) the conventional narrow peak form is realized. The corresponding peak width detected of typically 50 s is due to the residence time of the gas in the volume of the extraction oven of the CGHE instrument. Running more complex injection sequences allows creating individual signal shapes. Peak tailing can be simulated by slower injection or a combination of initially fast injection and slow injection of the rest. Attention should be paid to the point that during the injection process the injection valve V3 is open to the measuring system path and the system carrier gas stream itself also slowly flushes the analyte gas out of the syringe.
In preliminary studies different syringe volumes were tested concerning suitability and observed uncertainty, finally a 2500 μL gas tight syringe (Hamilton) was selected. The piston of the PSD/2 moved 60 mm to fill these 2500 μL. The volume of the syringe was calibrated by gravimetry using deionized water. The syringe was filled ten times each with ten different volumes between 250 and 2500 μL of water, which was dosed to a balance equipped with a moisture trap similar to that used for pipette calibration. Only a very small systematic error of +3 μL was found, using the obtained values of 3 users (i.e. n = 300). The spread observed for the syringe at a volume of 2500 μL was found to be ±11 μL. This spread could be reduced to <1 μL by using the automated syringe drive.
In our case all measurements were conducted using a commercial LECO TCH-600 hot extraction analyzer (Leco Corporation, Michigan); however, it is believed that also other analyzer types could be used. To connect the external gas calibration device to the instrument, two three-port valves were mounted just before and just after the gas calibration loops of the instrument itself. This set-up allows us to either run the instruments built in gas calibration or the external gas calibration device.
The connections from the piston pump to the bubbling flasks a and b (glass) and to valve V4 are realized with plastic tubes with a diameter of 5 mm. V4 and V3 are connected via another bubbling flask (glass) also using plastic tubes with a diameter of 7 mm. The valve V3 is connected to the external path V1/V2 with a metal tube with a diameter of 0.7 mm. V1, V2 and V4 are magnetic valves of type 6014 T (from Burkert, Germany) and V3 is a macro-active valve (3–2, 0.07′′) from Hamilton.
The LECO TCH-600 is equipped with infrared detectors and a thermal conductivity detector as can be seen in Fig. 3. The operating principle is described in detail elsewhere.18 The carrier gas helium is first purified from moisture and carbon dioxide using heated copper, magnesium perchlorate and sodium hydroxide. Within the electrode furnace (B) solid samples in general melt in a graphite crucible at a temperature depending on the crucible type and the electrical power. Samples, containing oxygen, nitrogen and hydrogen, are reduced by dissolved carbon from the crucible. Oxygen reacts with CO and/or CO2 that is detected using two selective IR-detectors (C1). Subsequently H2 is oxidized to H2O and CO is oxidized to CO2 using CuO and detected by two more IR-detectors selective for H2O and CO2 (C2). Finally after removing CO2 and H2O using NaOH and MgClO4, N2 is detected by a thermal conductivity detector (C3). As the CGHE instruments operate at a slight overpressure (typically 0.15 MPa), the instrument cannot directly be connected to the gas mixing pump, which is supposed to run at ambient pressure. The analytical parameters of the carrier gas hot extraction, involving the two types of graphite crucibles and the two types of capsule materials Sn and Ni, are shown in Table 3. Especially for materials with a high decomposition temperature (e.g. BN) crucible design and the capsule material acting as a flux have a strong influence on the decomposition behavior. Capsules of Ni with a mass of 260 mg and capsules of Sn with a mass of 165 mg from Lüdi (Switzerland) were used.
 | ||
| Fig. 3 Schematic overview of the operation principle of carrier gas hot extraction as applied in the instrument used. | ||
To feed the external gas calibration He, N2, and CO2 from Linde (Germany) with nominal purity by volume of 99.9990%, 99.9990% and 99.995%, respectively, were used. The cross contaminations between the three gases are assumed to be negligible for our application. Additionally two gas mixtures with molar fractions of (1.75 ± 0.02)% N2 and (2.09 ± 0.01)% CO2 in He prepared and certified by BAM's gas analysis laboratory were used to check the accuracy of the dilution by the gas mixing pump.
The time demand for the calibration using the gas calibration device consists of about 1 hour for conditioning, and approximately 2 min for each data point. The approximated time demand for a gas calibration with 5 equidistant data points and 2 repetitions was therefore 90 min. As the gas is dosed volumetrically, ambient pressure and temperature need to be known. Temperature was measured using a thermometer DTM3000 with a temperature sensor PT100 from Wösthoff, pressure was measured using a manometer GMH 3180 from Greisinger electronics (Germany). Temperature and pressure variations during a gas dosing campaign were ±1.5 K and ±5 hPa, respectively.
For comparison of the gas calibration with the classical calibration using solid materials with known analyte contents, existing matrix certified reference materials (CRMs) and sufficiently pure and stoichiometric substances were used as compiled in Table 2. For the weighing of the solid calibration materials an ultra-micro-balance UMT2 from Mettler Toledo with a readability of 0.1 μg was used. To establish the calibration curves typically eight calibration points and two blanks were used.
| Compound | Origin | Nominal purity | w analyte | u (wanalyte) |
|---|---|---|---|---|
| KNO3 | Merck | 99.00% | 13.7% | ±0.5% |
| Si3N4 | CRM BAM-ED101 (ref. 20) | 97.86% | 38.1% | ±0.2% |
| BN | CRM BAM-ED103 (ref. 21) | 99.24% | 55.6% | ±0.6% |
| MnCO3 | Riedel-de Haen | 99.90% | 41.7% | ±0.1% |
| CaCO3 | Merck | 99.00% | 47.5% | ±1.0% |
| ZrO2 | Alfa Aesar | 99.98% | 25.96% | ±0.02% |
| MgO | CRM BAM, VDEh (ref. 22) | 99.78% | 39.6% | ±0.22% |
| Fe2O3 | Riedel-de Haen | 99.50% | 29.9% | ±0.25% |
The calibration curves using the external gas calibration as well as using the solid sample calibration were evaluated according to ISO 5725 (ref. 19) resulting in an estimate for the limit of quantification and estimates for the uncertainty of the calibration. Expanded relative uncertainties for the analyte masses m observed were predicted according to eqn (1) and (2) for the gas calibration and the solid sample calibration, respectively.
 | (1) |
 | (2) |
3 Results and discussion
Using the external gas calibration it was found that the results were not different if a cold or hot furnace of the CGHE instrument was used. Therefore for gas calibration a cold crucible was used. Fig. 4A and B show the results obtained by applying the external gas calibration using mixtures of the analytes oxygen in the form of carbon dioxide and nitrogen with the carrier gas helium, applying injection volumes between 250 and 2500 μL out of a 2500 μL syringe. In order to exemplify the signal shape obtained for different peaks, three peaks each are highlighted, resulting from the dosage of analyte gases corresponding to analyte masses (N and O) between 5 μg and 65 μg. The observed tailing of the peaks is caused by the residence time of the analyte gases in the volume of the furnace of the CGHE instrument. For the baseline correction a straight line (indicated as a dotted line) from the peak onset to the peak offset was used. The integrated areas can be fitted by a linear calibration curve (see the right side of Fig. 4) with a slope of 355 μV s μg−1 and an intercept of 135 μV s for nitrogen and a slope of 1266 μV s μg−1 and an intercept of 350 μV s for the oxygen calibration. The low intercepts are in line with the volume calibration of the syringe, where a small positive systematic error was observed. A correlation coefficient R2 of 0.99799 was found for the N2 calibration, and a value of 0.99878 for the CO2 calibration, indicating a good applicability of the gas calibration for nitrogen and oxygen analyte masses below 50 μg. | ||
| Fig. 4 (A) Detector signals for calibration using nitrogen gas and linear fit; (B) detector signals for calibration using carbon dioxide gas for oxygen calibration and linear fit. | ||
For the purpose of validation, the results of the gas calibration were compared to those of the classical calibration using solid samples with a defined oxygen and nitrogen content. Preferably CRMs containing the analytes in different concentrations and binding forms were used for solid state calibration. The signals obtained as a function of the nominal O- and N-masses are displayed in Fig. 5 for various stoichiometric oxides and carbonates (indicated as filled symbols, 5 calibration points) as well as the signals obtained by gas calibration (indicated as open symbols, 10 calibration points). The lines displayed in Fig. 5 represent the calibration curve obtained by external gas calibration. The data for the solid samples comprise measurements repeated on one day at least in duplicate and the whole calibration experiment repeated on different dates giving an indication of the robustness of the applied method. From Fig. 5A it seems that the signal areas obtained by gas calibration for nitrogen are slightly higher than the signals obtained by solid sample calibration. From Fig. 5B it seems that the signal areas obtained by gas calibration for oxygen are slightly lower compared to solid sample calibration. However, in both cases solid sample and gas calibration are in agreement within the confidence interval. The advantage in time of 0.5 h for 10 calibration points with gas calibration compared to 1.25 h (dominated by the weighing time at the ultra-micro-balance) for 5 calibration points with solid sample calibration is notable.
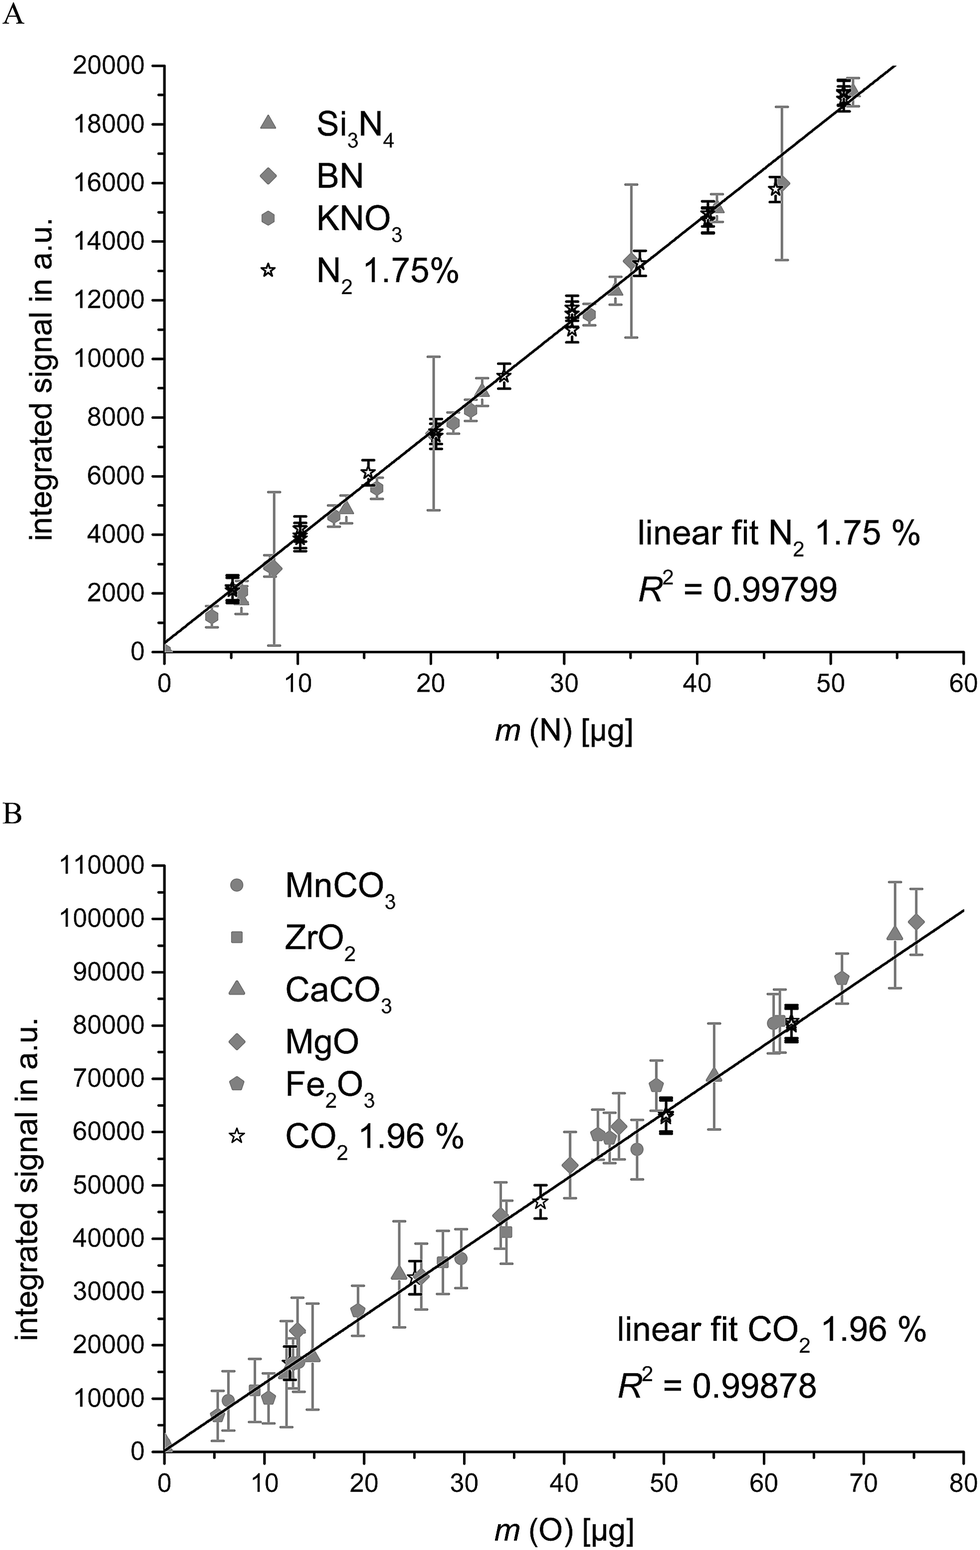 | ||
| Fig. 5 Signal areas obtained from decomposition/reduction curves of solid sample calibration (blank corrected) and gas calibration using a (A) N2/He mixture and (B) CO2/He mixture. The error bars indicate the combined uncertainties (k = 2), if larger than the symbol size. | ||
The calculated limits of quantification and expanded uncertainties for nominal analyte masses of 5 μg and 100 μg are summarized in Table 3. Gas calibration especially using a rather diluted gas to fill the syringe shows always the smallest uncertainties and lowest limits of determination. In our case the highest dilution was prepared by the gas mixing pump, however, it is believed that also a ready to use gas mixture from one gas bottle would work in the same way. At a nominal analyte mass of 100 μg, the values for gas calibration and solid sample calibration are compatible for nitrogen when solid samples which easily decompose are used. Otherwise the uncertainties for the solid sample decomposition are up to a factor of seven higher than for the gas calibration, which is due to the uncertainty of the fit of the calibration mainly caused due to the difficulties in weighing small portions of the calibration material and the observed spread from the decomposition by CGHE. For some of the compounds (i.e. BN, ZrO2 and CaCO3) which are difficult to decompose and therefore not the first choice as a calibration material, further optimization of the CGHE conditions might slightly improve the data.
| Material | Analyte | Limit of quantification mLOQ [μg] | U obs (m) (at 5 μg) [μg] | U obs (m) (at 100 μg) [μg] | w Ref [%] | Experimental conditions |
|---|---|---|---|---|---|---|
| KNO3 | N | 1.7 | 0.5 | 1.1 | 13.85 | 5700 W, ST, Sn |
| Si3N4 | N | 2.7 | 1.1 | 1.8 | 39.92 | 5700 W, ST, Sn |
| BN | N | 17 | 7 | 7 | 56.38 | 5700 W, HT, Ni |
| MnCO3 | O | 10 | 4 | 4 | 41.75 | 5000 W, ST, Sn |
| ZrO2 | O | 13 | 6 | 6 | 25.97 | 5000 W, HT, Ni |
| CaCO3 | O | 17 | 7 | 7 | 47.95 | 5000 W, ST, Sn |
| MgO | O | 10 | 4 | 4 | 39.68 | 5000 W, ST, Sn |
| Fe2O3 | O | 10 | 4 | 4 | 30.05 | 5000 W, ST, Sn |
| N2:He | N | 0.7 | 0.24 | 1.1 | 0.1996 | Cold oven |
| Mixed in the pump | N | 3.3 | 0.7 | 1.3 | 4.762 | Cold oven |
| CO2:He | O | 0.5 | 0.15 | 1.1 | 0.1996 | Cold oven |
| Mixed in the pump | O | 2.7 | 0.6 | 1.2 | 4.762 | Cold oven |
| N2:He from the cylinder | N | 2.6 | 0.6 | 1.2 | 1.75 | Cold oven |
| CO2:He from the cylinder | O | 2.4 | 0.5 | 1.2 | 2.09 | Cold oven |
At a nominal analyte mass of 5 μg often the uncertainties increase for the solid calibration to an inacceptable level of more than 100% as the nominal value of 5 μg falls below the limit of determination. The uncertainty is dominated by the weighing of the small masses and the measurement statistics of the inherent decomposition step by CGHE. Furthermore in many cases, no appropriate solid standards with low and very low analyte contents are available. This is even more the case when aiming for the development of such materials. The uncertainties of the gas mixtures at an analyte mass of 5 μg are in an acceptable range. The limitations here are the mixing ratio of the piston pump and the limits of the detectors.
The flexibility of the external gas calibration device for matching the more complex peak profile as sometimes obtained from real samples is shown in Fig. 6 for the decomposition of MnCO3 by applying a temperature profile. In a first step CO2 is released (first peak between 20 and 55 s) at rather low temperatures by running the oven with less power according to eqn (3). When after some time the oven temperature is increased to a maximum at a rapid speed, the rest of the oxygen is extracted (second peak between 85 and 130 s) according to eqn (4).
 | (3) |
 | (4) |
 | ||
| Fig. 6 Signal shape resulting from (A) extraction of oxygen out of MnCO3 using a temperature program. (B) Signal observed from an adjusted injection program using the external gas dosage. | ||
The resulting double peak was matched with the external gas calibration device by injecting only a part of the syringe volume, closing the injection valve, reopening the valve and injecting the rest after a defined time. The resulting signal profiles from the gas dosage were very similar to the extraction profile from the solid substance. Results for applying this concept of profile matching for analysis of MnCO3 over an oxygen mass range of 8 μg to 80 μg are shown in Fig. 7. The integrated signal areas obtained from the multistep decomposition of the MnCO3 are well in agreement with the values obtained by the profile matched gas dosage.
 | ||
| Fig. 7 Signal areas obtained from the extraction of oxygen out of MnCO3 using a temperature program in comparison to signal areas obtained from an adjusted injection program using the external gas dosage with CO2. | ||
4 Conclusions and outlook
The presented gas calibration device extends the range of options for calibration for CGHE and most likely also for similar applications. Due to the usage of a gas mixing pump, the system is very flexible with respect to the gas compositions. The automated syringe drive makes the system very flexible with regard to the signal shape. Especially aiming at low concentrations (i.e. small analyte masses), gas calibration has some advantages compared to the calibration with pure and stoichiometric solid samples. It is less time consuming, has smaller uncertainties and lower limits of quantification. This type of gas calibration would also be easily applicable for higher concentrations, which was not the aim of this work. Until now the developed gas calibration device was used for external calibration only and one should keep in mind that external calibration can by principle not account for matrix effects. To investigate matrix effects is often very difficult and would require matrix matched samples with known compositions – which often do not exist. Using the gas calibration device for standard addition experiments might be helpful to study some of the matrix effects, namely the interaction of the analyte containing gas with the hot melt of a real sample and its vapor.Acknowledgements
The authors would like to acknowledge Jens Pfeifer, Christian Camps and Gert Schulz from BAM for technical advice and Wolfgang Gruner (IFW, Dresden), Erhard Grallath (MPI, Stuttgart) and the colleagues from GDMB “Arbeitsauschuss Sonderwerkstoffe” for assisting with their extensive experience. Financial support by EMRP (the European Metrology Research Programme) is gratefully acknowledged (EMRP SIB09, “Primary Standards for Challenging Elements”). The EMRP is jointly funded by the EMRP participating countries within EURAMET and the European Union.References
- W. Gruner, J. Haßler, P. Barth, J. Behm and J. Sunderkötter, J. Eur. Ceram. Soc., 2009, 29(10), 2029–2035 CrossRef CAS PubMed.
- G. Amati, S. Maneschi and N. Vantini, Chim. Ind., 1970, 52(6), 541–544 CAS.
- H. Kipphardt, T. Dudzus, K. A. Meier, S. Recknagel, M. Hedrich and R. Matschat, Mater. Trans., 2002, 43(2), 98–100 CrossRef CAS.
- E. Fromm and E. Gebhardt, Reine und angewandte Metallkunde in Einzeldarstellungen Band 26, Gase und Kohlenstoff in Metallen, Springer Verlag, Berlin, 1976 Search PubMed.
- Determination of Gaseous Elements in Metals, ed. L. M. Melnick, L. L. Lewis and B. D. Holt, John Wiley and sons, New York, 1974 Search PubMed.
- Z. M. Turovtseva and L. L. Kunin, Analysis of Gases in Metals, Consultants Bureau, New York, 1959 Search PubMed.
- P. V. Krasovskii, Inorg. Mater., 2014, 50(15), 1480–1486 CrossRef CAS.
- G. J. Z. Gao, Y. P. Li, S. Y. Feng, X. J. Xie, C. J. Kuang and C. Cao, Chin. J. Anal. Chem., 2014, 42(5), 779–780 CAS.
- R. Farzana, R. Rajarao and V. Sahajwalla, Mater. Lett., 2014, 116, 101–103 CrossRef CAS PubMed.
- H. Dalaker and M. Tangstad, High Temp. Mater. Processes, 2014, 33(4), 363–368 CAS.
- E. Taban, E. Kaluc and T. S. Aykan, Weld. J., 2014, 93(4), 124S–130S Search PubMed.
- E. Taban, E. Kaluc and T. S. Aykan, Mater. Test., 2014, 56(11–12), 950–957 CrossRef CAS.
- H. P. Beck and H. Muller, Fresenius' J. Anal. Chem., 1997, 357(6), 652–655 CrossRef CAS.
- W. Gruner, Fresenius' J. Anal. Chem., 1999, 365(7), 597–603 CrossRef CAS.
- A. Griesche, E. Solorzano, K. Beyer and T. Kannengiesser, Int. J. Hydrogen Energy, 2013, 38(34), 14725–14729 CrossRef CAS PubMed.
- P. Ried, M. Gaber, R. Müller, K. Beyer, H. Kipphardt and T. Kannengiesser, Steel Res. Int., 2011, 82(1), 14–19 CrossRef CAS PubMed.
- F. Schölz, presentation at Diskussionstreffen zu aktuellen Problemen und Entwicklungen der Nichtmetall-/Gasanalytik, Rathen, Germany, 2003 Search PubMed.
- D. A. Lawrenz and J. Mitchell, Thermal Evolution Methods for Carbon, Sulfur, Oxygen, Nitrogen and Hydrogen in Iron and Steel Analysis, in Encyclopedia of Analytical Chemistry, John Wiley & Sons Ltd., 2006 Search PubMed.
- ISO 5725-Accuracy of Measurement Methods and Results, ISO, Geneva, 1994.
- Certificate CRM BAM-ED101, BAM, Berlin, 2009.
- Certificate CRM BAM-ED103, BAM, Berlin, 2012.
- Certificate CRM EURONORM RS 6B, BAM, Berlin, 1997.
Footnote |
| † Dedicated to Friedhold Schölz, a fine colleague in “GDMB, TC Special Materials”, who passed away much too early. |
| This journal is © The Royal Society of Chemistry 2015 |