
 Open Access Article
 This Open Access Article is licensed under a Creative Commons Attribution-Non Commercial 3.0 Unported Licence
Electron capture dissociation of extremely supercharged protein ions formed by electrospray ionisation†
Muhammad A.
Zenaidee
and
William A.
Donald
*
School of Chemistry, The University of New South Wales, Dalton Building 221, Sydney, New South Wales 2052, Australia. E-mail: w.donald@unsw.edu.au; Fax: +61 2 9385 6141; Tel: +61 2 9385 8827
First published on 12th May 2015
Abstract
The fragmentation of six protein ions formed by electrospray ionisation (8.6 to 66.5 kDa) using electron capture dissociation (ECD) in a 7 T Fourier transform ion cyclotron resonance mass spectrometer was investigated as a function of charge state. Addition of 1,2-butylene carbonate to electrospray solutions was used to form protein ions with extremely high charge densities. For all six proteins, cleavage sites at 85 to 99% of all inter-residue sites were identified and fragmentation efficiencies of between 75 and 95% were obtained from tandem mass spectra of the highest charge states that could be readily isolated under these conditions. For ECD of both relatively low and high charge states, many rarely reported complementary a/x and b/y sequence ions were identified, whereas complementary a/y ions were comparatively sparse. These data suggest that a ions that are more often associated with the formation of complementary y ions (via CO loss from b ions) can also be formed via direct cleavage of Cα–Cβ peptide backbone bonds to yield complementary a and x ions. Overall, these data indicate that it should be possible to obtain highly efficient ion fragmentation and near complete sequence characterisation for proteins with masses greater than 66.5 kDa.
Introduction
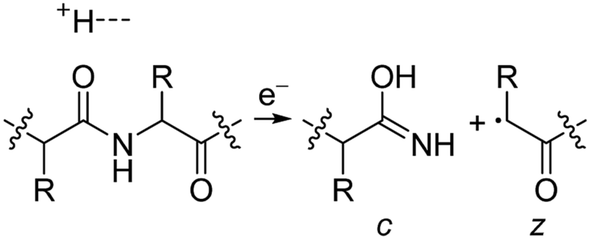
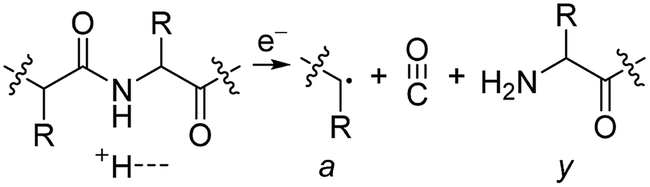
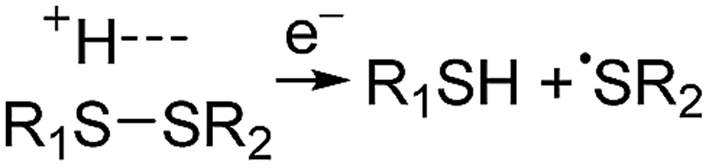
Electrospray ionisation (ESI)1 is renowned for its ability to transfer intact peptides and proteins from solution to the gas-phase as ions, which can be rapidly detected with high sensitivity and accuracy by mass spectrometry (MS). To identify and characterise proteins in a complex mixture, conventional proteome analysis involves sequencing the peptides of an enzymatically digested protein mixture using ESI tandem MS.2 However, complete protein sequence characterisation is rare, which limits the characterisation of distinct protein forms, including post translational modification patterns and sequence variants. The molecular ion and fragment ion data that is obtained by activating an intact protein ion inside a mass spectrometer (the “top-down” tandem mass spectrometry approach) is significantly more discerning than that obtained for peptides formed by protein digestion.3 The top-down approach has the potential to overcome many limitations of more traditional proteome analysis by enabling protein sequences and post-translational modification patterns to be more accurately and completely characterised.Upon ion activation, gas-phase multiply charged protein ions can dissociate by many different pathways, yielding a fragmentation spectrum from which detailed sequence information and the number and locations of post-translational modifications can be obtained. For ion activation, extensive fragmentation of intact proteins can be obtained by use of electron capture dissociation (ECD),4 electron transfer dissociation (ETD),5 and ultraviolet photodissociation (UVPD),6 which frequently produces richer fragmentation spectra than those obtained by activating ions in collisions with neutral gaseous molecules, surfaces, or by absorption of IR photons. However, complete and rapid characterisation of intact protein ions is generally limited to proteins with masses less than 10 kDa. This is primarily because protein ions are usually formed in relatively low charge states, which do not readily fragment. Moreover, larger proteins often contain disulphide linkages, which require the cleavage of multiple covalent bonds to form sequence ions. In ECD and ETD,4 protein ions are reduced by one or more electrons,7 which usually results in the formation of many abundant c and z type ions (eqn (1)), although a and y ions (eqn (2))4a,b and b ions can also be formed.8 For disulphide bonds, ECD and ETD can result in selective cleavage of R1S–SR2 bonds, which generally results in lower sequence coverage for unreduced proteins than those that are fully reduced (eqn (3)).7a
 | (1) |
 | (2) |
 | (3) |
Although the efficiency,4,9 extent of energy deposition,4,10 and the number of fragment ions4,9 in ECD typically increase as protein charge states increase, systematic investigations into the effects of charge state on the performance of ECD-MS are limited. For protein ions in relatively low charge states, ECD fragmentation efficiencies and the resulting sequence coverage can be enhanced by combining ECD with collisional or infrared photon laser activation to ensure that any non-covalent interactions that can prevent the detection of ECD cleavages are disrupted (activated ion ECD; AI-ECD).9,11 For Fourier transform mass spectrometers (FTMSs), which have sufficient resolution to assign charge states to large protein fragment ions for obtaining sequence information, the detected signals for both precursor and product ions increase proportionally as charge states increase.12 Although higher charge states tend to fragment more readily to yield more highly charged products than those with fewer charges, the extent that a protein can be charged is finite.
Recently, we discovered that by addition of 1,2-butylene carbonate (BC) to ESI solutions, intact protein ions can be formed in significantly higher charge states13 than by using other known methods and ‘supercharging’ additives.14 For example, by addition of 5% (v/v) BC to aqueous solutions containing 0.5% acetic acid, the most abundant charge states of protonated carbonic anhydrase II increased from 36+ to 44+.13a Relatively small protein ions that have been supercharged can have very high electron capture cross sections and fragment readily. For example, ECD of the 17+ charge state of protonated ubiquitin (8.6 kDa) formed by use of BC and ESI resulted in the identification of 223 cleavages and 74 of 75 inter-residue sites, which corresponds to the highest of these two values that have been reported for a single charge state of ubiquitin using ECD.13a Here, we investigate the effects of charge states for 6 proteins (8.6 to 66.5 kDa) on the performance of ECD-MS for completely characterising protein ion sequences. Proteins in very high charge states were formed using BC. Near complete protein sequence coverage (≥85%) was obtained for proteins as large as 66.5 kDa with highly efficient ECD (fragmentation efficiencies ≥ 75%) using ESI, BC, ECD and FTMS. These data indicate that near complete protein sequence characterisation can be obtained for proteins significantly larger than 10 kDa by ECD of individual charge states.
Results and discussion
Effects of increasing ion charge on ECD
Representative ESI mass spectra of aqueous solutions containing 5 μM cytochrome c (cyt c), 0.5% acetic acid, and either no additional additive or 5% butylene carbonate are shown in Fig. 1. Electron capture of [cyt c, 24H]24+, which is the highest charge state of cyt c that was readily isolated, resulted in cleavage of 99 of 104 inter-residue sites, corresponding to near complete sequence coverage of cyt c (95%). Cleavage sites were not identified between Cys-14 and Cys-17 presumably because these residues are crosslinked to an Fe-haem group. The Cys-14 to Cys-17 macrocycle should require the cleavage of at least two bonds for inter-residue cleavages between the 14th and 17th residues to be detected,9,15 and metal cations can be preferentially reduced compared to protonation sites upon electron capture.16 ECD of [cyt c, 18H]18+, which was the highest charge state that could be readily isolated without addition of BC under these conditions, resulted in cleavages at 59 of 104 possible inter-residue sites (57% sequence coverage). The protonated cyt c charge state distributions formed from these acidified aqueous solutions were similar to those obtained using denaturing solutions containing 49/49/2 water/methanol/acetic acid.13a The relative increase in supercharging effectiveness by use of BC compared to not using BC did not depend significantly on protein concentration (5 μM to 100 μM) under these conditions (Table S1†). The electron capture efficiency and fragmentation efficiency increased from 72% and 58% for [cyt c, 18H]18+ to 89% and 75% for [cyt c, 24H]24+ (Fig. 2). These results correspond to the highest ECD efficiency (89%) and sequence coverage (95%) values for a single charge state of this common test protein that has been reported (to our knowledge). By combining ECD data for protonated cyt c of 11 charge states (8+ to 18+) McLafferty and co-workers reported that 95 cleavages at unique inter-residue sites were identified (91% sequence coverage).15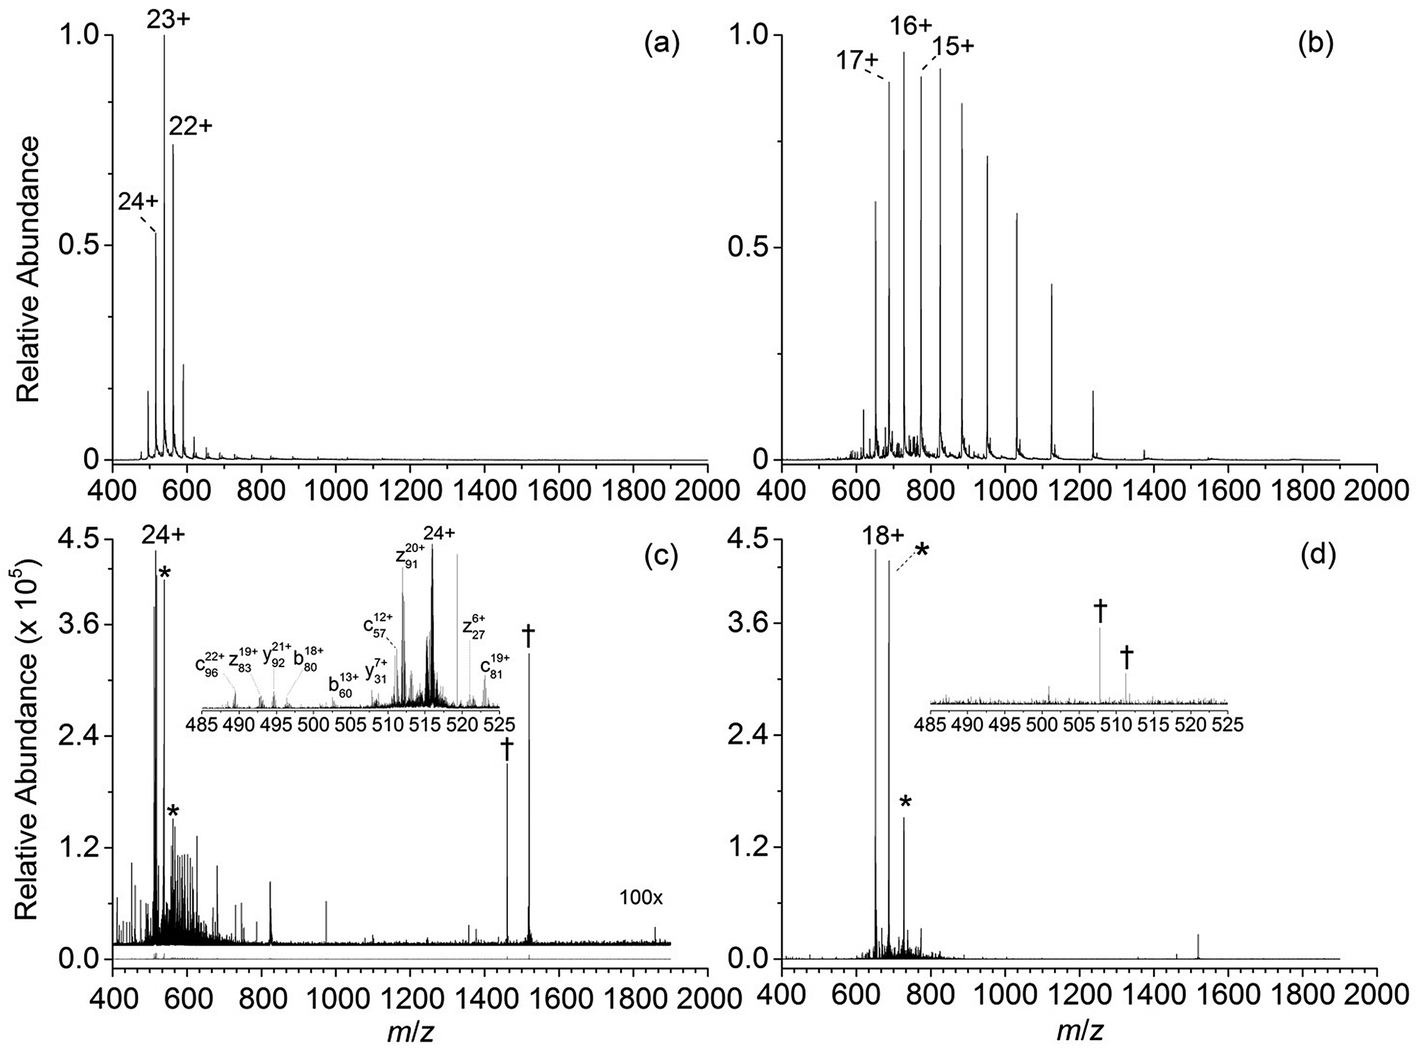 | ||
| Fig. 1 ESI mass spectra of aqueous solutions containing 5 μM cytochrome c, 0.5% acetic acid, and (a) 5% 1,2-butylene carbonate, and (b) no supercharging additive. ECD mass spectra of (c) [cyt c, 24H]24+ and (d), [cyt c, 18H]18+ which were the highest charge states that could be readily isolated from each solution. The ECD mass spectrum of [cytochrome c, 24H]24+ is vertically expanded by a factor of 100. Peaks corresponding to the reduced precursor ions (singly and doubly reduced) and instrumental noise are denoted by “*” and “†”, respectively. | ||
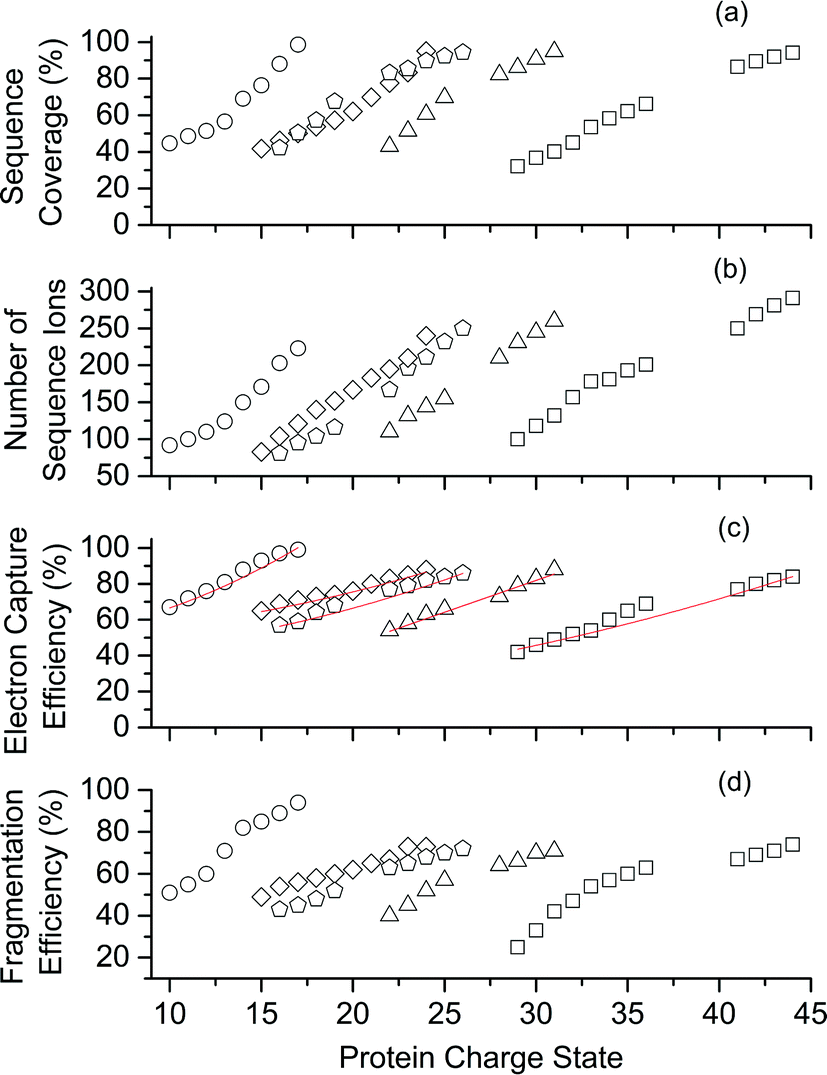 | ||
| Fig. 2 Performance of ECD-MS for obtaining complete protein sequence characterisation significantly improves as charge state increases. ECD-MS (a) sequence coverage, (b) total number of sequence ions, (c) electron capture efficiency and (d) fragmentation efficiency vs. charge state for ubiquitin (open circles), cytochrome c (open diamonds), haemoglobin (open pentagons), myoglobin (open triangles), and carbonic anhydrase II (open squares). Linear-regression, best-fit curves (y = A0 + A1z2) are red. For protonated ubiquitin, cytochrome c, haemoglobin, myoglobin, and carbonic anhydrase, charge states ≥ 10, 15, 16, 20 and 29+, respectively, were formed from aqueous solutions containing 0.5% acetic acid and 5% (v/v) 1,2-butylene carbonate. Lower charge states were formed from acidified aqueous control solutions that did not contain 1,2-butylene carbonate. | ||
ECD of mass-selected protonated carbonic anhydrase II (CAII) ion (44+) that was formed using ESI and BC resulted in the formation of 299 total sequence ions and cleavage of 244 of 259 inter-residue sites (94% sequence coverage; 29 kDa protein; Fig. S1†). ECD of [CAII, 33H]33+, which was formed and isolated from solutions without BC, resulted in a sequence coverage value of 54% (188 total sequence ions identified). Sze et al. reported the identification inter-residue cleavages at 248 of 259 inter-residue sites (96% sequence coverage) for 20 charge states of protonated CAII (15+ to 35+) using both ECD and activated ion ECD data.17 For the 44+, comparable ECD sequence coverage (94%) can be obtained upon fragmentation of a single charge state (1 mass spectrum, 300 scans; Fig. S1†).
For protonated bovine serum albumin (BSA) (80+, 66.5 kDa) formed using BC and ESI, ECD resulted in the identification of 593 total isotopic clusters that corresponded to 593 sequence ions, cleavage of 495 of 582 unique inter-residue sites (85% sequence coverage), and an electron capture efficiency of 83% (Fig. 2 and S2†). BSA has 17 disulphide linkages that correspond to 348 inter amino acid residue sites in macrocyclic structures that require at least two bond cleavages to detect sequence ions. For 80+ BSA, cleavage at 274 of 348 inter-residue sites (in addition to R1S–SR2 cleavage) within these disulphide linked macrocycles were identified (78.7% coverage), likely resulting from capture of multiple electrons. That is, one electron can reduce the disulphide linkage (eqn (3)) and another electron can result in cleavage of the amide backbone bond (e.g., eqn (1)). Both reactions (eqn (1) and (3)) should be facilitated by the presence of a charge site near the cleavage sites. ECD of [BSA, 80H]80+ (30 ms irradiation time) resulted in the formation of ions corresponding to the single, doubly and triply reduced precursor ions (Fig. S2†). That is, up to 3 electrons can reduce BSA that has been supercharged by use of BC. For ECD of the 61+ of protonated BSA that was formed without BC, the formation of ions corresponding to the capture of up to 1 electron was observed. For [BSA, 61H]61+, the sequence coverage, electron capture efficiency and number of sequences ions are a factor of 4.2, 2.0 and 4.8 times lower than that obtained for the 80+ (Fig. 2).
The effects of increasing protein ion charge state on the extent of ion dissociation in ECD were investigated for carbonic anhydrase II (29 kDa), myoglobin (17 kDa), haemoglobin (16 kDa), and ubiquitin (8.6 kDa) (Fig. 2).18 For [CAII, zH]z+ (z = 29 to 44), the sequence coverage, number of fragment ions, EC efficiency (and fragmentation efficiency) steadily and monotonically increased from 32.1% to 94.2%, 100 to 299 ions, and 41.2% (25.4%) to 84.2% (74.7%) as the charge state increased, respectively. For the smaller protein ions, these four key performance characteristics (sequence coverage, number of sequence ions, electron capture efficiency, and fragmentation efficiency) also increased monotonically as the charge state increased (Fig. 2). These results suggest that by forming even higher charge states, it should be possible to further increase ECD performance for complete protein sequence characterisation.
For a given protein, the number of sequence ions and the resulting sequence coverage values can increase as the charge state increases (Fig. 2) because: (i) the location of charge sites can direct the sites of cleavage in the ECD of peptides and proteins,19 (ii) electron capture efficiency increases approximately quadratically with charge state,4a (iii) the energy deposited into ions upon electron capture increases with charge,10a–c (iv) ion signal increases linearly with charge for FTMSs,12a and (v) ions in higher charge states tend to yield more highly charged product ions upon ion activation. In addition, gas-phase ion conformations can also affect the efficiency of EC and the location of cleavage sites in ECD.20
Charge sites and cleavage sites
In Fig. S3,† the relative ECD fragment ion abundances for [cyt c, zH]z+ (z = 15 to 24) are plotted vs. amino acid residue number. Cleavage sites tended to be near predicted sites of protonation. For [cyt c, 16H]16+ and [cyt c, 21H]21+, ECD sequence ions correspond to cleavage sites that are within an average of 1.4 and 1.1 residues of amino acid residues that were predicted to be protonated based on calculations by Schnier et al.; that is, >85% of the total average weighted sequence ion abundances are within 2 or fewer residues of the predicted charge sites.21 For [CAII, 36H]36+, the identified ECD cleavages are within an average of 1.7 amino acid residues from residues that were calculated to be charged and >75% of the total average weighted sequence ion abundances were within 2 or fewer residues of charge sites. For protonated cyt c, the three longest sequences of residues between amino acid residues that are calculated to be charged are shown in Fig. S3,† which are Phe-46 to Lys-53, Glu-62 to Lys-72 and Glu-90 to Lys-99. For the 16+, five of the longest sequences for which an ECD cleavage site was not identified included three that overlapped significantly with the three longest sequences between the predicted proton locations and the residues spanned by the haem crosslink (Cys-14 and Cys-17). As the charge state increased from 16+ to 24+, the ECD sequence coverage for Phe-46 to Lys-53, Glu-62 to Lys-72 and Glu-90 to Lys-99 monotonically increased to 100% (Fig. S3†). Overall, these data are consistent with charge sites directing electron capture cleavage sites. Electron capture can neutralise charge sites solvated by backbone carbonyl groups, resulting in cleavage of the backbone N–Cα bonds4a,19c and/or electron capture by the amide backbone bond can be stabilised by a charge site that is relatively close to the site of electron capture.22 Many other factors should also affect the locations of ECD cleavage sites, including the amino acid identity,23 basicity of protonation sites,22a ion conformation,24 and the composition of solutions from which protein ions are formed.20Electron capture efficiency
For a point charge, the theoretical electron capture cross section increases quadratically with charge state (z2).4a In general, the electron capture efficiency values of the five proteins increased as z2 increased within experimental error (Fig. 2). Although the linear regression best-fit quadratic curves (y = y0 + zx, where y is the electron capture efficiency, z is charge, and y0 and x are variable) result in x values that range from 1.2 to 1.5, linear regression best-fit curves for x = 2 also fit the experimental data reasonably well (Fig. 2c). For each protein, the initial energy of the electrons and the irradiation times were changed to maximise the abundances of sequence ions for the highest charge states that could be readily isolated. Thus, it is not expected that electron capture efficiencies for charge states of different proteins should necessarily increase quadratically. The highest charge states of CAII (41 to 44+) are lower than the z2 trend predicted by extrapolating the data for the lower charge states (29 to 36+). The lower x values than expected might result from the significant increase in the number of fragment ions as charge states increase, which could result in the partitioning of ion signal into many low abundance ions that were not readily identified for higher charge states than lower charge states. Our data are consistent with that from Zubarev et al., in which the electron capture cross sections for 1+ ions of gramicidin, 5+ ions of insulin and 15+ ions of apomyoglobin, increased quadratically within experimental uncertainty.4a Many factors should affect ion-electron capture cross sections. For example, more compact structures of [ubiquitin, 6H]6+ which were selected by ion mobility had higher electron capture efficiencies than less compact structures of [ubiquitin, 7H]7+.20 In our experiments, the protein ions formed from denaturing solutions should be largely unfolded and large-scale protein ion conformational effects are not expected to significantly affect electron capture cross sections.Types of sequence ions
For all proteins, the number of identified a, b, c, x, y and z ions generally increased monotonically as the charge state increased (Fig. 3). Surprisingly, the total number of identified b/y and c/z ions for each protein of a given charge state were comparable, although the average weighted abundances of the c and z ions were generally a factor of 10 higher than those for the b/y and a/x ions for all charge states and proteins. For example, ECD of [cyt c, 24H]24+ resulted in a total of 44, 41, 60, 55, 22, and 27 of b, y, c, z, a and x ions, respectively. For [cyt c, 15H]15+, these values were 13, 15, 18, 23, 5, and 9, respectively. Representative mass spectra of a, x, b, y, c, and z ions formed upon ECD of the 24+ of cytochrome c are shown in Fig. S5.† In general, a and y ions were assigned to odd-electron ions and b and x ions were assigned to even-electron ions. For example, all identified a and y ions in the ECD mass spectra of [ubq, 10H]10+ and [ubq, 17H]17+ were assigned to odd-electron ions, and all b and x ions were assigned to even-electron ions based on comparisons to the theoretical isotope distributions. For each protein, linear-regression best-fit lines of the number of identified a, b, c, x, y, z ions vs. charge state (30 best-fit lines) have correlation coefficients that range from 0.998 to 0.837. For these charge states, the number of identified c/z ions (and b/y ions) increased by between 5 and 9 c/z ions (and 4 and 7 b/y ions) identified per charge as protonation state increased. The number of a/x ions increased by between 2 and 4 sequence ions identified per charge; that is, the total number of identified sequence ions increased by between 12 and 17 ions per additional charge as protonation states increased under these conditions (Fig. 3).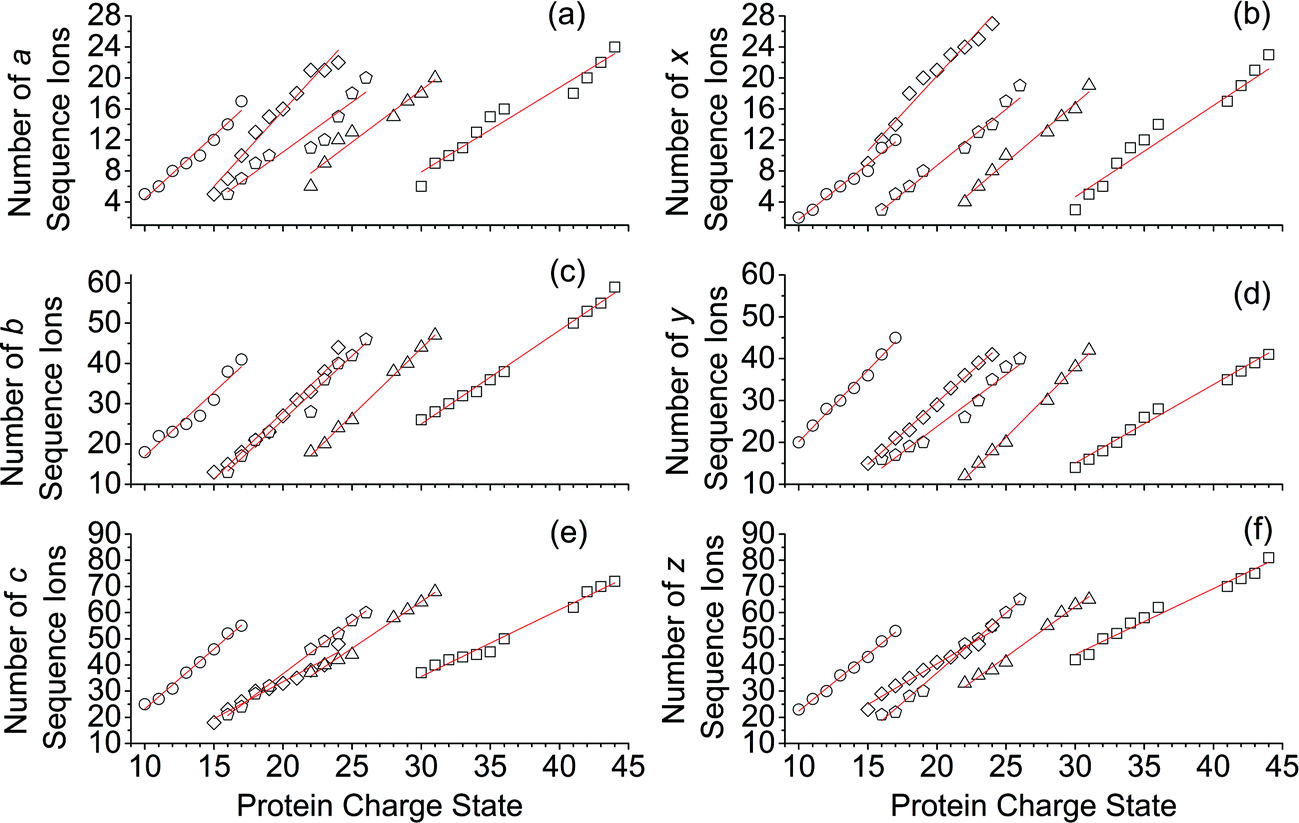 | ||
| Fig. 3 Number of a, b, c, x, y, and z sequence ions that were identified in the ECD mass spectra of protonated ubiquitin (open circles, 10+ to 17+), cytochrome c (open diamonds, 15+ to 24+), haemoglobin (open pentagons, 17+ to 26+), myoglobin (open triangles, 22+ to 31+), and carbonic anhydrase II (open squares, 29+ to 44+) as a function of charge state. | ||
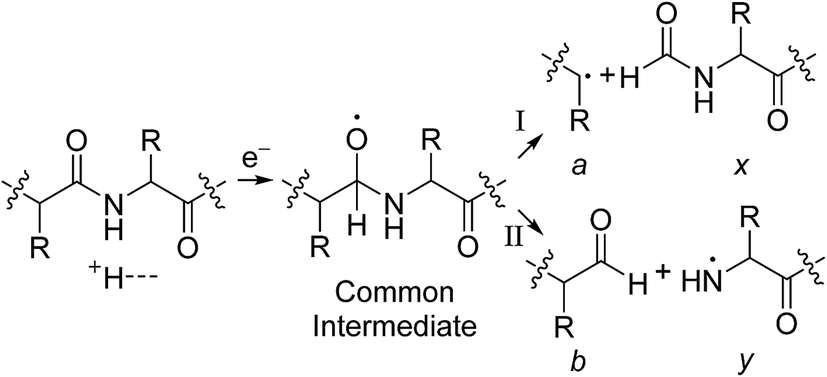
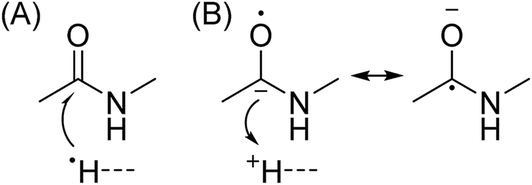
The identification of many a, x, b and y ions in the ECD of protein ions is intriguing. These sequence ions can be formed via direct cleavage of Cα–Cβ backbone bonds (to form a/x ions) and amide backbone bonds (b/y ions). In addition, a and y ions could be formed via cleavage of an amide backbone bond and loss of a CO molecule (eqn (2)).4a A total 610, 1338, 586, and 1273 a, b, x and y ions were identified in the ECD mass spectra of ubiquitin (10 to 17+), cytochrome c (15 to 24+), haemoglobin (16 to 26+), myoglobin (22 to 31+), and carbonic anhydrase II (29 to 44+) (Fig. 4). Of the total number of a ions (610), 477 were complementary to x ions (Fig. 4a); that is, 477 a/x ion pairs were identified that correspond to cleavages at the same inter-residue sites and the charge states of the a and x ions sum to that of the precursor ion. 209 of 610 total a ions were complementary to y ions (Fig. 4a). In contrast, 951 of 1273 y ions were complementary to b ions (Fig. 4b) and a significantly smaller fraction of y ions (209 of 1273) were complementary to a ions (Fig. 4b). The prevalence of complementary a/x and b/y ion pairs in the spectra compared to a/y ion pairs did not depend strongly on the charge state of the precursor ions (Fig. S6†) or the identity of the protein (Fig. S7†). That is, formation of complementary a and x ions was strongly associated with cleavage of the same inter-residue Cα–Cβ backbone bond. Complementary a/y ion pairs, which were identified in a significantly lower proportion compared to that for a/x and b/y ion pairs (Fig. 4), could be formed viaeqn (2) (i.e., CO loss from b ions). Interestingly, 104 of 477 complementary a/x ion pairs corresponded to cleavages at inter-residue sites where complementary b/y ions were also formed. Complementary a/x and b/y ions could possibly be formed via the pathways shown in Scheme 1.22a
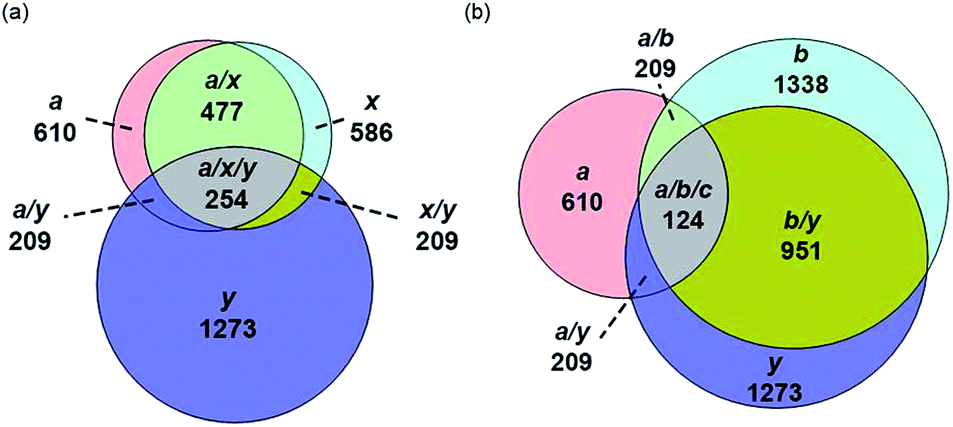 | ||
| Fig. 4 Total number of (a) a, x and y sequence ions and (b) a, b, and y sequence ions and the number of sequence ions that correspond to cleavages at common inter-residue sites for ubiquitin (10 to 17+), cytochrome c (15 to 24+), haemoglobin (16 to 26+), myoglobin (22 to 31+), and carbonic anhydrase II (29 to 44+) depicted as Venn diagrams. | ||
 | ||
| Scheme 1 | ||
In Scheme 1, electron capture results in the formation of an oxygen centred radical site on the amide backbone carbonyl group by: (i) neutralisation of a proton to form a hydrogen atom4a,c that attaches to the β-carbon of the backbone amide carbonyl group (Scheme 2A); or (ii) formation of an amino ketyl radical anionic group via electron capture at the amide bond22 and abstraction of a proton by the β-carbon of the amino ketyl radical anion site (Scheme 2B).
 | ||
| Scheme 2 | ||
β-Elimination of the Cα–Cβ (Scheme 1, Pathway I) and the Cβ–N (Scheme 1, Pathway II) backbone bonds could result in the formation of complementary ions a/x and b/y. Alternatively, H-atom ejection upon electron capture could result in the formation of a vibrationally excited even-electron ion, which can occur for relatively small peptides8c,25 and proteins.26 Although b/y ions are common products of vibrationally excited even-electron ions, the extent of energy deposition corresponds to millivolts per vibrational mode for these proteins.4a,20 In addition, all of the identified a and y ions were assigned to odd-electron ions and all of the b and x ions were assigned to even-electron ions for both a low and a high charge state of ubq (see above), which is consistent with the mechanisms shown in Scheme 1.
The formation of a, b, and y ions in the ECD of peptide ions has been associated with peptides that contain few or no basic amino acid residues and those that contain more protons than basic sites;8a,b,19a,25i.e., for peptides that contain backbone amide groups that are protonated. Reports of abundant b ions in ECD mass spectra of proteins are rare. Håkansson and co-workers reported that many b ions were formed in relatively high abundance in the ECD of [melittin, 5H]5+ that should contain one proton that is not immobilised at a conventional basic site, whereas no b ions were identified for ECD of [melittin, 4H]4+.8b As the charge states of proteins increase, the number of basic amino acid sites that are available for protonation decreases and the frequency of protonation of Trp, Gln, Asn, and Pro residues, and the amide backbone residues increases.21a Using BC and ESI, we can readily form protein ions that contain more protons than available basic residues.13a For example, the 44+ of protonated carbonic anhydrase contains 33% more protons than conventional basic sites. The formation of the a, b and y ions could increase as the charge states increase owing to more charges being localised on the protein amide backbone.
Effects of analyte size
The sequence coverage, number of sequence ions, the electron capture efficiency, and fragmentation efficiency are plotted vs. protein size (8.6 to 66.5 kDa) for the highest charge states that can be readily formed and isolated from solutions containing BC in Fig. 5. Near complete protein characterisation (in terms of sequence) from single charge states was obtained for all six proteins (99% to 85%; 8.6 to 66.5 kDa). The sequence coverage generally remained constant or declined slightly with increasing size (Fig. 5). That is, cleavages of 74 of 75 inter-residue sites (99%) for [ubq, 17H]17+ (8.6 kDa) and 495 out of 582 inter-residue sites (85%) for [BSA, 80H]80+ (66.5 kDa) were identified. Moreover, the electron capture efficiency (and fragmentation efficiency) values were all relatively high and declined slightly or stayed the same with increasing protein size (Fig. 5). For example, the EC efficiency (and fragmentation efficiency) values of 98% (95%) and 84% (73%) were obtained for [ubiquitin, 17H]17+ and [BSA, 80H]80+. For the highest charge states that could be readily isolated without addition of BC, ECD performance depended declined more sharply with increasing protein size than by use of BC (Fig. 5). For example, the sequence coverage values for charge states formed without BC were between 50% and 80% lower than those formed using BC (Fig. 5). For BSA, the sequence coverage obtained for ECD of the 61+ charge state was a factor of 3.8 lower than that obtained for the 80+ charge state. For ECD of [BSA, 80H]80+, 593 sequence ions for [BSA, 80H]80+ is the most that have been reported for a single charge state of a protein ion by tandem mass spectrometry (to our knowledge), and was more than a factor of 5 higher than that obtained for ECD of [BSA, 61H]61+ (138 sequence ions; Fig. S2†)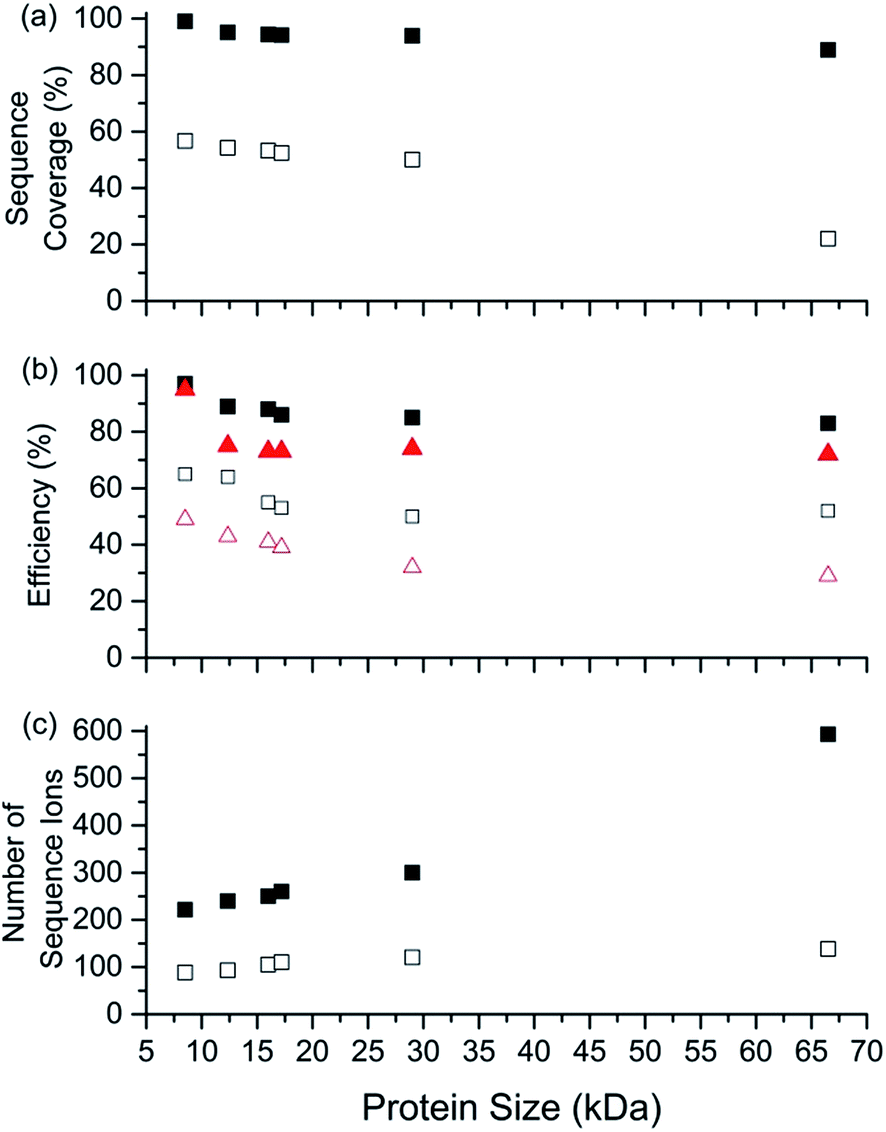 | ||
| Fig. 5 Performance characteristics of ECD-MS for obtaining complete protein sequence characterisation as a function of protein mass using ESI solutions containing 1,2-butylene carbonate. ECD-MS (a) sequence coverage, (b) electron capture efficiency (black squares) and fragmentation efficiency (red triangles) and (c) total number of sequence ions identified vs. protein size (kDa) for highest charge states that can be formed and readily isolated by ESI of aqueous solutions containing 0.5% acetic acid and either 5% BC (closed symbols) or no BC (open symbols). ECD-MS data obtained for protonated ubiquitin (17+ and 13+), cytochrome c (24+ and 19+), haemoglobin (single monomer; 26+ and 20+), myoglobin (31+ and 25+), carbonic anhydrase II (44+ and 36+), and bovine serum albumin (80+ and 61+). | ||
Experimental
ECD experiments were conducted on a hybrid linear quadrupole ion trap and 7 T Fourier transform ion cyclotron resonance MS (LTQ-FT/ICR-MS; Thermo Scientific). ESI solutions were infused into the external ion source at 3 μL min−1 and ions were formed by applying a voltage of +3 to 3.5 kV to the ESI capillary relative to the capillary inlet to the MS. Aqueous ESI solutions contained 5 μM protein, 5% (v/v) 1,2-butylene carbonate, and 0.5% acetic acid, unless stated otherwise. Charge states were mass selected in the LTQ-MS at a pressure of ∼1–2 mTorr to ensure ions were thermalized,27 isolated (±5 m/z window), and transferred to the FT-ICR for ECD (25–50 ms irradiation time; 2.5–3 eV, Table S3;† 300 scans; resolution of ca. 100![[thin space (1/6-em)]](https://www.rsc.org/images/entities/char_2009.gif) 000). A pulse of gas was not used to assist with ion trapping in the ultrahigh vacuum of the FT/ICR cell, which should minimise any collisional activation of ions during ECD. Full details of data analysis and materials are in the electronic supplementary information.†
000). A pulse of gas was not used to assist with ion trapping in the ultrahigh vacuum of the FT/ICR cell, which should minimise any collisional activation of ions during ECD. Full details of data analysis and materials are in the electronic supplementary information.†
Conclusions
Supercharging protein ions in ESI using 1,2-butylene carbonate yields significant performance gains for characterising intact protein ions by electron capture dissociation mass spectrometry. ECD of ‘extremely’ supercharged proteins ions (8.6 to 66.5 kDa) can be highly efficient (97% to 85% electron capture efficiencies) and result in extensive sequence coverage (99% to 85%). For 80+ BSA (66.5 kDa) that contains 17 intact disulphide bonds, ECD resulted in cleavages at 495 of 582 inter-residue amino acids (85%), the formation of 593 sequence ions, and an electron capture efficiency of 85%, which are the highest of these three values that have been reported for a protein of this size or larger by any ion activation method (to our knowledge). These results suggest that the sequential capture of multiple electrons by extremely supercharged proteins (<50 ms), that have very high electron capture cross sections, can be useful for obtaining highly efficient fragmentation of a relatively large protein ion that contains many disulphide bonds. That is, both a disulphide bond (eqn (3)) and a peptide backbone bond (e.g., eqn (1)) can be cleaved upon the sequential reduction of a highly charged precursor ion, resulting in extensive fragmentation and high sequence coverage.Interestingly, many complementary b/y and a/x ions were identified in the ECD mass spectra of all protonated protein ions that were investigated, in which 6067 sequence ions were identified. Because the vast majority of a and b ions were complementary to x and y ions, respectively, and significantly fewer complementary a and y ions were identified, these data suggest that the formation of a and y ions can often occur as result of the cleavage of Cα–Cβ and amide peptide backbone bonds, respectively. For these proteins and charge states, the formation of complementary a and y ions via the loss of CO from a b ion intermediate is also plausible (eqn (2)), although this dissociation pathway is less prevalent based on the relatively fewer number of complementary a/y ions that were identified compared to complementary a/x and b/y ion pairs.
For these 6 proteins, the effectiveness of protein supercharging in ESI using BC is relatively general.13a For example, the extent of charge enhancement obtained by use of BC compared to that without BC (35% to 42%) does not depend strongly on protein size (8.6 to 66.5 kDa) or acidity (pI values from 5.1 to 9.6), which is consistent with results obtained using other supercharging additives14 that are less effective for enhancing analyte charging under these conditions.13a Given that supercharging using BC (and related analogues) is compatible with both nanoelectrospray ionisation13b and electrospray ionisation13a and the extent of charging does not depend strongly on protein concentration (for concentrations up to at least 100 μM), it is anticipated that BC will prove useful for enhancing the charging of protein and peptide ions formed by ESI in liquid chromatography (LC) MS experiments. The supercharging additive can be introduced either post-column19a or doped directly into the LC eluent.28 Given that the dissociation of higher charge states generally results in more highly charged product ions that can be more readily detected by charge sensitive detection (e.g., FTMSs) than for precursor ions in lower charge states, the use of 1,2-butylene carbonate to supercharge proteins in ESI should also enhance the performance of other ion activation methods, such as UVPD, ETD and activated ion ECD/ETD. Because the performance of ECD of supercharged protein ions declined only slightly as protein ion masses increased from 8.6 to 66.5 kDa, it is anticipated that near complete protein characterization can be obtained for proteins with masses that are far greater than 60 kDa.
Acknowledgements
We thank Ms Sydney Liu Lau and Associate Professor Mark Raftery [Bioanalytical MS Facility (BMSF), University of New South Wales], and Mr Michael Leeming and Prof. Richard A. J. O'Hair (School of Chemistry, University of Melbourne) for helpful discussions. MAZ acknowledges the BMSF for an Honours Research Scholarship. WAD thanks the Australian Research Council for a Discovery Early Career Research Award fellowship (DE130100424).Notes and references
- J. B. Fenn, et al. , Science, 1989, 24, 8 Search PubMed.
- R. Aebersold and D. R. Goodlett, Chem. Rev., 2001, 101, 269 CrossRef CAS PubMed.
- (a) G. E. Reid and S. A. McLuckey, J. Mass Spectrom., 2002, 37, 663 CrossRef CAS PubMed; (b) J. D. Tipton, et al. , J. Biol. Chem., 2011, 286, 25451 CrossRef CAS PubMed; (c) B. Bogdanov and R. D. Smith, Mass Spectrom. Rev., 2005, 24, 168 CrossRef CAS PubMed.
- (a) R. A. Zubarev, et al. , Anal. Chem., 2000, 72, 563 CrossRef CAS; (b) H. J. Cooper, K. Hakansson and A. G. Marshall, Mass Spectrom. Rev., 2005, 24, 201 CrossRef CAS PubMed; (c) R. A. Zubarev, N. L. Kelleher and F. W. McLafferty, J. Am. Chem. Soc., 1998, 120, 3265 CrossRef CAS; (d) R. A. Zubarev, Curr. Opin. Biotechnol., 2004, 15, 12 CrossRef CAS PubMed; (e) R. A. Zubarev, et al. , Eur. J. Mass Spectrom., 2002, 8, 337 CrossRef CAS.
- (a) J. E. Syka, et al. , Proc. Natl. Acad. Sci. U. S. A., 2004, 101, 9528 CrossRef CAS PubMed; (b) H. P. Gunawardena, et al. , J. Am. Chem. Soc., 2005, 127, 12627 CrossRef CAS PubMed.
- J. B. Shaw, et al. , J. Am. Chem. Soc., 2013, 135, 12646 CrossRef CAS PubMed.
- (a) R. A. Zubarev, et al. , J. Am. Chem. Soc., 1999, 121, 2857 CrossRef CAS; (b) B. Ganisl and K. Breuker, ChemistryOpen, 2012, 1 CrossRef CAS PubMed; (c) S. R. Cole, et al. , J. Am. Soc. Mass Spectrom., 2012, 23, 310 CrossRef CAS PubMed.
- (a) H. J. Cooper, J. Am. Soc. Mass Spectrom., 2005, 16, 1932 CrossRef CAS PubMed; (b) H. Liu and K. Håkansson, J. Am. Soc. Mass Spectrom., 2007, 18, 2007 CrossRef CAS PubMed; (c) J. S. Prell, et al. , J. Am. Chem. Soc., 2008, 130, 12680 CrossRef CAS PubMed.
- D. M. Horn, Y. Ge and F. W. McLafferty, Anal. Chem., 2000, 72, 4778 CrossRef CAS.
- (a) W. A. Donald, et al. , J. Am. Chem. Soc., 2010, 132, 4633 CrossRef CAS PubMed; (b) W. A. Donald and E. R. Williams, J. Am. Soc. Mass Spectrom., 2010, 21, 615 CrossRef CAS PubMed; (c) W. A. Donald and E. R. Williams, Pure Appl. Chem., 2011, 83, 2129 CrossRef CAS; (d) W. A. Donald, et al. , Proc. Natl. Acad. Sci. U. S. A., 2008, 105, 18102 CrossRef CAS PubMed.
- K. Håkansson, et al. , Anal. Chem., 2003, 75, 3256 CrossRef.
- (a) A. G. Marshall, C. L. Hendrickson and G. S. Jackson, Mass Spectrom. Rev., 1998, 17, 1 CrossRef CAS; (b) A. Makarov, et al. , Anal. Chem., 2006, 78, 2113 CrossRef CAS PubMed.
- (a) M. A. Zenaidee and W. A. Donald, Analyst, 2015 Search PubMed; (b) C. A. Teo and W. A. Donald, Anal. Chem., 2014, 86, 4455 CrossRef CAS PubMed.
- (a) A. T. Iavarone and E. R. Williams, J. Am. Chem. Soc., 2003, 125, 8 CrossRef PubMed; (b) A. T. Iavarone and E. R. Williams, Int. J. Mass Spectrom., 2002, 219, 63 CrossRef CAS; (c) S. H. Lomeli, et al. , J. Am. Soc. Mass Spectrom., 2010, 21, 127 CrossRef CAS PubMed.
- D. M. Horn, R. A. Zubarev and F. W. McLafferty, Proc. Natl. Acad. Sci. U. S. A., 2000, 97, 10313 CrossRef CAS.
- T. G. Flick, W. A. Donald and E. R. Williams, J. Am. Soc. Mass Spectrom., 2013, 24, 193 CrossRef CAS PubMed.
- S. K. Sze, et al. , Proc. Natl. Acad. Sci. U. S. A., 2002, 99, 1774 CrossRef CAS PubMed.
- The ECD data for [ubq, 17H]17+ and [ubq, 13H]13+ are from ref. 13a.
- (a) Y. O. Tsybin, et al. , J. Am. Soc. Mass Spectrom., 2006, 17, 1704 CrossRef CAS PubMed; (b) A. T. Iavarone, K. Paech and E. R. Williams, Anal. Chem., 2004, 76, 2231 CrossRef CAS PubMed; (c) O. S. Skinner, K. Breuker and F. W. McLafferty, J. Am. Soc. Mass Spectrom., 2013, 24, 807 CrossRef CAS PubMed.
- E. W. Robinson, R. D. Leib and E. R. Williams, J. Am. Soc. Mass Spectrom., 2006, 17, 1470 CrossRef PubMed.
- (a) P. D. Schnier, D. S. Gross and E. R. Williams, J. Am. Soc. Mass Spectrom., 1995, 6, 1086 CrossRef CAS; (b) P. D. Schnier, W. D. Price and E. R. Williams, J. Am. Soc. Mass Spectrom., 1996, 7, 972 CrossRef CAS.
- (a) F. Tureček and R. R. Julian, Chem. Rev., 2013, 113, 6691 CrossRef PubMed; (b) I. Anusiewicz, P. Skurski and J. Simons, J. Phys. Chem. B, 2014, 118, 7892 CrossRef CAS PubMed.
- R. A. Zubarev, D. M. Good and M. M. Savitski, J. Am. Soc. Mass Spectrom., 2012, 23, 1015 CrossRef CAS PubMed.
- (a) J. M. D. Kalapothakis, et al. , Chem. Commun., 2014, 50, 198 RSC; (b) O. S. Skinner, F. W. McLafferty and K. Breuker, J. Am. Soc. Mass Spectrom., 2012, 23, 1011 CrossRef CAS PubMed; (c) H. Ben Hamidane, et al. , J. Am. Soc. Mass Spectrom., 2009, 20, 1182 CrossRef CAS PubMed.
- K. F. Haselmann and M. Schmidt, Rapid Commun. Mass Spectrom., 2007, 21, 1003 CrossRef CAS PubMed.
- (a) K. Breuker, et al. , Eur. J. Mass Spectrom., 2002, 8, 177 CrossRef CAS; (b) Y. O. Tsybin, et al. , J. Mass Spectrom., 2004, 39, 719 CrossRef CAS PubMed.
- W. A. Donald, G. N. Khairallah and R. A. J. O'Hair, J. Am. Soc. Mass Spectrom., 2013, 24, 811 CrossRef CAS PubMed.
- (a) H. Hahne, et al. , Nat. Methods, 2013, 10, 989 CrossRef CAS PubMed; (b) S. G. Valeja, et al. , Anal. Chem., 2010, 82, 7515 CrossRef CAS PubMed.
Footnote |
| † Electronic supplementary information available: Fig S1 and S2: ECD-MS spectra of protonated CAII and BSA ions. Fig. S3: ECD-MS fragment ion abundances of protonated cyt c vs. residue number. Fig. S4: representative mass spectra of a, b, c, x, y, and z sequence ions. Fig. S5 and 6: effects of charge state and protein identity on Venn diagrams of a, b, x, and y sequence ions. Fig S7: theoretical ion abundances vs. mass to account for isotopic dilution in efficiency calculations. Table S1 and S2: effects of cyt c concentration on extent of charging and ECD parameters used for each protein ion. See DOI: 10.1039/c5ay00710k |
| This journal is © The Royal Society of Chemistry 2015 |