
 Open Access Article
 This Open Access Article is licensed under a
 Creative Commons Attribution 3.0 Unported Licence
Analysis of fatty acids and triacylglycerides by Pd nanoparticle-assisted laser desorption/ionization mass spectrometry†
Yuliya E.
Silina
ab,
Claudia
Fink-Straube
a,
Heiko
Hayen
c and
Dietrich A.
Volmer
*b
aLeibniz Institute for New Materials (INM), Saarbrücken, Germany
bInstitute of Bioanalytical Chemistry, Saarland University, D-66123 Saarbrücken, Germany. E-mail: Dietrich.Volmer@mx.uni-saarland.de; Fax: +49 681 302 2963; Tel: +49 681 302 3433
cInstitute of Inorganic and Analytical Chemistry, University of Münster, Münster, Germany
First published on 19th March 2015
Abstract
In this study, we propose a simple and rapid technique for characterization of free fatty acids and triacylglycerides (TAG) based on palladium nanoparticular (Pd-NP) surface-assisted laser desorption/ionization (SALDI) mass spectrometry (MS). The implemented Pd-NP material allowed detection of free fatty acids and TAGs exclusively as [M + K]+ ions in positive ion mode. Under negative ionization conditions, unusual trimetric structures were generated for free fatty acids, while TAGs underwent irreproducible degradation reactions. Importantly, the mass spectra obtained from Pd-NP targets in positive ion mode were very clean without interferences from matrix-derived ions in the low m/z range and readily enabled the detection of intact TAGs in vegetable oils without major fragmentation reactions as compared to conventional MALDI-MS, requiring only a minimal amount of sample preparation.
Introduction
Vegetable oils are complex mixtures of triacylglycerides (TAG), mono and diacylglycerides, free fatty acids (FFA), wax esters, alkanes, sterols, tocopherols and other compounds.1,2 TAG and FFA compositions of vegetable oils are necessary for quality control and authenticity confirmation.3 Several methods have been proposed for TAG and FFA analysis: Raman spectroscopy,4,5 liquid and gas chromatography (LC, GC),6–10 and mass spectrometry (MS) using electrospray ionization (ESI),11 atmospheric pressure chemical ionization (APCI),12,13 matrix-assisted laser desorption/ionization (MALDI),14–25 and surface-assisted laser desorption/ionization (SALDI).26–32MALDI-MS offers several advantages for analysis of lipids, including simple and fast sample preparation, and the ability to analyze samples without prior derivatization. MALDI measurements, however, suffer from interferences of matrix peaks in the low m/z range (in particularly for m/z < 500), sweet spot phenomena, and poor reproducibility from lack of homogeneity of matrix/sample crystals.33–35 These problems can be potentially minimized or avoided by using ‘matrix-free’ LDI using inorganic substrates (surface-assisted laser desorption/ionization, SALDI32) instead of organic MALDI matrices. In SALDI, analyte molecules are desorbed and ionized upon laser irradiation from materials such as inorganic nanostructured substrates; MS subsequently analyzes the formed ions. The substrate is involved in the transfer of charge to the analyte and supports desorption/ionization, usually producing singly-charged ions with a little or no fragmentation.32 In addition, SALDI-MS is highly tolerant of the presence of salts, making analysis of untreated samples (e.g. diluted vegetable oils) readily possible. Moreover SALDI-MS can be used for determination of analytes that are poorly ionized in MALDI, for example, free fatty acids, which often require auxiliary reagents (e.g. alkali salts)1 or chemical derivatization.35
We have previously reported on the application of palladium-based nanoparticles for SALDI-MS of low molecular weight compounds, in particular on physicochemical parameters involved in ion formation; for example, conductivity, absorbance, ability to dissipate laser energy, melting effects, and surface disorders.36–38
In this study, we extend the application of Pd-NP materials to demonstrate the proof-of-principle for quantitative determination of fatty acids and TAGs in different vegetable oil samples. As will be shown, there are two general advantages of our approach over MALDI methods: (1) the technique generally provides only [M + K]+ ions, whereas MALDI can generate multiple species for each analyte (e.g. [M + H]+, [M + Na]+ and [M + K]+). This is important as the entire ion current is focused into one species, which increases sensitivity in quantitative application using, for example, selected ion monitoring (SIM) or selected reaction monitoring (SRM) on triple quadrupole mass spectrometers. Equally, unknown compounds can be confidently assigned a molecular weight in profiling, fingerprinting or metabolomics applications. (2) Our approach avoids the usual decompositions seen with TAGs, which are believed to be catalyzed by protons and has lead to significant “diacylglyceride (DAG) like” fragments. In our approach, this decomposition occurs only to a minor extent, thus improving diagnostic information in the higher mass TAG region of the spectra.
Experimental
Chemicals and materials
Palmitic acid (C16![[thin space (1/6-em)]](https://www.rsc.org/images/entities/char_2009.gif) :0), stearic acid (C18:0), oleic acid (C18:1), linoleic acid (C18:2), linolenic acid (C18:3), tripalmitin (PPP), triolein (OOO), dihydrobenzoic acid (DHB), H2PdCl4, (NH4)2HPO4, Na2HPO4·12H2O, NH4Cl and NH4OH were obtained from Sigma-Aldrich (Steinheim, Germany); acetonitrile, methanol, n-hexane, chloroform, tetrahydrofuran (THF) from Merck (Darmstadt, Germany), Pd metal foil (99.9%) from Heraeus (Hanau, Germany). Organic-free deionized water was generated by an Elga PureLab (Celle, Germany) purification system.
:0), stearic acid (C18:0), oleic acid (C18:1), linoleic acid (C18:2), linolenic acid (C18:3), tripalmitin (PPP), triolein (OOO), dihydrobenzoic acid (DHB), H2PdCl4, (NH4)2HPO4, Na2HPO4·12H2O, NH4Cl and NH4OH were obtained from Sigma-Aldrich (Steinheim, Germany); acetonitrile, methanol, n-hexane, chloroform, tetrahydrofuran (THF) from Merck (Darmstadt, Germany), Pd metal foil (99.9%) from Heraeus (Hanau, Germany). Organic-free deionized water was generated by an Elga PureLab (Celle, Germany) purification system.
Sample preparation
Fatty acid standards at 1 mg mL−1 were prepared in methanol; TAGs at 1 mg mL−1 in chloroform. Working solutions were obtained by diluting stock solutions to the required concentration levels, of which 1 μL aliquots were spotted directly onto the electroplated targets; spots were dried under ambient conditions. To compare the analytical performance of Pd-NP with conventional MALDI, 10 mg mL−1 DHB in methanol was used as matrix solution.Oil samples
Six different vegetables oils (olive oils: cold extracted [I], frying [II]; rapeseed oils: cold extracted [III], refined [IV]; sunflower oils: cold extracted [V], refined [VI]) were purchased from a local supermarket. One μL of oil was dissolved in 1 mL of acetonitrile/tetrahydrofuran (75:25, v/v) and the solution deposited onto Pd-NP-based substrates. MALDI was performed using the dried droplet method on steel MALDI targets similar to a procedure described by Schiller et al.39
Electrolytic deposition of metal films
Galvanic Pd-NP were synthesized from the following electrolyte solutions: H2PdCl4, 3.5 g L−1; (NH4)2HPO4, 20g L−1; Na2HPO4·12H2O, 100g L−1; NH4Cl, 25g L−1 (pH = 8.5). Before galvanic deposition, the steel carrier was polished using abrasive papers (9 → 6 → 3 μm grain sizes) followed by diamond paste treatment. Electrolysis was performed at 296 K using a VMP3 potentiostat (Biologic SAS, Claix, France). Optimization of galvanic parameters was described previously35,36 using the following parameters: Ik = 9.4 mA dm−2, tel = 30 s to deposit Pd on steel; anode, Pd plate (99.99%). To improve dispersion of the surface, we used ultrasonic treatment for 3 min in acetone and distilled water, followed by H2 saturation for 1–3 min.36–38Scanning electron microscopy (SEM)
SEM images of Pd-NP were captured on a FEI (Hillsboro, OR, USA) Quanta 400 FEG system equipped with an EDAX (Mahwah, NJ, USA) Genesis V 6.04 EDX X-ray spectral analysis system. Images were acquired at an accelerating voltage of 10 keV (spot size 3; 30 μm final lens aperture size; dwell time per pixel, 30 μs). The image size was 1024 × 884 pixels.Raman microscopy
Raman experiments were performed on a HORIBA Jobin Yvon (Longjumeau, France) LabRAM HR Evolution microscope (ambient conditions) using a HeNe laser (Melles Griot IDEX Optics & Photonics, Albuquerque, NM, USA) at an excitation wavelength of 633 nm. Emission was analyzed with an Olympus (Shinjuku, Japan) 100×/0.80 LWD objective (dispersion 1800 lines per mm grating).Mass spectrometry
MALDI and SALDI experiments were performed on a Bruker (Bremen, Germany) Esquire HCT+ ion trap mass spectrometer equipped with a MassTech (Burtonsville, MD, USA) atmospheric pressure (AP)-MALDI ion source and a Nd:YAG solid-state laser (λ = 355 nm, 200 Hz repetition rate, 3 ns pulse duration, laser fluence from 40–65%). Mass spectra were acquired in positive ion mode from m/z 100–1000 with source parameters as follows: capillary voltage, −2500 V; end plate offset, −500 V; skimmer, 40 V; cap exit, 128.5 V; drying gas, 6 L min−1; drying temperature, 70 °C. Typically, 12000 laser shots were averaged for SALDI measurements of each sample. Standardized spiral motions across the entire sample spots were performed for data acquisition in SALDI, with sample locations clearly indicated on the Pd-NP surfaces. For MS/MS, precursor ions were initially isolated in the ion trap (1 μ isolation window); CID amplitude, 1 V, accumulation time, 500 ms.
Results and discussion
Ion species for fatty acids generated from Pd-NP materials
A previously developed SALDI material composed of electroplated nanoparticular Pd (Pd-NP; size range, dp = 60–80 nm; Fig. S1, ESI†) was utilized in this study; the material readily allowed detection of a wide range of low molecular weight compounds as potassiated molecules ([M + K]+), including fatty acids.36–38 In the current work, we also explored the analytical utility of anions of these acids during SALDI, as fatty acids were expected to provide deprotonated molecules, as seen in electrospray ionization or APCI.40,41 Surprisingly, however, under negative ionization conditions, we predominantly observed the formation of intense, unusual trimeric fatty acid agglomerates of the composition [3M + 3H2O − H]− (Fig. 1) for all investigated fatty acids. In addition, to a much smaller extent (<5% relative abundance), [3M − 2H + K]− cationized trimers were observed. Unexpectedly, no deprotonated molecules ([M − H]−) were detected.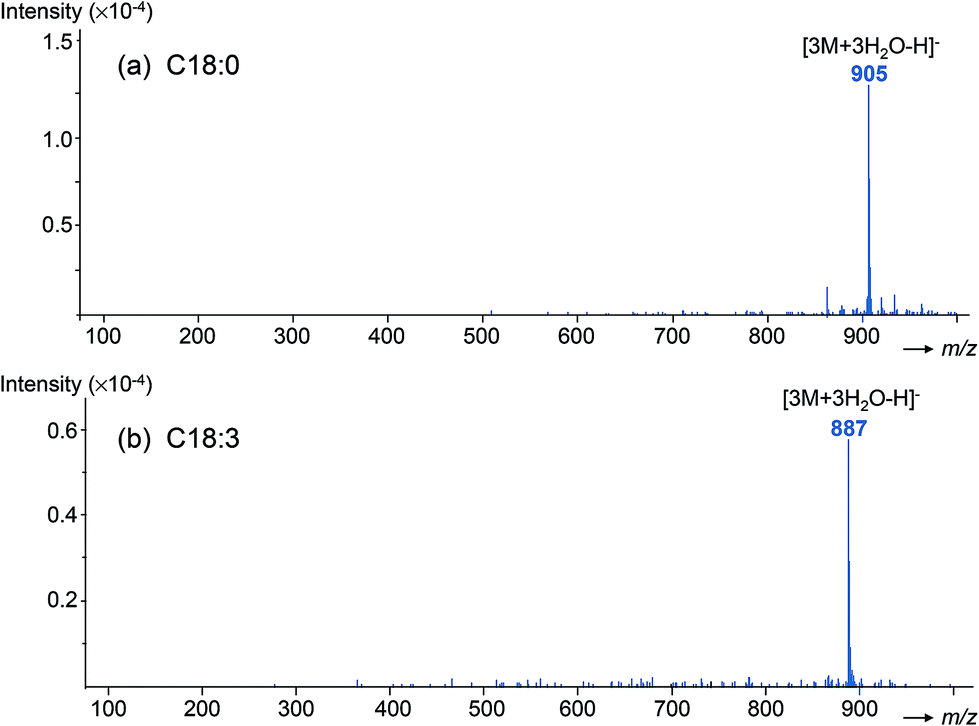 | ||
| Fig. 1 Pd-NP-assisted LDI mass spectra of (a) C18:0 and (b) C18:3 in negative ionization mode. Trimeric cluster ions at m/z 903 (C18:0) and m/z 887 (C18:3) were observed, instead of the initially predicted [M − H]− ions at m/z 283 and 277 for C18:0 and C18:3, respectively. (Laser fluence, 45%; concentration 200 ng μL−1; 1 μL sample deposition.) | ||
This outcome was very different from the negative ion mass spectra seen in DIOS-MS of fatty acids reported by Budimir et al., who reported deprotonated molecules as base peaks and additional, lower abundant cationized multimers, namely [2(M − H) + Na]− dimers and [3M − 2H + K]− trimers.42,43 In their work, the authors also observed selective coordination of Ag+ to give dimeric aggregates of the composition [2(M − H) + Ag]− after addition of AgTFA to the samples, while the trimers remained as [3M − 2H + K]− species.
MS/MS analysis of the [3M + 3H2O − H]− ions from our experiments provided exclusively the free fatty acids in the CID spectra (Fig. 2), even at very low ion activation energies, indicating only weak interactions within the trimer aggregate structures.
 | ||
| Fig. 2 Negative ion Pd-NP-assisted LDI analysis of oleic acid: (a) full scan MS (m/z 899 = [3C18:1 + 3H2O − H]−), (b) CID of m/z 899; linoleic acid: (c) full scan MS (m/z 893 = [3C18:2 + 3H2O − H]−); (d) CID of m/z 893. (CID, 1 V; laser fluence, 45%; FA concentration, 200 ng μL−1.) | ||
Budimir et al. also described heterodimers and heterotrimers for mixtures of fatty acids in their experiments; we detected these heterotrimers in experiments with fatty acid mixtures (Fig. 3a), but did not see any monomers or dimers from Pd-NP SALDI spectra in the entire investigated concentration range of up to 5 μg per spot.
 | ||
| Fig. 3 SALDI mass spectra of a mixture of fatty acids (C16:0, C18:0, C18:1, C18:2, C18:3) obtained in negative ion mode from (a) Pd-NP and (b) PdO-NP materials. Note: M* is used as designator for the analyte in hetero trimeric clusters, when two different fatty acid species (M and M*) are present the same cluster ion. (Laser fluence, 45%.) | ||
Importantly, the [3M + 3H2O − H]− species were formed regardless of the investigated solvents the fatty acids were dissolved in (and then spotted onto the SALDI substrates); namely CHCI3, n-hexane, THF, or methanol. This observation suggests a direct involvement of the Pd material in the aggregation process and that analyte hydration originated during desorption/ion formation on the Pd substrate. McAlpin et al. have demonstrated that Lewis acid/base interactions between cation/anion pairs of metal oxides (MgO, ZnO, NiO, Fe2O3) and analytes can result in chemical transformation (transesterification/hydrolysis) of fatty acids in negative detection mode of metal oxide laser ionization (MOLI) mass spectrometry.44 The electroplated Pd material used in our experiments also contained oxygen as shown from Raman analysis of the Pd-NP film (Fig. S2, ESI†). Ion formation based on Lewis acid/base interactions as described by McAlpin et al.44 probably did not solely explain the ion formation in our experiments, however, because the almost exclusive formation of water trimers was only seen for galvanic Pd-NP, but not for a comparable PdO-NP material, which we generated from galvanic Pd-NP by heating the substrate in an air atmosphere at 400 °C for 3 h (see Experimental section).36 In the latter case, ion formation shifted almost entirely to deprotonated molecules with only low abundant residual [3M + 3H2O − H]− ions in the spectra, which may have been the result of remaining Pd-NP in the PdO-NP material. Rather, we propose that embedded/adsorbed water in the Pd-NP material was supplied during desorption/ion formation from electroplated Pd-NP to give [3M + 3H2O − H]−. This water was likely almost entirely removed from the substrate during heating to give PdO-NP, and that was probably the reason for the absence of water trimers from the PdO substrate and almost sole formation of [M − H]− ions (Fig. 3b). The role of adsorbed water, analyte acidity and terminal –OH groups was previously shown by Chen et al. for porous graphite and silicon substrates, suggesting a dominant role of the substrate's surface chemistry (hydrogen bonds, van der Waals interactions) during ion formation.45
Furthermore, a similar galvanic procedure that we used for synthesis of Ag-NP films gave substrates that generated exactly the same anion species for fatty acids (Fig. S3, ESI†).36 SALDI mass spectra obtained from electroplated Pd-NP exhibited higher signal intensities for anions and less chemical background than Ag-NP, however, which was probably due to the lower thermal conductivity of Pd.36–38
For the analytical application of Pd-NP, it was important that the [M + K]+ ion signals for all fatty acids were linear over almost five orders of magnitude (5–10000 ng mL−1) with coefficients of determination (R2) between 0.942 and 0.996 in positive ion mode (Table S1, ESI†). Fatty acid anions (using the described [3M + 3H2O − H]− trimers) were detected with similar absolute ion currents, but slightly less good correlation in the same range, with R2 values between 0.924 and 0.960 (Table S1†). Importantly, the observed exclusive formation of [M + K]+ ions from Pd-NP materials in positive ion mode, regardless of the analytes' chemical structures36–38 is a significant advantage for quantitative measurements in the multiple reaction monitoring (MRM) mode of triple quadrupole mass spectrometers as the ion current is focused into one species only and not distributed over multiple ions, as often seen in MALDI or electrospray ionization (e.g. simultaneous [M + H]+, [M + Na]+ and [M + K]+ formation); as well molecular weight assignments are less ambiguous for unknown compounds is discovery applications.
Ionization of TAGs
TAGs, exemplified by tripalmitin (PPP) and trioleoylglycerol (triolein, OOO), were also investigated using electroplated Pd targets. In positive mode, both analytes were readily detected as [M + K]+ ions with minimum background signals in the low m/z range, similar to previous results for this Pd-NP material (Fig. 4).36–38 In negative ion mode, unfortunately, no signals for intact anions were observed for the investigated TAGs, but rather only irreproducible signals of fatty acid agglomerates, indicating decomposition of the TAGs upon LDI of the anions. These signals were not useful for analytical purposes. | ||
| Fig. 4 SALDI mass spectra of TAG standards in positive ion mode: (a) tripalmitin (PPP, 30 ng μL−1); (b) triolein (OOO, 10 μg mL−1). (Laser fluence, 45%.) | ||
Analysis of vegetable oils by Pd-NP SALDI-MS
We also applied the Pd-NP targets to more complex vegetable oils. The following vegetable oils were investigated: olive oils, cold extraction, i.e., extra virgin (sample I) and olive oil for frying (II); rapeseed oils, cold extraction (III) and refined (IV); sunflower oils, cold extraction (V) and refined (VI). Previously, Zambonin and coworkers have applied direct LDI from stainless steel targets for fingerprinting of TAGs from olive and sunflower oils, without supporting functional materials.31,46As observed for fatty acid standards above, [M + K]+ ions were formed for the major TAG components in the oil samples in positive ion mode, as well as minor signals for “DAG-like” (see below for definition) fragment ions at m/z 575, 601 and 603 (Fig. 5). Importantly, the Pd-NP-assisted LDI material generated mostly the intact TAG species without major fragmentation, as opposed to MALDI, where extensive fragmentation was seen for TAG species22 (Fig. S4 shows an example of a MALDI-MS analysis of cold-extracted olive oil in our experiments, showing extensive formation of “DAG-like” fragments from protonated precursor ions; see ESI†). Gidden et al. demonstrated47 for sodiated TAGs that fragmentation levels in MALDI could be strongly reduced by adding base to the sample/matrix, to remove catalyzing H+ ions form the matrix and preventing formation of protonated TAGs. The “DAG-like” fragments as described by Gidden et al.47 corresponded to losses of RCOOH and RCOONa from the protonated and sodiated TAGs, giving rise to ions in the m/z range of 573 to 627. Similar decompositions were seen by Calvano et al. for TAGs in LDI-TOF.31 In Pd-NP-assisted LDI in our experiments, only minor fragments in the same region were formed from losses of RCOOK (Fig. 5).
 | ||
| Fig. 5 Pd-NP assisted LDI analyses of commercial rapeseed in positive detection mode using a Pd-NP substrate: (a) cold-extracted oil (III); (b) refined oil (IV). Note: the species' labels and m/z values correspond to [M + K]+ ions (laser fluence, 45%). | ||
An intense cluster region of TAGs between m/z 895 and 925 was seen in our SALDI experiments (Fig. 5 and Table 1). Characteristic olive oil species were represented mostly by triolein (OOO, m/z 923) and OLL (m/z 919; Fig. 5). For rapeseed oil, a significant amount of TAG 54:3 (m/z 923.3), 54:4 (m/z 921.3), 54:5 (m/z 919.3) (Table 1) was measured, while sunflower oil exhibited mainly TAG 54:5, 54:6, 54:4, 54:2.
| Oil | SALDI positive ion mode | |||
|---|---|---|---|---|
| [M + K]+ (m/z) | TAG | Relative abundance (%) | LDI comparisonc (%) | |
| a Only those TAGs are shown that were previously reported by LDI-TOF measurements.46 b “DAG-like” fragments as defined in ref. 47; L = linoleic acid, O = oleic acid. c As reported in ref. 46 for LDI-TOF (Na+ adducts) as compared to Pd-NP SALDI (K+ adducts). | ||||
| Olive (I) cold extraction | 575.5 | TAG 30:1 |
9 | — |
| 577.5 | TAG 30:0 |
36 | 25 | |
| 601.6 | LLb | 11 | 15 | |
| 603.6 | LOb | 54 | 46 | |
| 897.7 | TAG 52:2 |
45 | 53 | |
| 923.7 | TAG 54:3 |
100 | 73 | |
| 925.7 | TAG 54:2 |
63 | 19 | |
| Frying (II) olive | 899.3 | TAG 52:1 |
25 | |
| 897.3 | TAG 52:2 |
58 | ||
| 895.3 | TAG 52:3 |
20 | ||
| 919.3 | TAG 54:4 |
27 | ||
| 923.3 | TAG 54:3 |
100 | ||
| 925.3 | TAG 54:2 |
62 | ||
| Rapeseed (III) cold extraction | 603.6 | LOb | 22 | |
| 893.3 | TAG 52:4 |
18 | ||
| 895.3 | TAG 52:3 |
23 | ||
| 897.3 | TAG 52:2 |
24 | ||
| 919.3 | TAG 54:5 |
82 | ||
| 921.3 | TAG 54:4 |
90 | ||
| 923.3 | TAG 54:3 |
100 | ||
| 925.3 | TAG 54:2 |
36 | ||
| Rapeseed (IV) refined | 893.3 | TAG 52:4 |
32 | |
| 895.3 | TAG 52:3 |
24 | ||
| 919.3 | TAG 54:5 |
59 | ||
| 921.3 | TAG 54:4 |
79 | ||
| 923.3 | TAG 54:3 |
100 | ||
| 925.3 | TAG 54:2 |
46 | ||
| Sunflower (V) cold extraction | 601.3 | LLb | 9 | 56 |
| 603.3 | LOb | 7 | 36 | |
| 895.3 | TAG 52:3 |
32 | 18 | |
| 897.3 | TAG 52:2 |
33 | 11 | |
| 917.3 | TAG 54:6 |
82 | 38 | |
| 919.3 | TAG 54:5 |
100 | 52 | |
| 921.7 | TAG 54:4 |
72 | 47 | |
| 925.3 | TAG 54:2 |
42 | 9 | |
| Sunflower (VI) refined | 893.7 | TAG 52:4 |
34 | |
| 895.7 | TAG 52:3 |
27 | ||
| 917.7 | TAG 54:6 |
96 | ||
| 919.7 | TAG 54:5 |
100 | ||
| 921.7 | TAG 54:4 |
59 | ||
| 923.7 | TAG 54:3 |
28 | ||
FFAs (C18:0–C18:3) were seen in cold extracted olive (I), rapeseed (III) and sunflower oils (V). No FFAs were detected in refined oils, as expected, as FFAs should not be present at significant levels in refined oils. Therefore, fortified refined oil samples were used to demonstrate the quantitative abilities of the SALDI assay for determination of FFAs. Several FFAs were added to refined rapeseed oils in the concentration range from 0.5 to 2% (Table 2). The obtained response behavior was linear in the investigated range, with precision values <15%, demonstrating that, in principle, SALDI-MS could be used for FFA quantification from oil samples.
| FFA | Linearity | LOD (%) | Precision (RSD, %) | Recoverya | |||
|---|---|---|---|---|---|---|---|
| [M + K]+m/z | y = ax + b | R 2 | Added (%) | Found (%) | |||
| a Shown for 2% (w/w) addition to rapeseed oil. | |||||||
| C18:1 |
321 | y = 2083x − 64.5 | 0.997 | 0.2 | 6 | 2.0 | 1.79 ± 0.03 |
| C18:2 |
319 | y = 4452x − 95.2 | 0.998 | 0.2 | 12 | 2.0 | 1.86 ± 0.05 |
| C18:3 |
317 | y = 1652x + 89.5 | 0.992 | 0.2 | 14 | 2.0 | 1.98 ± 0.08 |
The compositions of TAG species for the various investigated oils as compared to typical levels from matrix free (LDI-TOF-MS) experiments are summarized in Table 1. As only a small number of oil samples was investigated here, no systematic comparison and interpretation of TAG distributions was attempted. Variations of TAGs as well as the simultaneous measurements of other components of the oil (e.g. phytosterols) may allow the described SALDI method to be used to detect adulterations of oil samples.48,49
Conclusions
In this study, a rapid Pd-nanoparticle assisted LDI-MS profiling approach for analysis of lipids such as fatty acids and TAGs is described that provided mass spectra of intact species without interfering ions in the low m/z range as observed in MALDI-MS. We have demonstrated that ionization in positive ionization mode led to sole formation of simple [M + K]+ species for all investigated compounds, whereas anion formation was more complex. Specifically, trimeric cluster anions were exclusively seen in the mass spectra of free fatty acids while negatively-charged TAGs decomposed upon SALDI. We attribute these clustering and degradation reactions to residual water that was embedded in the Pd-NP structures during electrolytic synthesis. Complex vegetable oils were analyzed after only minimal sample preparation in positive ion mode, readily demonstrating the proof-of-principle for application of the technique as a rapid screening tool for intact TAGs and fatty acids. In particular, Pd-NP-assisted LDI-MS exhibited great potential for analyzing intact TAG molecules in comparison to MALDI-MS, where significant decomposition of protonated TAG molecules has been observed. SALDI-MS, on the other hand, exhibited similar fragmentation reactions only to a minor extent.We believe that the methodology shown in this study is a promising technique for determining distributions of biological molecules from complex samples without requiring extensive sample preparation. Potential future applications include the profiling of metabolites in metabolomics applications.
Acknowledgements
DAV acknowledges general research support by the Alfried Krupp von Bohlen und Halbach-Stiftung. The authors are grateful to Dr Marcus Koch (Leibnitz Institute for New Materials) for help with the Raman and SEM analyses.References
- B. Fuchs, R. Süβ and J. Schiller, Prog. Lipid Res., 2010, 49, 450–475 CrossRef CAS PubMed.
- Physical and chemical characteristics of oils, fats, & waxes, ed. D. Firestone, AOCS Press, 3rd edn, 2013 Search PubMed.
- R. Aparicio and R. Aparicio-Ruíz, J. Chromatogr. A, 2000, 881, 93–104 CrossRef CAS.
- V. Baeten and M. J. Meurens, J. Agric. Food Chem., 1986, 44, 2225–2230 CrossRef.
- P. Kaufmann, Anal. Chim. Acta, 1993, 277, 467–471 CrossRef CAS.
- A. H. El-Hamdy and N. K. El-Fizga, J. Chromatogr. A, 1995, 708, 351–355 CrossRef CAS.
- D. Zabaras and M. H. Gordon, Food Chem., 2004, 84, 475–483 CrossRef CAS PubMed.
- S. E. Woodbury, R. P. Evershed, J. B. Rossell, R. E. Griffith and P. Farnell, Anal. Chem., 1995, 67, 2685–2690 CrossRef CAS.
- S. E. Woodbury, R. P. Evershed and J. B. Rossell, J. Chromatogr. A, 1998, 805, 249–257 CrossRef CAS.
- S. E. Woodbury, R. P. Evershed and J. B. Rossell, J. Am. Oil Chem. Soc., 1998, 75, 371–379 CrossRef CAS PubMed.
- K. L. Duffin, J. D. Henion and J. J. Shieh, Anal. Chem., 1991, 63, 1781–1788 CrossRef CAS.
- W. C. Byrdwell, E. A. Emken, W. E. Neff and R. O. Adlof, Lipids, 1996, 31, 919–935 CrossRef CAS.
- C. Cheng, M. L. Gross and E. Pittenauer, Anal. Chem., 1998, 70, 4417–4426 CrossRef CAS.
- G. R. Asbury, K. Al-Saad, W. F. Siems, R. M. Hannan and H. H. Hill, J. Am. Soc. Mass Spectrom., 1999, 10, 983–991 CrossRef CAS.
- F. O. Ayorinde, E. Elhilo and C. Hlongwane, Rapid Commun. Mass Spectrom., 1999, 13, 737–739 CrossRef CAS.
- F. O. Ayorinde, B. E. Eribo, K. V. Balan, J. H. Johnson and L. W. Wan, Rapid Commun. Mass Spectrom., 1999, 13, 937–942 CrossRef CAS.
- F. O. Ayorinde, Q. L. Keith and L. W. Wan, Rapid Commun. Mass Spectrom., 1999, 13, 1762–1769 CrossRef CAS.
- F. O. Ayorinde, K. Garvin and K. Saeed, Rapid Commun. Mass Spectrom., 2000, 14, 608–615 CrossRef CAS.
- C. Hlongwane, I. G. Delves, L. W. Wan and F. O. Ayorinde, Rapid Commun. Mass Spectrom., 2001, 15, 2027–2034 CrossRef CAS PubMed.
- A. Jakab, K. Nagy, K. Heberger, K. Vekey and E. Forgacs, Rapid Commun. Mass Spectrom., 2000, 16, 2291–2297 CrossRef PubMed.
- C. Robins and P. A. Limbach, Rapid Commun. Mass Spectrom., 2003, 17, 2839–2845 CrossRef CAS PubMed.
- K. A. Al-Saad, V. Zabrouskov, W. F. Siems, N. R. Knowles, R. M. Hanna and H. H. Hill, Rapid Commun. Mass Spectrom., 2003, 17, 87–96 CrossRef CAS PubMed.
- A. Kubo, T. Satoh, Y. Itoh, M. Hashimoto, J. Tamura and R. B. Cody, J. Am. Soc. Mass Spectrom., 2013, 24, 684–689 CrossRef CAS PubMed.
- S. Mariccor, A. B. Batoy, S. Borgmann, K. Flick, J. Griffith, J. J. Jones, V. Saraswathi, A. H. Hasty, P. Kaiser and C. L. Wilkins, Lipids, 2009, 44, 367–371 CrossRef PubMed.
- W. Griffiths, Mass Spectrom. Rev., 2003, 22, 81–152 CrossRef CAS PubMed.
- W. Y. Hsu, W. D. Lin, W. L. Hwu, C. C. Lai and F. J. Tsai, Anal. Chem., 2010, 82, 6814–6820 CrossRef CAS PubMed.
- W. Reindl and T. R. Northen, Anal. Chem., 2010, 82, 3751–3755 CrossRef CAS PubMed.
- M. Lu, Y. Lai, G. Chen and Z. Cai, Anal. Chem., 2011, 83, 3161–3169 CrossRef CAS PubMed.
- M. Borissova, K. Palk and M. Vaher, Procedia Chem., 2010, 2, 174–179 CrossRef CAS PubMed.
- S. Cha, Z. Song, B. J. Nikolau and E. S. Yeung, Anal. Chem., 2009, 81, 2991–3000 CrossRef CAS PubMed.
- C. D. Calvano, A. Aresta, F. Palmisano and C. G. Zambonin, Anal. Bioanal. Chem., 2007, 389, 2075–2084 CrossRef CAS PubMed.
- Y. E. Silina and D. A. Volmer, Analyst, 2013, 138, 7053–7065 RSC.
- P. Hatsis, S. Brombacher, J. Corr, P. Kovarik and D. A. Volmer, Rapid Commun. Mass Spectrom., 2003, 17, 2303–2309 CrossRef CAS PubMed.
- J. J. Kampen, P. C. Burgers, R. A. Gruters, A. D. Osterhaus, R. de Groot, T. M. Luider and D. A. Volmer, Anal. Chem., 2008, 80, 4969–4975 CrossRef PubMed.
- A. Koulman, D. Petras, V. K. Narayana, L. Wang and D. A. Volmer, Anal. Chem., 2009, 81, 7544–7551 CrossRef CAS PubMed.
- Y. E. Silina, M. Koch and D. A. Volmer, J. Mass Spectrom., 2014, 49, 468–480 CrossRef CAS PubMed.
- Y. E. Silina, F. Meier, V. A. Nebolsin, M. Koch and D. A. Volmer, J. Am. Soc. Mass Spectrom., 2014, 25, 841–850 CrossRef CAS PubMed.
- Y. E. Silina, M. Koch and D. A. Volmer, J. Mass Spectrom., 2015, 50, 578–585 CrossRef CAS PubMed.
- J. Schiller, R. Süβ, M. Petkovic and K. Arnold, J. Food Lipids, 2002, 9, 185–200 CrossRef CAS PubMed.
- W. C. Byrdwell and W. E. Neff, Rapid Commun. Mass Spectrom., 2002, 16, 300–319 CrossRef CAS PubMed.
- F. Hsu and J. Turk, J. Am. Soc. Mass Spectrom., 1999, 7, 600–612 CrossRef.
- N. Budimir, J.-C. Blais, F. Fournier and J.-C. Tabet, Rapid Commun. Mass Spectrom., 2006, 29, 680–684 CrossRef PubMed.
- N. Budimir, J.-C. Blais, F. Fournier and J.-C. Tabet, J. Mass Spectrom., 2007, 42, 42–48 CrossRef CAS PubMed.
- R. C. McAlpin, K. J. Voorhees, A. R. Corpuz and R. M. Richards, Anal. Chem., 2012, 84, 7677–7683 CrossRef PubMed.
- Y. Chen, H. Chen, A. Aleksandrov and T. M. Orlando, J. Phys. Chem. C, 2008, 112, 6953–6960 CAS.
- C. D. Calvano, F. Palmisano and C. G. Zambonin, Rapid Commun. Mass Spectrom., 2005, 19, 1315–1320 CrossRef CAS PubMed.
- J. Gidden, R. Liyanage, B. Durham and J. O. Lay, Jr, Rapid Commun. Mass Spectrom., 2007, 21, 1951–1957 CrossRef CAS PubMed.
- S. L. Abidi, J. Chromatogr. A, 2001, 935, 173–201 CrossRef CAS.
- L. Ellegard, H. Andersson and I. Bosaeus, Eur. J. Clin. Nutr., 2005, 59, 1374–1378 CrossRef CAS PubMed.
Footnote |
| † Electronic supplementary information (ESI) available. See DOI: 10.1039/c5ay00705d |
| This journal is © The Royal Society of Chemistry 2015 |