 Open Access Article
Instrumental assessment of red meat origins and their storage time using electronic sensing systems
Z.
Haddi
*a,
N.
El Barbri
b,
K.
Tahri
a,
M.
Bougrini
a,
N.
El Bari
c,
E.
Llobet
d and
B.
Bouchikhi
a
aSensor Electronic & Instrumentation Group, Moulay Ismaïl University, Faculty of Sciences, Physics Department, B.P. 11201, Zitoune, 50003 Meknes, Morocco. E-mail: haddi.zouhair@gmail.com; Fax: +212 535 53 68 08; Tel: +212 535 53 88 70
bElectronic Signals and Systems Group, Univ Hassan 1, B.P. 77, ENSA, Khouribga, Morocco
cBiotechnology Agroalimentary and Biomedical Analysis Group, Moulay Ismaïl University, Faculty of Sciences, Biology Department, B.P. 11201, Zitoune, Meknes, Morocco
dMINOS-EMaS, Electronic Engineering Department, Universitat Rovira i Virgili, Avda. Països Catalans, 26, 43007 Tarragona, Spain
First published on 11th May 2015
Abstract
Objective and rapid electronic sensing systems for distinguishing among meat species and identifying the degree of spoilage have been developed. A metal oxide sensor-based electronic nose system consisting of six sensors is designed and used to analyze the headspace emanating from beef, goat and sheep meats stored at 4 °C. A rapid, non-destructive technique based on the electronic tongue system formed by seven working electrodes is also applied and used to analyse the fingerprint of the electrochemical compounds of the three meat samples. Data analysis is performed by two pattern recognition methods: Principal Component Analysis (PCA) and Support Vector Machines (SVMs). Discrimination and classification function analyses are performed on the response of the electronic nose and electronic tongue systems to each of the three red meats. The obtained results show that the three red meats can be distinguished and the number of days spent in cold storage can be identified.
1. Introduction
In 2013, a meat scandal made headline news across Europe and even further afield. The evidence gathered did not point to a public health issue, but rather an issue of food quality and especially fraudulent labelling.1 The control of the origin of red meat is not only a major concern for the consumers but also for producers and distributors as well. It is, therefore, critical to ensure the supply of high quality and safe meat products. Furthermore, the quantitative determination of the degree of spoilage of beef, goat and sheep meats requires the development of reliable and simple tools, which would facilitate routine control assessments to be implemented. The degree of spoilage of a red meat sample is related to the number of days this sample has undergone cold storage at a given constant temperature.2 It depends also on numerous factors, and particularly on the quantity of microorganisms present in the raw sample at day zero.3,4 On the other hand, the distinction between goat and sheep meats deserves special attention due to their similar visual aspect. Consumers demand higher protection from falsely labelled meat products for a variety of economic and health reasons. In this context, important progress in the development of robust techniques for meat freshness and species identification is being made.5,6 The use of electronic noses and/or tongues for sensing the quality of food products as a means of non-destructive sensing is becoming widespread, fast and reliable.7–10 Electronic noses or tongues are inspired by the way in which mammalians recognize samples via their olfaction and taste senses.11 In these approaches, gas and liquid sensors do not have to be selective but need to respond unspecifically to a group of related chemical species. The sensors are then integrated in an array and their response is analyzed by suitable pattern recognition procedures.These electronic nose/tongue systems do not give any information about the compounds causing the aroma/flavour nor about their identity.12,13 However, with the help of appropriate mathematical techniques, like neural networks or statistical methods, the electronic nose/tongue is able to recognize the aroma/flavour pattern from a particular sample and distinguish it from other samples.14,15
The smell and taste pattern signatures obtained from the electronic nose/tongue sensors are complex and need to be analyzed using appropriate pattern recognition techniques. Pattern recognition techniques like Principal Component Analysis (PCA), Partial Least Squares (PLS), Discriminant Factor Analysis (DFA), Artificial Neural Network (ANN) and Support Vector Machines (SVMs) have been used for data analysis in electronic nose or tongue applications.16
An electronic nose has been applied for beef freshness detection,17 discrimination of chicken and pork adulteration in minced mutton,18,19 assessment of meat quality at different temperatures,20 prediction of chilled pork shelf-life,21 classification of meat spoilage markers using nanostructured ZnO thin films,22etc.23 However, meats have not been examined sufficiently by electronic tongues. Only some investigation in the literature can be found, especially for monitoring physical–chemical and microbiological changes24 and predicting NaCl, nitrate and nitrite contents.25,26 To the best of our knowledge, no studies have been performed on meat discrimination and spoilage analysis for beef, goat and sheep meats using electronic tongues. Thus, the objective of this paper is to evaluate the performance of an electronic nose and tongue system for the distinction among meats from beef, goat and sheep by developing analytical methods for acquiring aroma/taste signatures from the three types of meat samples and then to determine the number of days that meat products have undergone cold storage, which is an indirect estimation of the degree of spoilage of such products.
2. Material and methods
2.1 Electronic nose set-up
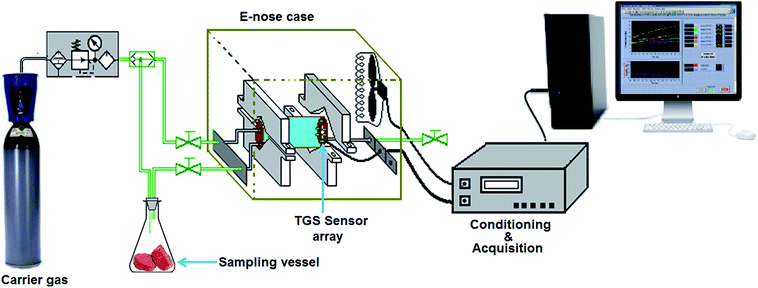
An electronic nose system has been developed to analyse the smell patterns from the headspace of meat samples. The sensor array contained 6 heated metal oxide gas sensors Figaro TGS 8XX (with XX = 23, 25, 26, 31, 32 and 82). In the literature, many studies have stated that the temperatures of the sample, sensor chamber, and sensors must be kept constant to achieve repeatable performance of the electronic nose system. This is because a modification of the environmental temperature value can induce a variation of the sensor operating temperature, modifying the sensor sensitivity and then the steady-state conductance value.27–29 As a direct cause, a temperature sensor (LM35DZ) and a relative humidity sensor (Phillips H1) were used for constantly monitoring the inner sensor chamber temperature and relative humidity. A schematic diagram of the electronic-nose measurements is shown in Fig. 1. Every TGS sensor was heated by applying 5 Volts to its heating resistor and its conductance was measured in a half-bridge configuration using 10 Volts as supply voltage (VC) according to Figaro Engineering operating data sheets for measurement of the sensor's conductance variation. The relationship between the sensor conductance and the VC is expressed by the following equation:where G is the sensor conductance, RL is the load resistance, VC is the supply voltage, and VRL is the output voltage.
The electronic nose sensor cell consists of a cylindrical chamber connected to a line of gases. The variation of the sensor's conductivity was acquired and then digitised using a data acquisition board Advantech (PCL 812PG). A sampling rate of 1 sample per s was used. A program in Labview was developed to control the data acquisition. Additionally, this program was in charge of keeping constant the temperature inside the sensor cell via the temperature sensor and some digital outputs of the data acquisition card, which actuated the heating coil or the cooling system and the fan when needed.
2.2 Electronic tongue set-up
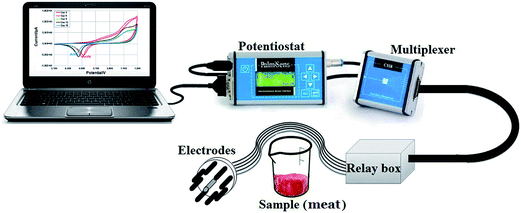
The voltammetric electronic tongue has been developed using an array of seven working electrodes, a platinum counter electrode as an auxiliary (length 5 mm, diameter 2 mm), and an Ag/AgCl reference electrode (1 M saturated KCl, diameter: 2 mm). The working electrodes, made up of platinum, gold, silver and glassy carbon (purity: 99.9%, length: 5 mm, and diameter: 2 mm), were purchased from CH Instruments, Texas, USA; and those made up of palladium, copper and nickel (purity 99.9%, length 6 mm, and diameter 1.6 mm) were purchased from BAS Inc., Tokyo, Japan. In Fig. 2, the electrodes were assembled in a stainless steel tubing. The wires from the electrodes were connected via a relay box to a portable potentiostat PalmSens (PalmSens BV, The Netherlands). The responses of the array to the samples in all experiments were measured by means of cyclic voltammetry (CV).2.3 Sample preparation
Three different types of meat species, representative of Moroccan production, were purchased from a local market and were analyzed. Immediately after getting meat from different animal species (beef, goat and sheep) with no break in the chain of refrigeration, the samples were cut into pieces of the same weights (mass of 25 g ± 1 g) without being chopped, and these were placed in plastic boxes and kept at a constant temperature of 4 ± 1 °C for up to 2 weeks. The 4 °C storage temperature is chosen to represent the typical storage temperature of meat in grocery stores.32.4 Sampling procedure
The responses of the electronic nose and tongue to the meat samples are acquired daily starting from day 3 to day 15 at an interval of 3 days (i.e., samples were measured at days 3, 6, 9, 12 and 15). At 4 °C, meat spoilage occurs at a much slower rate than that at ambient temperature.30 For this reason, we chose a 3 day sampling interval and examined spoilage over a long period of time. At each sampling time, 15 measurements are performed, which correspond to 5 sample measurements for each type of meat.2.5 Experiment methodology
The experimental procedures implemented to measure with the e-nose and e-tongue instruments are as follows.2.6 System performance evaluation and development of classification models
The performance of the designed electronic instruments is evaluated by their ability to discriminate the meat samples into three groups (beef, goat and sheep) and to identify the number of days of cold storage the different meat samples have undergone. Data processing and pattern recognition are decisive factors to obtain a versatile instrument capable of reliably recognizing a wide variety of odours/flavour.In the case of an electronic nose system, the dataset comprised the following set of features:
• G0: the initial conductance of a sensor calculated as the average value of its conductance during the first 15 minutes of a measurement.
• Gs: the steady-state conductance calculated as the average value of its conductance during the last 5 minutes of a measurement.
• dG/dt: the dynamic slope of the conductance calculated between minutes 15 and 35 of a measurement. This corresponds to a phase in which a fast increase of sensor conductance is observed.
• A: the area below the conductance curve in a time interval defined between 15 and 40 min of a measurement. This area is estimated by the trapeze method.
Three datasets were elaborated corresponding to beef, goat and sheep meat. The size for each e-nose dataset is 25 (5 sampling days × 5 replicates) × 24 (6 sensors × 4 features).
In the case of the electronic tongue system, the dataset comprised the following set of features:
• Sox: the maximum slope of the current curve in the oxidation shape.
• Srd: the maximum slope of the current curve in the reduction shape.
• ΔI = Imax − Imin: the current change calculated as the difference between maximum and minimum values of the current; Imax: the maximum value of the current measured in the final potential range and Imin: the minimal value of the current measured in the initial potential.
As there are 7 working electrodes within the array, each voltammetric measurement is described by 21 variables. Three datasets were elaborated corresponding to beef, goat and sheep meats. The size for each e-tongue dataset is 25 (5 sampling days × 5 replicates) × 21 (7 electrodes × 3 features).
The use of PCA to assess clustering within the datasets is discussed below. PCA is a powerful, linear, and ‘unsupervised’ pattern recognition technique that has been shown to be effective in the classification of electronic nose and tongue datasets.36,37 PCA decomposes the primary data matrix by projecting the multidimensional data onto a new coordinate base formed by the orthogonal directions with data maximum variance. The eigenvectors of the data matrix are called principal components (PC) and they are uncorrelated among them. The principal components are ordered so that the first one displays the greatest amount of variance, followed by the next greatest and so on.
The SVM approach was also used, as a supervised learning technique, for identification analysis. SVMs have been demonstrated to be a powerful learning method38 and their use in the fields of electronic nose and tongue is gaining more importance every day.23,39,40 SVMs were originally designed for binary classification. Currently there are two types of approaches for multiclass SVMs. One is by constructing and combining several binary classifiers “one-against-one or one-against-all methods”, while the other is by directly considering all data in one optimization formulation.
3. Results and discussion
3.1 Electronic nose response analysis
This initial analysis consists of studying the influence of the volatile gases emanating from beef, goat and sheep meat samples on the conductance of the sensors. Fig. 3 shows the response evolution of the TGS 832 and TGS 825 sensors, as an example, in the presence of the three red meat samples from day 3 to day 15.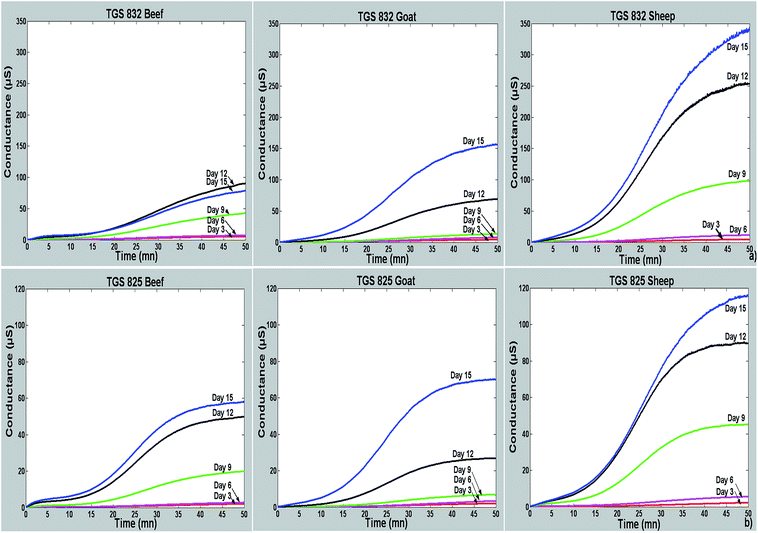 | ||
| Fig. 3 Dynamic response of two sensors to beef, goat and sheep samples: (a) TGS 832 and (b) TGS 825. | ||
A similar behaviour is observed for the two sensors. The intensities of the conductance of the two sensors increase according to exposure time. It can also be derived that the intensities of the conductance of the two sensors increase according to the number of days that meat has undergone cold storage. This behaviour, observed for the other TGS sensors, can be justified by an increase in the concentration of volatile gases given out by meat as a function of storage time, or the occurrence of new species in the headspace of meat. It can also be noticed that a saturation of the dynamic response of the sensors appears more distinctly for the last days of conservation. The results showed that the intensities of the conductance for the sensor TGS 832 change according to the type of meat samples used (sub-plots in Fig. 3(a)). For example at day 9, the maximum conductance values of TGS 832 reach 45 μS, 13 μS and 97 μS for beef, goat and sheep meat samples respectively. Similar results are shown for sensor TGS 825 (sub-plots in Fig. 3(b)). The maximum conductance values of TGS 825 at day nine were close to 20 μS, 7 μS and 45 μS for beef, goat and sheep meats, respectively.
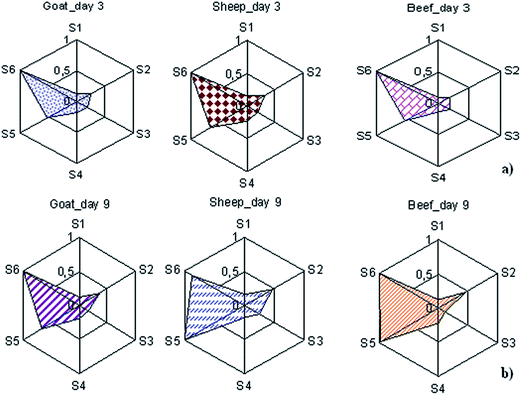
The difference that exists among the sensor responses is due to change in concentration of volatile gases emanating from each type of meat. It can be also due to the difference in nature of volatiles released from each meat product. The changes in sensor response according to the type of meat samples and the number of days the samples were kept under cold storage are clearly shown in Fig. 4. This figure shows in radar plots the evolution of the steady-state conductance of the sensor array at day 3 (Fig. 4(a)) and day 9 (Fig. 4(b)) for the three red meats. The sensor responses to three red meats are normalized. These polar plots show the differences existing among the meat samples. These radar-like plots with unitary radius were performed also in order to see whether pattern differences developed among meat samples with different storage days. It can be observed that the shape of the sensor array patterns is very different between day 3 and day 9.
3.2 Electronic tongue voltammogram analysis
The voltammetric behaviour of red meat profiles was also investigated using CV. The electrochemical response of a given object depends on the intrinsic chemical nature of both the electrode and the redox behaviour of the product itself. As an example, the voltammograms from the Au and Pd voltammetric sensors immersed in the three types of meats for the five sampling days are shown in Fig. 5.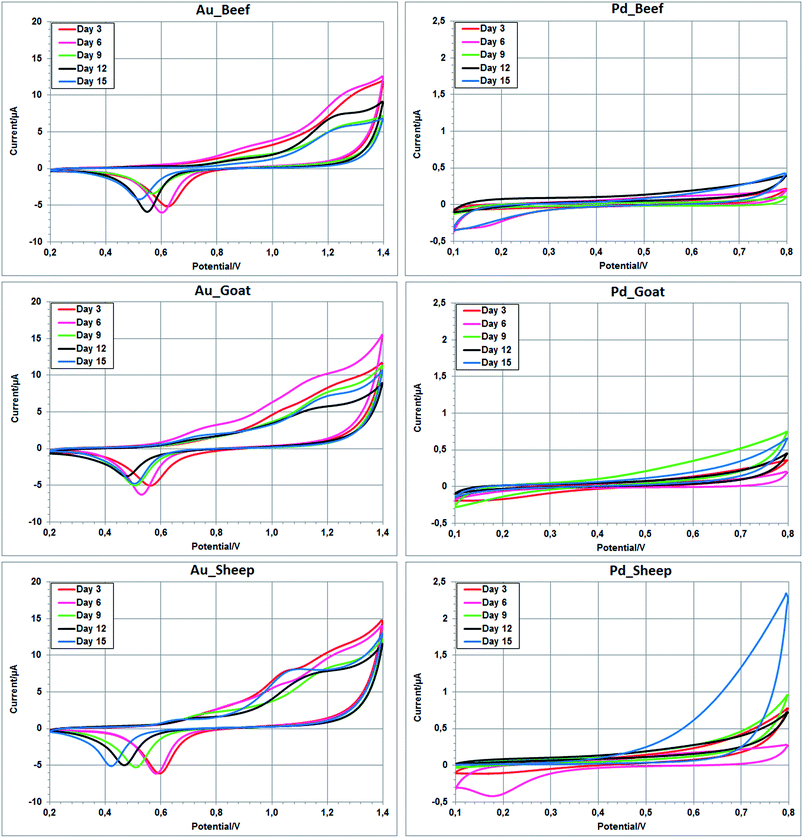 | ||
| Fig. 5 Cyclic voltammograms of Au & Pd electrodes immersed in samples of three types of red meat at the 3rd, 6th, 9th, 12th and 15th days of storage. | ||
It is observed that the voltammetric electrodes displayed different signals for each type of meat depending on the number of cold storage days it had undergone. As can be seen, different response profiles were obtained depending on the nature of the electrode employed (not only in the voltammogram shape, but also in the obtained currents). Additionally, the presence of clear and poor redox peaks reveals changes in the voltammograms and indicates that different redox species can be present in the meat matrix. For instance, in the case of the Au electrode, the shift in the reduction peak occurred toward the decreasing potentials and related to the evolution of the number of storage days of meat. Indeed, the interval variations, from day 3 to day 15, of the reduction peak were [0.638 V–0.534 V], [0.573 V–0.513 V] and [0.595 V–0.433 V] for beef, goat and sheep meats respectively. In the case of the Pd electrode, some differentiated current intensities could be seen at both extreme potentials in the oxidation and reduction zones.
The voltammograms of Ag and Ni electrodes immersed in the three types of meats for the 3rd and 9th storage days are shown in Fig. 6. A clear response variability of the three meats was observed in the voltammograms of the two sensors, as well as for the other sensors, for each storage day. This clear response variability represents a good departure point for an electronic tongue approach. Most of voltammograms obtained for the three types of meat have a similar shape. However, the associated current values differ significantly from one another. Probably, this was due to the concentration changes of the electrochemical compounds from one meat to another and/or due to the differences in the electrochemical compounds released from each meat product.41
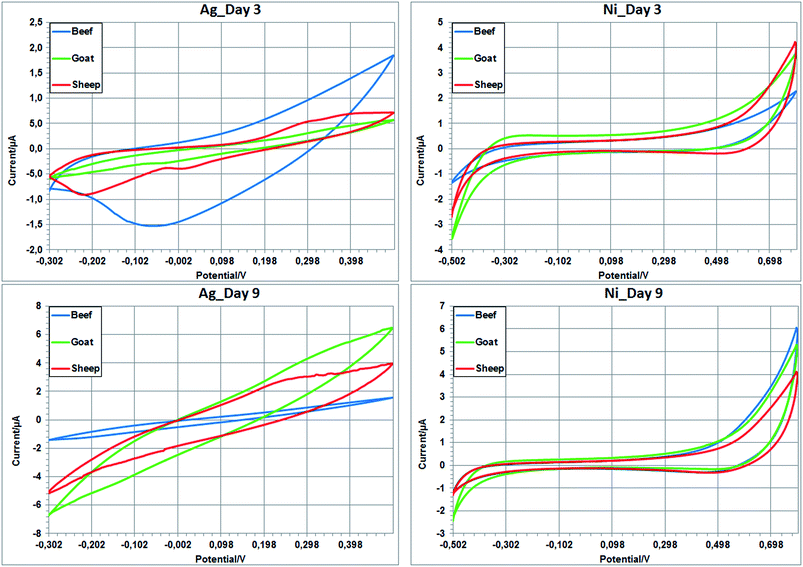 | ||
| Fig. 6 Cyclic voltammograms of Ag & Ni electrodes immersed in the three types of red meat during the 3rd and 9th days of storage. | ||
3.3 Degree of spoilage evaluation
In order to test the capability of the electronic sensing systems developed to recognise the storage day of the three red meats, we analysed all their sensor data by means of PCA.Fig. 7(a–c) report, in a three-dimensional plot (PC1–PC2–PC3), the electronic nose data obtained from the measurements corresponding to beef, goat and sheep meats respectively. Measurements were collected during a period of 15 days. It can be observed that five distinct groups, which correspond to day 3, day 6, day 9, day 12 and day 15, are fairly distinguished. We noticed that the projection of the measurements performed at day 3 is very close to that of measurements undertaken at day 6. This can be explained by meat stored at 4 °C for 3 to 6 days presenting a very similar headspace. It is also noticed that the dispersion of the samples around the barycentre for each group increases according to the storage period. This scattering can be explained by the occurrence of new volatiles in the headspace that reveal the onset of quality deterioration in meats stored at 4 °C.
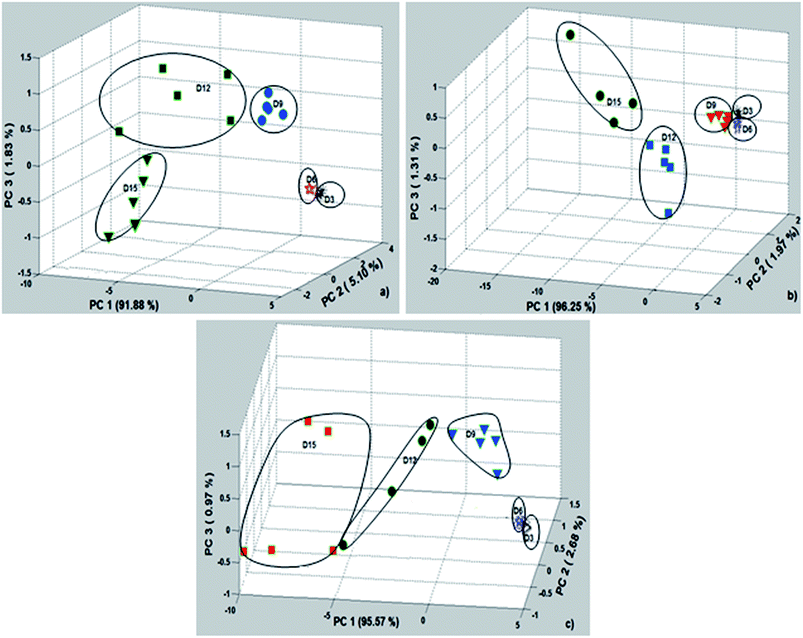 | ||
| Fig. 7 Score plot of PCA analysis for the determination of the number of storage days by an electronic nose: (a) beef; (b) goat; and (c) sheep. | ||
Fig. 8(a–c) illustrate, in a 3D space formed by the first three principal components (PC1–PC2–PC3), the projections of the electronic tongue data corresponding to beef, goat and sheep respectively. It can be seen that a perfect discrimination among all storage days has been obtained. The first three components represent 83.64%, 83.15% and 86.15% of the data variance for beef, goat and sheep meats respectively. In the electronic tongue PCA plots, the five distinct groups, corresponding to day 3, day 6, day 9, day 12 and day 15, can be easily identified. Thus, electronic tongue results seem to be very useful for recognising correctly the number of storage days a meat sample had undergone. A fortiori, the physical–chemical and microbiological changes in meats during the storage time are mainly responsible for the quality degradation,4,23,24,42 enabling thereby the recognition of storage period by the electronic nose and tongue systems. Indeed, in our previous works,4 we have shown that the electronic nose could be used as a rapid and alternative way for microbial activity prediction in red meats (i.e., through the volatile components). On the other hand, L. Gil et al.24 have already demonstrated a relatively good correlation between the response of the electronic tongue and certain degradation indices such as the pH, microbial count, K-index and nucleoside concentrations in meats.
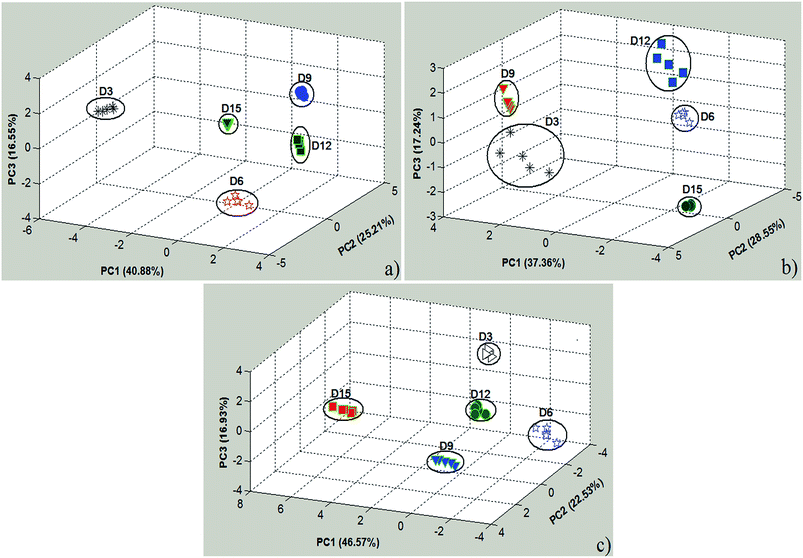 | ||
| Fig. 8 Score plot of a PCA analysis for the determination of storage days employing the electronic tongue: (a) beef; (b) goat; and (c) sheep. | ||
3.4 Rapid distinction among red meat
PCA is performed in order to provide partial visualization of the dataset in a reduced dimension and to determine the capability of the sensor array to distinguish among beef, goat and sheep meats day by day. Yet, we have chosen to represent the scores on PCA for days on which meats are still fresh. Consequently, the three red meats can be analyzed at days 3 or 6 when they present very similar headspaces.4Fig. 9 shows the projection of the electronic nose dataset related to beef, goat and sheep meat measurements on a two-dimensional plane PC1–PC2. The first two components can be used to represent 93.56% of the data variance related to the sixth storage day. Although a notable scattering was observed around the meat group barycentre, a clear discrimination of the three clusters can be obtained. The obtained findings indicated that it is possible to distinguish between goat and sheep meats, which is not obvious to the human eye, unlike between beef and goat meats or beef and sheep meats.
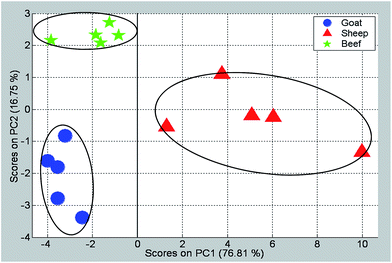 | ||
| Fig. 9 Two-dimensional PCA plot performed on the three types of meat at day six gathered using the TGS sensor array. | ||
A similar analysis was conducted on an electronic tongue dataset. Fig. 10 shows the score plot in the PC1–PC2 plane for the data of beef, goat and sheep meats. The first two components can be used to represent 86.46% of the data variance. These plots show a high discrimination of the three groups. PC1 seemed to discriminate mostly beef from goat and sheep meats. In the vertical direction (PC2), there was an evident distinction between goat and sheep meats.
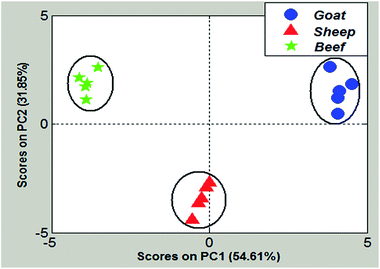 | ||
| Fig. 10 Two-dimensional PCA plot performed on the three types of meats at day six gathered using the voltammetric sensor array. | ||
3.5 SVM for identifying the number of storage days and the type of red meat
In order to classify meat samples into the three classes and to determine the five storage days for each red meat, a supervised pattern recognition method is applied. A SVM multiclass one-against-one has been trained. The second polynomial Kernel function is used to project the training data to a space that maximises the margin hyperplane.First, we have applied the SVM model on electronic nose and tongue datasets in order to check the performance of such a classifier at estimating meat freshness over a long period of storage (15 storage days). Due to the relatively small number of measurements available, the leave-one-out cross-validation method was implemented to better estimate the true success rate that could be reached with the SVMs. This assumes that, with the given n measurements, the model was trained n times using n − 1 training vectors. The vector left out during the training phase was then used for the test. The performance of the given model was estimated as the average performance over n tests. High success rates in the determination of the number of storage days undergone by meat samples were obtained with the SVM classifier. When the electronic nose system was used, the success rates were 96% for goat meat and 92% for beef and sheep meats. When the electronic tongue system was used, a 100% success rate was achieved for the three types of meats.
In the second step, the identification of the type of meat was attempted employing either the electronic nose or tongue. A SVM classifier was built and validated for every day on which measurements had been taken, i.e. 5 SVM models were built for classifying meats sampled at days 3, 6, 9, 12 and 15, respectively. Once more, a leave one out cross-validation process was employed. Table 1 summarizes the classification success rates obtained with SVMs. For instance, at day 3 or 12, all meat samples were perfectly identified (success rate reached 100%) when using the electronic nose or the electronic tongue. While the electronic tongue is always able to correctly identify red meats, regardless of the particular day in which meat samples were measured, this is not the case of the electronic nose. This can be attributed to the complex nature of the spectrum of volatiles released by red meat along the cold storage process.
| Meats | e-nose | e-tongue |
|---|---|---|
| G–S–B | G–S–B | |
| Day 3 | 100 | 100 |
| Day 6 | 93.33 | 100 |
| Day 9 | 93.33 | 100 |
| Day 12 | 100 | 100 |
| Day 15 | 86.67 | 100 |
| Days 3–15 | 81.33 | 100 |
Another classification analysis was performed on the three types of meats, but this time no information about the date of measurement was used. In fact, this is the most probable situation, because, usually in a butcher shop or supermarket, it is unclear how much time the meat has spent on the shelf. A new SVM classifier model was trained and validated on a dataset that contained 75 measurements (5 samples × 5 storage days × 3 types of meats). The obtained classification results were also very promising: 81.33% success rate for the electronic nose and 100% for the electronic tongue. Once again, the voltammetric electronic tongue (in direct contact with the meat matrix) is proven to be more suited than the electronic nose (relying on volatiles found in the headspace of meat) to identify the type of meat along the cold storage process. Finally, we have attempted to classify the storage time with no information about the meat origin. Table 2a and b show the confusion matrix of the SVM classifier for electronic nose (94.67%) and tongue (100%) respectively. These findings indicate that only 4 meat samples, among 75, were misclassified by the electronic nose and all storage days were perfectly identified by the electronic tongue independent of the type of meat.
| Actual | Predicted | ||||
|---|---|---|---|---|---|
| Day 3 | Day 6 | Day 9 | Day 12 | Day 15 | |
| (a) | |||||
| Day 3 | 15 | ||||
| Day 6 | 15 | ||||
| Day 9 | 14 | 1 | |||
| Day 12 | 14 | 1 | |||
| Day 15 | 2 | 13 | |||
![[thin space (1/6-em)]](https://www.rsc.org/images/entities/char_2009.gif) |
|||||
| (b) | |||||
| Day 3 | 15 | ||||
| Day 6 | 15 | ||||
| Day 9 | 15 | ||||
| Day 12 | 15 | ||||
| Day 15 | 15 | ||||
It is worth noting that since the leave-one-out cross-validation method may provide over-optimistic results, it is better to test other cross-validation techniques that would yield a good generalization of the studied situations.
4. Conclusions
Two electronic sensing systems were home-fabricated for rapid screening of meat species. The electronic nose and voltammetric electronic tongue have been successful in not only discriminating red meats coming from different animal origins, but also in identifying the number of cold storage days meat samples had undergone.The results showed that PCA analysis of electronic nose data cannot differentiate correctly between the 3rd and 6th day of storage of beef, goat and sheep meats. On the other hand, PCA analysis of electronic tongue data showed a good separation between storage days for the three types of meats. Additionally, a perfect discrimination among beef, goat and sheep meats has been obtained by using a SVM classifier trained and validated on electronic tongue data. It is important to stress that a 100% success rate was obtained for the discrimination among beef, goat and sheep meats at day 6 (fresh meat) either using the electronic nose or the electronic tongue system. Finally, the voltammetric electronic tongue has succeeded in the recognition of meat origin with no information about its number of storage days, and also in the identification of storage time independent of the meat origin. Future work involves further validation of these findings on larger datasets including horse, pork, poultry meats and their mixtures for good consumer protection and fraudulent labelling detection.
References
- M. Stoyke, F. Hamann, W. Radeck and P. Gowik, J. Verbraucherschutz Lebensmittelsicherh., 2013, 8, 91 CrossRef.
- Y. Blixt and E. Borch, Int. J. Food Microbiol., 1999, 46, 123 CrossRef CAS.
- S. Panigrahi, S. Balasubramanian, H. Gu, C. Logue and M. Marchello, LWT--Food Sci. Technol., 2006, 39, 135 CrossRef CAS PubMed.
- N. El Barbri, E. Llobet, N. El Bari, X. Correig and B. Bouchikhi, Sensors, 2008, 8, 142 CrossRef CAS PubMed.
- H. Li, Q. Chen, J. Zhao and Q. Ouyang, Anal. Methods, 2014, 6, 6271 RSC.
- F. Han, X. Huang, E. Teye, F. Gu and H. Gu, Anal. Methods, 2014, 6, 529 RSC.
- L. Lvova, R. Pudi, P. Galloni, V. Lippolis, C. Di Natale, I. Lundström and R. Paolesse, Sens. Actuators, B, 2015, 207, 1076 CrossRef CAS PubMed.
- M. Cole, I. Spulber and J. W. Gardner, Sens. Actuators, B, 2015, 207, 1147 CrossRef CAS PubMed.
- L. A. Dias, A. M. Peres, A. C. A. Veloso, F. S. Reis, M. Vilas-Boas and A. A. S. C. Machado, Sens. Actuators, B, 2009, 136, 209 CrossRef CAS PubMed.
- Z. Haddi, H. Alami, N. El Bari, M. Tounsi, H. Barhoumi, A. Maaref, N. Jaffrezic-Renault and B. Bouchikhi, Food Res. Int., 2013, 54, 1488 CrossRef CAS PubMed.
- L. Gil-Sánchez, J. Soto, R. Martínez-Mánez, E. Garcia-Breijo, J. Ibánez and E. Llobet, Sens. Actuators, A, 2011, 171, 152 CrossRef PubMed.
- G. Pacioni, L. Cerretani, G. Procida and A. Cichelli, Food Chem., 2014, 146, 30 CrossRef CAS PubMed.
- S. Yang, S. Xie, M. Xu, C. Zhang, N. Wu, J. Yang, L. Zhang, D. Zhang, Y. Jiang and C. Wu, Anal. Methods, 2015, 7, 943 RSC.
- M. Ghasemi-Varnamkhasti, S. Saeid Mohtasebi, M. Siadat and S. Balasubramanian, Meat Quality Assessment by Electronic Nose (Machine Olfaction Technology), Sensors, 2009, 9, 6058 CrossRef CAS PubMed.
- Z. Haddi, S. Mabrouk, M. Bougrini, K. Tahri, K. Sghaier, H. Barhoumi, N. El Bari, A. Maaref, N. Jaffrezic-Renault and B. Bouchikhi, Food Chem., 2014, 150, 246 CrossRef CAS PubMed.
- X. Hong and J. Wang, Anal. Methods, 2014, 6, 3133 RSC.
- X. Z. Hong, Z. B. Wei, Z. Hai and J. Wang, Mod. Food Sci. Technol., 2014, 30, 279 Search PubMed.
- X. J. Tian, J. Wang and S. Q. Cui, Mod. Food Sci. Technol., 2013, 29, 2997 Search PubMed.
- X. J. Tian, J. Wang and S. Q. Cui, J. Food Eng., 2013, 119, 744 CrossRef CAS PubMed.
- O. S. Papadopoulou, C. C. Tassou, L. Schiavo, G. E. Nychas and E. Z. Panagou, Procedia Food Sci., 2011, 1, 2003 CrossRef PubMed.
- X. Tang, X. Sun, V. C. H. Wu, J. Xie, Y. Pan, Y. Zhao and P. K. Malakar, Food Control, 2013, 32, 334 CrossRef PubMed.
- M. Lingkvist, S. Coradeschi, A. Loutfi and J. B. Rayappan, Sensors, 2013, 13, 1578 CrossRef PubMed.
- O. S. Papadopoulou, E. Z. Panagou, F. R. Mohareb and G. E. Nychas, Food Res. Int., 2013, 50, 241 CrossRef PubMed.
- L. Gil, J. M. Barat, D. Baigts, R. Martínez-Máñez, J. Soto, E. Garcia-Breijo, M.-C. Aristoy, F. Toldrá and E. Llobet, Food Chem., 2011, 126, 1261 CrossRef CAS PubMed.
- R. H. Labrador, R. Masot, M. Alcañiz, D. Baigts, J. Soto, R. Martínez-Mañez, E. García-Breijo, L. Gil and J. M. Barat, Food Chem., 2010, 122, 864 CrossRef CAS PubMed.
- I. Campos, R. Masot, M. Alcañiz, L. Gil, J. Soto, J. L. Vivancos, E. García-Breijo, R. H. Labrador, J. M. Barat and R. Martínez-Mañez, Sens. Actuators, B, 2010, 149, 71 CrossRef CAS PubMed.
- H. T. Nagle, R. Gutierrez-Osuna, B. G. Kermani and S. S. Schiffman, Handbook of Machine Olfaction: Electronic Nose Technology, Environmental Monitoring, ch. 17, 2002, pp. 419 Search PubMed.
- C. Delpha, M. Siadat and M. Lumbreras, Sens. Actuators, B, 2000, 69, 243 CrossRef CAS.
- J. W. Gardner and P. N. Bartlett, Electronic Noses: principles and applications, Oxford University Press, Oxford, UK, 1999, ch. 8 Search PubMed.
- D. D. H. Boothe and J. W. Arnold, J. Sci. Food Agric., 2002, 82, 315 CrossRef CAS PubMed.
- Z. Haddi, A. Amari, H. Alami, N. El Bari, E. Llobet and B. Bouchikhi, Sens. Actuators, B, 2011, 155, 456 CrossRef CAS PubMed.
- X. Cetó, A. M. O' Mahony, J. Wang and M. del Valle, Talanta, 2013, 107, 270 CrossRef PubMed.
- Z. Haddi, S. Mabrouk, M. Bougrini, K. Tahri, K. Sghaier, H. Barhoumi, N. El Bari, A. Maaref, N. Jaffrezic-Renault and B. Bouchikhi, Food Chem., 2014, 150, 246 CrossRef CAS PubMed.
- J. M. Gutiérrez, Z. Haddi, A. Amari, B. Bouchikhi, X. Cetó, A. Mimendia and M. del Valle, Sens. Actuators, B, 2013, 177, 989 CrossRef PubMed.
- M. Palit, B. Tudu, N. Bhattacharyya, A. Dutta, P. K. Dutta, A. Jana, R. Bandyopadhyay and A. Chatterjee, Anal. Chim. Acta, 2010, 675, 8 CrossRef CAS PubMed.
- M. O. Salles, G. N. Meloni, W. R. de Araujo and T. R. L. C. Paixão, Anal. Methods, 2014, 6, 2047 RSC.
- M. Jańczyk, A. Kutyła, K. Sollohub, H. Wosicka, K. Cal and P. Ciosek, Bioelectrochemistry, 2010, 80, 94 CrossRef PubMed.
- V. Vapnik, Statistical Learning Theory, Wiley, New York, 1998 Search PubMed.
- B. Ehret, K. Safenreiter, F. Lorenz and I. Biermann, Sens. Actuators, B, 2011, 158, 75 CrossRef CAS PubMed.
- M. Bougrini, K. Tahri, Z. Haddi, T. Saidi, N. El Bari and B. Bouchikhi, J. Sens., 2014, 2014, 245831 Search PubMed.
- C. Hung, H. Ho, C. Chang, M. Lee, C. A. Franje, S. Kuo, R. Lee and C. Chou, Food Chem., 2011, 126, 1417 CrossRef CAS PubMed.
- Y. Salinas, J. V. Ros-Lis, J. Vivancos, R. Martínez-Máñez, M. D. Marcos, S. Aucejo, N. Herranz, I. Lorente and E. Garcia, Food Control, 2014, 35, 166 CrossRef PubMed.
| This journal is © The Royal Society of Chemistry 2015 |


