 Open Access Article
Creative Commons Attribution 3.0 Unported Licence
iPRECON: an integrated preconcentrator for the enrichment of volatile organics in exhaled breath†
Vjekoslav
Kokoric
,
Andreas
Wilk
and
Boris
Mizaikoff
*
Institute of Analytical and Bioanalytical Chemistry, University of Ulm, Albert-Einstein-Allee 11, 89081 Ulm, Germany. Web: http://www.uni-ulm.de/iabcE-mail: boris.mizaikoff@uni-ulm.de; Fax: +49-731-50-22763; Tel: +49-731-5022750
First published on 20th March 2015
Abstract
In this study, a new generation of integrated preconcentrators particularly suited for exhaled breath gas analysis is described. The developed analyzer system comprises a compact preconcentrator (iPRECON) exemplarily tested for sampling isoprene, which readily couples to substrate-integrated hollow waveguides (iHWGs) of the same footprint serving simultaneously as highly miniaturized gas cell and photon conduit in combination with a compact infrared spectrometer.
Exhaled breath gas analysis is a strategy of increasing importance in medical diagnostics for early disease detection and therapy progress monitoring.1 Because of its non-invasiveness and ease of sampling, new sensing methods continuously emerge. Evidently, the rather minute concentrations (i.e., low ppm to ppt levels) of volatile organic constituents (VOCs) appearing in the exhaled breath matrix pose a challenge to many sensing techniques, and in particular to mid-infrared (MIR; 2–20 μm) absorption spectroscopic techniques. This is especially true whenever an application requires the usage of a rather compact (e.g., hand-held) sensor, thereby limiting the useful absorption path length.2
Here, we take advantage of preconcentration as one possible solution to enhance the analytical signal without extending the absorption path length.3–5 Specifically, isoprene – a widely recognized marker for cholesterol metabolism disorders6–10 – was previously detected via substrate-integrated hollow waveguide (iHWG) based IR-spectroscopy after enrichment within an appropriate adsorbent material, and subsequent thermal desorption into the detection system. iHWGs are a new generation of hollow waveguides, which are suitable for simultaneous use as a waveguide, and as a highly miniaturized gas cell.11,12 Hence, iHWGs are highly attractive alternatives for conventional multi-pass gas cells in spectroscopic gas sensing applications that require rapid sample transient times, minute sample volumes, and a small device footprint.13–15
The concentration of isoprene in exhaled human breath is usually too low for direct detection via MIR absorption spectroscopy. According to Fenske et al.,16 the highest concentrations for endogenous constituents in exhaled breath are reported for isoprene (12–580 ppb), ethanol (13–1000 ppb), methanol (160–2000 ppb), and acetone (1.2–1800 ppb); other alcohols just appear at very low parts per billion (ppb) concentrations. Therefore, a reproducible enrichment step prior to the analysis is frequently required, and in particular for selectively enhancing the isoprene signal.17,18 During preliminary studies testing various preconcentration concepts, our research group has readily demonstrated the potential determination of isoprene in human breath using a cylindrical tube packed with an adsorbent serving as preconcentrator. Thus obtained results revealed that the detection of isoprene by mid-infrared spectroscopy is indeed feasible, if an appropriate preconcentration step is included.5 However, this setup required elaborate transfer of the desorbed sample into the iHWG, was neither compact nor integrated or automated, and did not allow for an integrated heating solution (i.e., using heating tape wrapped around the cylindrical preconcentrator). Consequently, next-generation preconcentrator devices should provide improved temperature control during the desorption process, automated valve operation, and optimized cooling. In addition, the device should ideally match the footprint of the iHWG for future integration of active transducer and preconcentrator. Hence, a channel structure containing the sorbent material was integrated into a substrate with dimensions of 75 × 50 mm (i.e., similar to the iHWG), and closed off with a lid plate. Last but not least, this design enables rapid and facile packing/exchange of any kind of sorbent material within the channel.
In the present study, isoprene was selected as an exemplary yet relevant volatile organic constituent, which is frequently determined in exhaled human breath. Given the flexibility of the device, different adsorbent materials suitable for the enrichment of other biomarkers16,19,20 in human breath may readily pack into the structure.
Fig. 1 shows a 3D rendered model of the main components of the preconcentrator. The device is milled from a 60 × 90 × 10 mm aluminum block. Aluminum provides excellent thermal conductivity of approximately 237 W m−1 K−1, a low density of 2.7 g cm−3, and the ability to resist corrosion, which are essential properties for a preconcentrator. Besides the low density, which facilitates a lightweight construction, aluminum also resists mechanical stress. Furthermore, iHWG structures are currently predominantly fabricated from aluminium, thus providing matching materials for future stacking/integration of the devices.
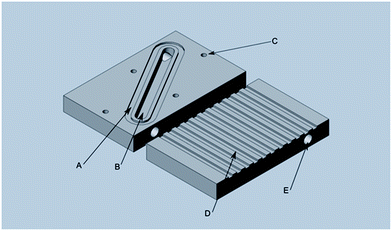 | ||
| Fig. 1 Top part of the preconcentrator: (A) O-ring channel, (B) sorbent channel, (C) mount threads, (D) cooling structures, (E) Luer-Lock connector threads. | ||
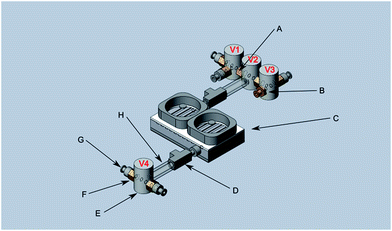
The arrows in Fig. 1 indicate the sections where the material was actually processed. (A) provides a groove structure for housing an O-ring (50 mm diameter), thereby sealing the preconcentrator against the bottom plate. (B) shows the channel structure that may be packed with any kind of sorbent material (here, Dowex Optipore L493, Sigma-Aldrich Chemie GmbH, Taufkirchen b. M., Germany). (C) are threaded holes for mounting the bottom plate. (D) indicates the cooling structure facilitating heat dissipation, currently manufactured with a width of 3 mm and a depth of 1 mm per fin. Two commercially available CPU fans were mounted on the top of the device enabling rapid and controlled cooling of the preconcentrator. Via the threaded holes (E), Luer-Lock connectors were mounted on both sides to connect the preconcentrator with computer-controlled three-way-valves (T161PK031, NResearch Inc., West Caldwell, USA) (Fig. 2 (E)).
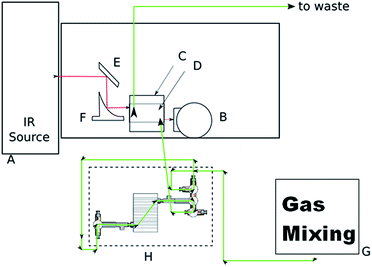
The entire experimental setup – iPRECON plus iHWG coupled to a FT-IR spectrometer – is schematically shown in Fig. 3 comprising (A) a Bruker IRcube FT-IR spectrometer (Bruker Optics Inc., Ettlingen, Germany), (B) a liquid nitrogen cooled mercury–cadmium–telluride (MCT) detector (Infrared Associates, USA), (C and D) an iHWG as previously developed by our research team,3 (E and F) gold-coated mirrors (Thorlabs, USA), (G) a gas mixing system, and (H) the iPRECON. The green line indicates the direction of the gas flow initiated by the gas mixing system (GMS; developed in collaboration with LLNL-Lawrence Livermore National Laboratory, Livermore, USA), i.e., the path of the carrier gas (N2) and sample during a measurement. Different possible pathways of the gas flow for e.g., measuring, sampling, purging, etc. are shown in the ESI.† Red lines illustrate the optical path, i.e., propagation of the IR radiation.
Emitted IR radiation from the FT-IR spectrometer (A) was first reflected by a planar gold-coated mirror (E) onto a gold-coated off-axis parabolic mirror (OAPM) (F), and then focused into the iHWG (D). The radiation propagated through the iHWG (D), which simultaneously served as a miniaturized gas cell and as a hollow waveguide. IR radiation emanating at the distal end of the iHWG was then focused onto a MCT detector (B). Via the gas inlet and outlet ports of the iHWG, the optical system was connected to the iPRECON system (H).
A certified gas standard of isoprene (nominal concentration: 100 ppm in N2; vendor: Westfalen AG, Weiβenhorn, Germany) was diluted with nitrogen to a minimum concentration of 1 ppm using a custom-made mass flow-controlled gas mixing unit prototype developed in collaboration with Lawrence Livermore National Laboratory (LLNL; Livermore/CA, USA), and fed into the iPRECON.
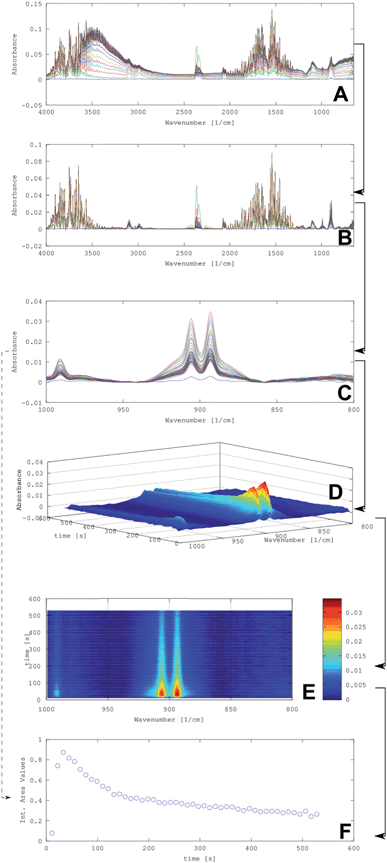
Fig. 4 provides an overview on the data generation and data processing routines for evaluating isoprene concentrations in exhaled breath extracted from the obtained IR spectra after preconcentration and desorption. Using an example (i.e., isoprene concentration of 10 ppm), the data processing routine from the obtained raw IR spectra (A) to the integrated peak values (F) are illustrated.
In (A), the raw data of 50 individual spectra collected from one isoprene sample are shown in a stacked representation. Evidently, a baseline drift is noticeable, especially in the spectral region around 3500 cm−1, which results from water absorptions. Hence, in a first step the baseline was corrected resulting in the processed spectra shown in (B). The correction was performed via a Matlab script developed for this purpose. This algorithm estimates the baseline of the raw spectrum via asymmetric least squares smoothing of the raw and a virtual baseline.21 After subtraction of the virtual (i.e., calculated) baseline from the raw spectrum, the corrected spectrum is achieved. In a next step, the spectral region of interest was selected from (B); here, the isoprene absorption region from 800–1000 cm−1 corresponding to the bending vibrations of isoprene with maxima at 895 and 905 cm−122,23 to confine the spectral region of interest (C). Next, information on the isoprene concentration was extracted from each spectrum using a previously established isoprene calibration function (C).
Based on the relevant spectral region shown in (C), information on the concentration, i.e., the integrated isoprene peak values using 870 and 940 cm−1 as integration boundaries were obtained (illustrated by the dotted line from (C–F)). Hence, every point in (F) is a result of the integration of one spectrum in (C). After this operation, a time-dependent concentration profile of the isoprene desorption into the iHWG may be extracted.
Alternatively, the dependence of the isoprene concentration on the desorption kinetics were obtained by visualizing the evolvement of the isoprene IR signature as a 3D plot (D). The 3D plot (D), which was produced by using the software package Octave, illustrates the change of absorption vs. time. Alternatively, absorption vs. time may be represented as a contour plot (E) providing the same information.
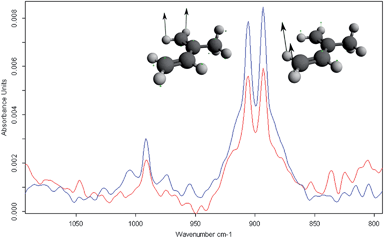
Fig. 5 illustrates the comparison of preconcentrated isoprene sample with a concentration of 1 ppm vs. a sample containing 100 ppm of isoprene that was not preconcentrated, i.e., directly analysed using the iHWG in the spectral region from 800–1000 cm−1. The results for isoprene quantification using the iPRECON are summarized in Table 1 including the limit of detection (LOD), the limit of quantification (LOQ) and the achievable preconcentration factor (PCF). To estimate the LOD/LOQ, samples without analyte were measured to calculate the standard deviation of the blanks. According to Long et al.24, the LOD is defined as three times the standard deviation of the blank and the LOQ as ten times the standard deviation, respectively. All obtained figures-of-merit compare favourably to previously obtained results.7
| Analytical parameters | iPRECON |
|---|---|
| Slope of the calibration | 0.083 cm-1 ppm-1 |
| R 2 | 0.999 |
| LOD | 260 ppb |
| LOQ | 867 ppb |
| Preconcentration factor (PCF) | > 50 |
| Heating time (s) | 250 |
| Cooling time (s) | 500 |
Using the iPRECON, a LOD for isoprene of 260 ppb and a LOQ of 867 ppb was determined. Compared to the system without preconcentration, a preconcentration factor of at least 50 was derived.
Conclusions
In the present study, we demonstrated a new generation of miniaturized preconcentrators that are suitable for enriching volatile organic constituents relevant e.g., in exhaled breath gas analysis. While the obtained results for the exemplary analyte isoprene are comparable to previously published results using conventional preconcentration strategies, the iPRECON offers several distinct advantages in terms of automation, user friendliness, reproducibility, compactness, and robustness. In addition, the iPRECON readily combines with the iHWG previously developed by our research team, thus offering an integrated solution for advanced mid-infrared gas sensing devices applicable not only in biodiagnostics, but also in environmental monitoring, atmospheric studies, security/surveillance applications, and process analysis.Acknowledgements
The Machine Shop at University of Ulm is thanked for support during prototype development of iHWG and iPRECON. This work was performed in part under the auspices of the U.S. Department of Energy by Lawrence Livermore National Laboratory (LLNL) under Contract DE-AC52-07NA27344. This project was funded under LLNL sub-contract nos B603018 and B607114.Notes and references
- F. M. Musteata, TrAC, Trends Anal. Chem., 2013, 45, 154–168 CrossRef CAS PubMed.
- P. Jouy, M. Mangold, B. Tuzson, L. Emmenegger, Y.-C. Chang, L. Hvozdara, H. P. Herzig, P. Wägli, A. Homsy, N. F. de Rooij, A. Wirthmueller, D. Hofstetter, H. Looser and J. Faist, Analyst, 2014, 139, 2039–2046 RSC.
- M. R. Ras, F. Borrull and R. M. Marcé, TrAC, Trends Anal. Chem., 2009, 28, 347–361 CrossRef CAS PubMed.
- G. Konvalina and H. Haick, Acc. Chem. Res., 2014, 47, 66–76 CrossRef CAS PubMed.
- D. Perez-Guaita, V. Kokoric, A. Wilk, S. Garrigues and B. Mizaikoff, J. Breath Res., 2014, 8, 026003 CrossRef PubMed.
- T. Karl, P. Prazeller, D. Mayr, A. Jordan, J. Rieder, R. Fall and W. Lindinger, J. Appl. Physiol., 2001, 91, 762–770 CAS.
- B. G. Stone, T. J. Besse, W. C. Duane, C. D. Evans and E. G. DeMaster, Lipids, 1993, 28, 705–708 CrossRef CAS.
- A. Cailleux and P. Allain, Life Sci., 1989, 44, 1877–1880 CrossRef CAS.
- T. P. Korman, B. Sahachartsiri, D. Li, J. M. Vinokur, D. Eisenberg and J. U. Bowie, Protein Sci., 2014, 23, 576–585 CrossRef CAS PubMed.
- C. Hornuss, A. Zagler, M. E. Dolch, D. Wiepcke, S. Praun, A.-L. Boulesteix, F. Weis, C. C. Apfel and G. Schelling, J. Breath Res., 2012, 6, 046004 CrossRef PubMed.
- A. Wilk, J. C. Carter, M. Chrisp, A. M. Manuel, P. Mirkarimi, J. B. Alameda and B. Mizaikoff, Anal. Chem., 2013, 85, 11205–11210 CrossRef CAS PubMed.
- J. C. Carter, M. P. Chrisp, A. M. Manuel, B. Mizaikoff, A. Wilk and S.-S. Kim, Substrate-integrated hollow waveguide sensors, U.S. Patent Application No. 13/631,936, September 29, (71), 2012.
- J. da Silveira Petruci, P. R. Fortes, V. Kokoric, A. Wilk, I. M. Raimundo, A. A. Cardoso and B. Mizaikoff, Analyst, 2014, 139, 198–203 RSC.
- A. Wilk, F. Seichter, S.-S. Kim, E. Tütüncü, B. Mizaikoff, J. A. Vogt, U. Wachter and P. Radermacher, Anal. Bioanal. Chem., 2012, 402, 397–404 CrossRef CAS PubMed.
- C. R. Young, N. Menegazzo, A. E. Riley, C. H. Brons, F. P. DiSanzo, J. L. Givens, J. L. Martin, M. M. Disko and B. Mizaikoff, Anal. Chem., 2011, 83, 6141–6147 CrossRef CAS PubMed.
- J. D. Fenske and S. E. Paulson, J. Air Waste Manage. Assoc., 1999, 49, 594–598 CAS.
- S.-I. Ohira, J. Li, W. a. Lonneman, P. K. Dasgupta and K. Toda, Anal. Chem., 2007, 79, 2641–2649 CrossRef CAS PubMed.
- C. Grote and J. Pawliszyn, Anal. Chem., 1997, 69, 587–596 CrossRef CAS.
- B. Buszewski, J. Rudnicka, T. Ligor, M. Walczak, T. Jezierski and A. Amann, TrAC, Trends Anal. Chem., 2012, 38, 1–12 CrossRef CAS PubMed.
- J. Dummer, M. Storer, M. Swanney, M. McEwan, A. Scott-Thomas, S. Bhandari, S. Chambers, R. Dweik and M. Epton, TrAC, Trends Anal. Chem., 2011, 30, 960–967 CrossRef CAS PubMed.
- P. Eilers and H. Boelens, Leiden, Baseline Correction with Asymmetric Least Squares Smoothing, 2005, http://zanran_storage.s3.amazonaws.com/www.science.uva.nl/ContentPages/443199618.pdf.
- F. Kühnemann, M. Wolfertz, S. Arnold, M. Lagemann, A. Popp, G. Schüler, A. Jux and W. Boland, Appl. Phys. B: Lasers Opt., 2002, 75, 397–403 CrossRef.
- M. Traetteberg, G. Paulen, S. J. Cyvin, Y. N. Panchenko and V. I. Mochalov, J. Mol. Struct., 1984, 116, 141–151 CrossRef CAS.
- G. L. Long and J. D. Winefordner, Anal. Chem., 1983, 55, 712A–724A CrossRef CAS.
Footnote |
| † Electronic supplementary information (ESI) available. See DOI: 10.1039/c5ay00399g |
| This journal is © The Royal Society of Chemistry 2015 |

