 Open Access Article
Creative Commons Attribution 3.0 Unported Licence
Comparison and statistical evaluation of neutron activation methodologies for the determination of gold in copper concentrate
P. S. Remya
Devi
,
A. A.
Dalvi
,
K. K.
Swain
and
R.
Verma
*
Analytical Chemistry Division, Bhabha Atomic Research Centre, Trombay, Mumbai 400085, India. E-mail: rverma@barc.gov.in; Fax: +91-22-25505151; Tel: +91-22-25595087
First published on 30th March 2015
Abstract
Gold was determined in copper concentrate by an instrumental neutron activation analysis technique using the relative method. The determination was repeated by radiochemical and chemical neutron activation analysis with the aid of an anion exchange strategy for the chemical separation of gold from the matrix (Fe, Cu, and Zn). Irradiation of copper concentrate samples was carried out in APSARA reactor (BARC, India) with a thermal neutron flux of about 1012 cm−2 s−1. Analysis of variance established that the results obtained by instrumental, radiochemical and chemical methodologies were statistically indistinguishable. Among the three approaches, radiochemical activation showed superior detection limits, which was attributed to both the reduction in background and increase in sensitivity. The best measurement repeatability was observed in chemical activation methodology, compared to the other two. The rationale behind the improvement in measurement repeatability was the capability of chemical activation to process a larger mass of sample for each replicate, which resulted in improved counting statistics and reduction in sampling error with respect to gold. Combined uncertainty for all the three methodologies was evaluated through the bottom-up approach. Systematic evaluation of various uncertainty parameters showed that the major contributor to the combined standard uncertainty was the counting statistics during the instrumental approach and the chemical separation yield during radiochemical and chemical activation. The combined uncertainty for all the three approaches was less than the measurement repeatability indicating the inhomogeneous distribution of gold in copper concentrate. Calculations showed that the sampling constant for gold in copper concentrate was about 22 g.
Introduction
Copper occurs as oxides, carbonates or sulfides in nature and sulfide ores are the most common.1 The copper ore is crushed and ground before it is concentrated to have a copper concentration between 20 and 40%. High grade copper sulfide ores are concentrated using the froth flotation process and the dried froth is known as copper concentrate. Copper concentrates are the raw materials for copper smelters and are used to produce high purity metals. They are composed of approximately equal parts of copper, iron and sulfur by mass. Besides these elements, they generally contain precious metals like gold (Au) in the range of 0.01 to 200 mg kg−1. Determination of Au in copper concentrate is essential from the recovery point of view.Methods for the determination of noble metals have been reviewed by Beamish and Van Loon.2 Natural levels of noble metals are in the region of limits of detection for most of the current analytical techniques.3 In order to achieve an interference-free determination at trace levels, it is necessary to separate and/or pre-concentrate noble metals. The most common method for determination of noble metals in geological samples is atomic absorption spectrometry with a fire assay pre-concentration step. The fire assay technique requires special facilities, equipment and a highly skilled analyst. Also, this technique is unsuitable for sulphide minerals.4 Cyanidation is not a feasible separation route, since it is non-specific and most of the metal cyanides, including that of copper, are highly toxic.5 Ion exchange methods have been extensively used for the separation of Au from different matrices.6–9 Neutron-activation analysis is one of the most sensitive techniques for determination of noble elements.10–14 Instrumental neutron activation analysis (INAA) has been successfully applied for the determination of noble elements in ores. However, it is necessary to separate noble metals from the matrix, for determination at a low level. Chemical separation of analytes from the matrix can be carried out either before or after irradiation. Radiochemical neutron activation analysis (RNAA) involves chemical separation of the analyte (radionuclide) from the matrix, after neutron irradiation. When pre-irradiation chemical separations are employed, the procedure is known as chemical neutron activation analysis (CNAA).15 As the matrix is removed prior to irradiation, larger quantities of samples can be processed in CNAA, leading to preconcentration of the analyte. CNAA methodology has the additional incentive of minimal radiation exposure compared to RNAA, since the matrix separation is carried out prior to irradiation. The gamma ray spectra in RNAA and CNAA are simpler than those of INAA, owing to the removal of matrix activity. The reagent blank correction is not required in RNAA, as the separation is carried out after irradiation.
The reliability of the results can be ensured by adopting quality control measures in each step of the quantification procedure. Any analytical result is complete only if it is accompanied by a statement of uncertainty in the measurement.16 Measurement uncertainties can be estimated using statistical analysis (Type A evaluation) of a set of measurements or by using the existing/available information (Type B evaluation) about the measurement process.17,18 For evaluating the uncertainty associated with the complete measurement process, either the bottom-up or the top-bottom approach can be adopted.19 Uncertainty evaluation helps identifying the chief sources of uncertainty, which can be easily visualized from the bar diagram representation, showing the fractional contribution from each source. Once the major contributors are identified, the analyst can pay attention to the key step and attempt to improve the quality of the results.
In the present work, Au was determined in copper concentrate by the INAA technique. The determination was repeated using RNAA and CNAA techniques and the results were compared. Detection limits for all the three methodologies were estimated and compared. The bottom-up approach of uncertainty evaluation was adopted for deriving the combined uncertainty of all the three methodologies. Various uncertainty sources of the measurement process were identified and estimated systematically. Measurement repeatability was compared with the combined uncertainty, in order to test for the heterogeneity of Au in copper concentrate. Statistical evaluation of the results is discussed.
Materials and methods
All reagents used were of analytical grade. Polyethylene sheets and glassware were cleaned with dilute nitric acid and deionized water. Analytical grade anion exchange resin Dowex 1X8 (50–100 mesh), Biorad Laboratories, USA was used for ion-exchange separation.The energy dispersive X-ray fluorescence (EDXRF) spectrum of copper concentrate was acquired using a Jordan Valley EX3600M spectrometer, having a stabilized low power (50 watt) X-ray tube and a Rh-target for excitation.
Instrumental neutron activation analysis
Gold standard solution (100 mg L−1) was prepared by dissolving high purity Au wire in aqua-regia. Accurately weighed (150–200 mg) copper concentrate samples were heat-sealed in polyethylene. 50 μL of the Au standard solution was evaporated on filter paper placed on clean polyethylene, heat-sealed, and was used as the comparator. The dimensions of the sample and comparator were identical. The samples, comparator and blank (polyethylene) were triply-sealed in another polyethylene packet to make it waterproof. Irradiation was carried out for 7 hours at the F7 position (thermal neutron flux ∼1012 cm−2 s−1) in APSARA, a swimming pool type nuclear reactor, BARC, Trombay, Mumbai, India.Gamma ray spectrometric measurements were carried out using a High Purity Germanium (HPGe) detector, Eurisys Mesures, France (Relative efficiency: 45%, resolution: 1.95 keV at 1332 keV gamma ray of 60Co), coupled to an 8k channel analyzer. Counting geometries for the blank, comparator and samples were identical during gamma ray measurements.
Radiochemical neutron activation analysis
Sample preparation and irradiation conditions were identical to those described in the preceding section (instrumental neutron activation analysis). Irradiated copper concentrate samples (∼150–200 mg each) were transferred to polytetrafluoroethylene (PTFE) beakers; small volumes of HF and HNO3 were added and heated on a sand bath. During digestion of the samples, small volumes of HF and HNO3 were added repeatedly for complete decomposition. After dissolution, solutions were evaporated to dryness; residues were dissolved in a minimum volume of concentrated HCl and evaporated to dryness on a water bath. Treatment with HCl was repeated. Finally the residues were added to 25 mL of 1 M HCl (clear green solution). Approximately 200 mg of Dowex 1X8 resin (pre-equilibrated with 1 M HCl and air-dried) was added to the sample solution and agitated on a mechanical shaker for 2 hours. The resin beads were filtered, washed with 0.1 M HCl, air-dried and heat sealed using polyethylene. Gamma ray spectrometric measurements of resin beads (loaded with gold) were carried out using a HPGe detector as described previously (instrumental neutron activation analysis).Determination of chemical yield for the anion exchange separation of gold
Standard solution containing 25 μg of Au was evaporated on clean polyethylene, heat-sealed and was irradiated in the F7 position of an APSARA reactor for 7 hours. After irradiation, the polyethylene packet was opened, treated with concentrated HCl–HNO3 mixture, made up to 10 mL in 1 M HCl and used as radiotracer solution.About 500 mg of accurately weighed copper concentrate sample was taken in a PTFE beaker. The radiotracer solution of Au (250 μL) was added, the sample was decomposed with HF and HNO3 and ion exchange separation was carried out as described previously (radiochemical neutron activation analysis). The resin beads were filtered and washed with 0.1 M HCl. Filtrate and washings (25 mL) were collected in a clean flask. Gold reference solution was prepared by adding 250 μL of Au-radiotracer to 25 mL of deionized water. Gamma ray measurements of the filtrate and reference solution were carried out in identical geometry using a HPGe detector and count rates for 411.8 keV gamma rays of 198Au were compared. The chemical yield for the anion exchange separation of Au was calculated using eqn (1).
 | (1) |
Chemical neutron activation analysis
About 500 mg of accurately weighed copper concentrate sample was taken in a PTFE beaker. The sample was decomposed with a HF–HNO3 mixture and ion exchange separation was carried out as described previously (radiochemical neutron activation analysis). Resin beads were filtered, washed with 0.1 M HCl, air dried and heat sealed using polyethylene. The gold comparator was prepared by drying the standard solution on filter paper having dimensions identical with polyethylene packets containing Au-loaded resin beads. The sample (Au-loaded resin) along with the comparator and blank (resin beads in polyethylene) was irradiated and radioactive assay was carried out as described previously (instrumental neutron activation analysis).Calculation of concentration of Au in copper concentrate
The relative (comparator) method of NAA was used for calculating the concentration of Au. The mass of Au (msam) in the copper concentrate sample was obtained using eqn (2). | (2) |
 | (3) |
Results and discussion
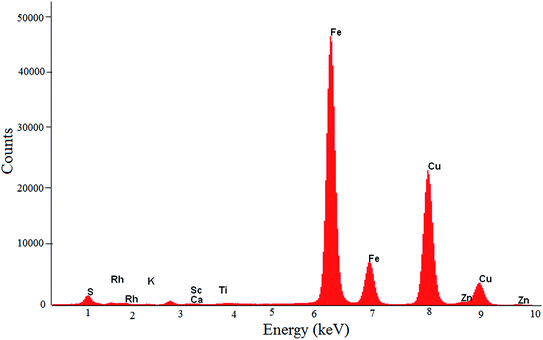
The EDXRF spectrum of the copper concentrate sample (Fig. 1) showed that Cu, Fe and S were the major constituents and Zn, Pb, Ti, Mo, Si, Sr and Ca were the minor constituents. The peak corresponding to the X-ray energy of Au (LIIIMV: 9.7 keV) was not visible in the EDXRF spectrum, due to the low concentration of Au as well as the absorption of characteristic X-rays of Au by the matrix (Cu K-edge = 8.9 keV).20The nuclear reaction 197Au(n,γ)198Au was used for the determination of Au during NAA, and the relevant nuclear parameters are given in Table 1.21 During INAA, since the activity due to the matrix (64Cu) was high, both the sample and comparator were counted at an appropriate distance from the detector to keep the dead time below 5%. As a result, the observed count rate of 198Au reduced significantly. An alternative option was to cool/decay the samples for about 7 days, in order to bring down the activity of the matrix (64Cu, t1/2 = 12.70 h) to a sufficiently low level. However, cooling would have resulted in the reduction of 198Au activity (t1/2 = 64.67 h) also. These practical difficulties resulted in an inferior count rate (198Au) and hence the poor detection limit.
| Reaction | Cross-section (b) | Half-life | Energy (keV) | γ-ray abundance (%) |
|---|---|---|---|---|
| 197Au(n,γ)198Au | 98.65 ± 0.09 | 64.67 h | 411.8 | 99 |
| 63Cu(n,γ)64Cu | 4.5 ± 0.1 | 12.70 h | 1345.7 | 100 |
| 58Fe(n,γ)59Fe | 1.32 ± 0.03 | 44.49 d | 1099.2 | 54 |
| 1291.6 | 43 |
NAA, in principle, is a non-destructive analysis technique. However, when elements having a high neutron absorption cross-section are the major/minor constituents, whose activation products have appreciable half lives, gamma rays from the matrix complicate the measurements by contributing to the background and dead time of the counting system. These may lead to inferior detection limits. In such cases, it is essential to remove the matrix by resorting to chemical methods (RNAA and CNAA).
The most important factor to be considered during RNAA and CNAA is the yield of the separation process, as no process has 100% efficiency. The chemical yield of a separation process is determined in order to correct for the possible losses of the analyte.22 The radiotracer method is an efficient and convenient tool for the determination of the chemical separation yield for various metal ions.23
Ion exchange procedures have been reported for the separation of noble elements prior to NAA.3,9 Noble elements form anionic complexes with moderate molarities of HCl, which are readily retained on an anion exchanger. The distribution coefficient (kd) for Au, Cu and Fe for the anion exchanger from HCl solution has been reported by Kraus and Nelson.24 The distribution coefficient for Au(III) is of the order of 104 at lower acidities (<3 M HCl) and decreases with increasing acid concentration. Cu(II) is not sorbed below 2 M HCl whereas the distribution coefficient for Fe(III) is negligible below 1 M HCl. Therefore anion exchange separation of Au from Cu and Fe was carried out using 1 M HCl during RNAA and CNAA. The ion exchange separation yield for Au from copper concentrate was found to be 98.6 ± 1.1% (n = 5) using the radiotracer 198Au.
The cardinal effects of radiochemical separations are improved counting statistics and reduced interference.22 Greenberg,25 Kucera and Zeisler26 have reported the importance of radiochemical separations in improving the accuracy, uncertainty and detection limits of NAA. The detection limit depends on the irradiation, decay and counting conditions. It also depends on the interference situation including the ambient background, the Compton continuum from high energy gamma rays, as well as any gamma ray interference from such factors as the blank from pre-irradiation treatment and packing materials.23
In RNAA and CNAA, due to the reduction in count rates (matrix activity), samples could be counted closer to the detector. In addition, the post-irradiation cooling step was not required in RNAA and CNAA which was necessary during INAA, for reducing the dead time of the counting system. The higher count rates for the analyte obtained in RNAA and CNAA were due to improved counting geometries as well as the obviation of the decay time.
The results obtained by all the three NAA methodologies are in good agreement (Table 2). Values obtained for Au during RNAA and CNAA were corrected for the chemical yield.
| Method | Au concentrationa | Standard deviation (n = 5) | Combined uncertainty | Expanded uncertainty (k = 2) | (LOD × 103) |
|---|---|---|---|---|---|
| a All the experimental results are rounded off according to ASTM E29-13 (ref. 40) as well as the report on precision.41 | |||||
| INAA | 19 | 2.4 | 0.16 | 0.32 | 85 |
| RNAA | 19 | 2.9 | 0.19 | 0.38 | 5 |
| CNAA | 18.0 | 1.2 | 0.20 | 0.40 | 10 |
Analysis of variance of the results
Analysis of variance (ANOVA) was carried out to test the statistical parity of the Au values obtained by INAA, RNAA and CNAA methodologies. Results of ANOVA are tabulated in Table 3. The experimentally derived F-ratio (F(2,12),experimental = 0.94) was less than the critical F-ratio (F(2,12),critical = 3.89),27 which established the statistical equality of the results obtained by all the three methodologies.| Method | Au (mg kg−1) | F (2,12),exptal | F (2,12),critical 27 | |||||||
|---|---|---|---|---|---|---|---|---|---|---|
| Value 1 | Value 2 | Value 3 | Value 4 | Value 5 | Averagea | Standard deviation | Grand mean | |||
| a The results are rounded off, following the guidelines given by ASTM E29-13 (ref. 40) as well as the report on precision.41 | ||||||||||
| INAA | 19.15 | 22.03 | 19.32 | 18.95 | 15.31 | 19 | 2.4 | 19 | 0.94 | 3.89 |
| RNAA | 16.74 | 19.33 | 23.35 | 21.16 | 16.78 | 19 | 2.9 | |||
| CNAA | 16.95 | 16.98 | 19.83 | 17.67 | 18.37 | 18.0 | 1.2 | |||
Measurement repeatability of the results
It is evident from Table 2 that the measurement repeatability for INAA and RNAA is inferior compared to that of CNAA. Generally, the measurement repeatability in activation analysis is governed by both the counting statistics and sample homogeneity characteristics. Since the count rates (198Au) were sufficiently high for samples and standards, during all the three methodologies, the inhomogeneous distribution of Au in the copper concentrate matrix could be the key rationale for the inferior repeatability in INAA and RNAA. The better measurement repeatability in the case of CNAA could be due to the higher sample mass.Limit of detection
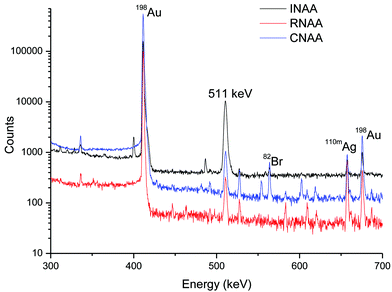
The limit of detection (LOD) was calculated as recommended by IUPAC and ACS and approximating normal distribution for counting statistics.28,29Table 2 shows the calculated detection limits for INAA, RNAA and CNAA. Among all the three methodologies, RNAA showed a superior detection limit, which was the combined outcome of the reduction in the background (matrix activity) and improved sensitivity (higher net counts due to better counting geometry). The detection limit of CNAA was slightly inferior to that of RNAA because of higher background (due to less cooling time compared to RNAA and 82Br from the resin matrix). The detection limit was poor in the case of INAA because of high background (matrix activity) and low sensitivity (source to detector distance was large to keep the dead time of the counting system low).For qualitative comparison, gamma ray spectra recorded during INAA, RNAA and CNAA methodologies are shown in Fig. 2. The counting geometry and counting time in all the three cases were the same whereas the cooling time was different. It is vivid from Fig. 2 that the background is minimal in the region of interest (around 411.8 keV) in RNAA, compared to the other two.
Evaluation of the combined and expanded uncertainties
The most important characteristic of a result obtained from any measurement is its uncertainty. However, most of the analytical results are accompanied by an indication of repeatability alone. ISO/IEC recommends that the laboratories should express measurement uncertainty.16 The first step in the uncertainty evaluation of an analytical system30 is the identification of all probable sources. Further, one should quantify the contribution from each source to the combined uncertainty, followed by the proper combination of standard uncertainties.INAA is a primary method with well known sources of uncertainties.31,32 Although there are large number of parameters involved in activation analysis, the use of the relative method results in cancellation of nearly all parameters, except the spectral peak area and mass of the standard (eqn (2)). The major source of uncertainty in all the methodologies of NAA is the counting statistics along with the chemical yield determination in the cases of RNAA and CNAA.33
The relevant sources of uncertainty in the present NAA determination of Au could be identified as (i) the determination of mass of the sample and standard (ii) gamma ray spectrometric measurements, and are shown in the cause and effect diagram (Fig. 3). The uncertainty associated with weighing and volumetric operations was evaluated as described in the Eurachem/CITAC Guide.34 The contributors to the combined uncertainty during gamma spectrometry could be identified as the counting statistics, counting geometry and dead time. Effects of counting geometry on the measurement uncertainty were brought down to negligible levels, by matching the dimensions of the sample and comparator and maintaining an identical distance from the detector in each set of measurement. The dead time was minimized (<5%) by optimizing the counting geometries in each analysis.
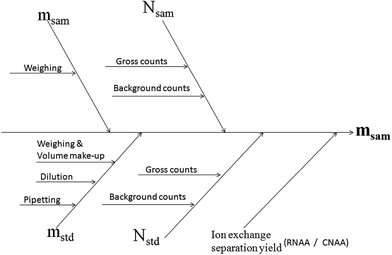 | ||
| Fig. 3 Cause and effect diagram for the uncertainty budget in the NAA determination of Au in copper concentrate. | ||
Combined standard uncertainty for RNAA and CNAA was derived by propagating the standard uncertainty from each source, using eqn (4), based on the standard method of error propagation.34
 | (4) |
 | (5) |
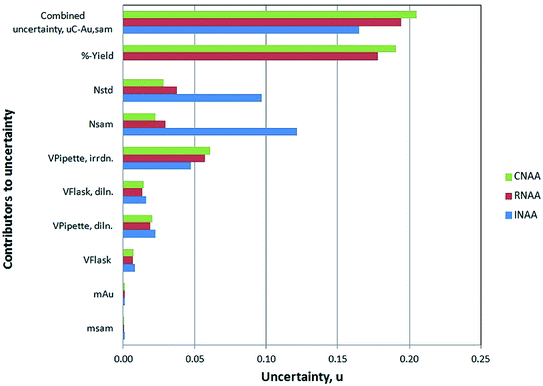
The contributions from individual components towards the combined uncertainty of the complete measurement process were evaluated via the bottom-up approach and the results are depicted in Fig. 4. It is vivid from Fig. 4 that the major share in combined uncertainty in both RNAA and CNAA determinations arises from the chemical yield determination of the ion exchange separation process of Au from the matrix, whereas in INAA it comes up from the counting statistics. The expanded uncertainties were calculated at 95% confidence level.
In order to have a quick selection among the three methodologies for determination of Au in the copper concentrate sample, the sample mass has been plotted against the Au concentration as shown in Fig. 5. The plot has been prepared considering (i) uncertainty in the measurement; (ii) dead time of the HPGe detector (≤10%); (iii) maximum expected concentration of Au in copper concentrate (6%); (iv) maximum sample mass for irradiation; (v) resin size (0.2 g), limit of quantitation and sample mass. It is important to note that this diagram is valid for given experimental conditions which include neutron flux in the irradiation position, efficiency of the HPGe detector and homogeneity of the copper concentrate sample.
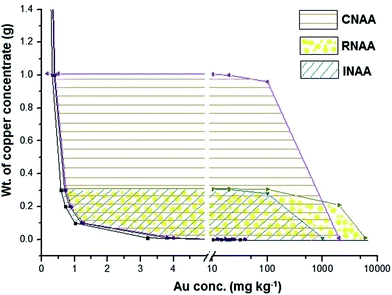 | ||
| Fig. 5 Plot of sample mass vs. Au concentration showing areas suitable for the determination of gold in copper concentrate using INAA, CNAA and RNAA. | ||
The measurement repeatability (precision) and the combined uncertainties of INAA, RNAA and CNAA methodologies are given in Table 2. It is instructive to compare measurement repeatability with uncertainty obtained from Type A evaluation.34 If the measurement repeatability is higher than the uncertainty from Type A evaluation, it could indicate that either the measurement process is not fully understood or there is a significant error in sub-sampling (indicative of the degree of heterogeneity). The total variance, S2 as determined from a set of replicate samples of approximately equal mass, is composed of the variance of the analytical system, Sa2 and the sampling variance from the heterogeneity, Ss2, as given by eqn (6).
| S2 = Sa2 + Ss2 | (6) |
Taking measurement repeatability as S2 and combined uncertainty as Sa2, the sampling variance can be calculated using eqn (7). Ingamells35 introduced a term “sampling constant”, Ks (in unit of mass)
| Ks = Ss2 × w | (7) |
Quantitative estimation of the sampling error is carried out by repetitive determination of analytes in the solid (sample) using an analytical technique having high precision.36 The analytical uncertainty should be well understood and sufficiently small. The NAA method is precise, accurate and meets the above mentioned criteria.31 An accurate measurement in activation analysis is the one whose result is indistinguishable from the true value within the interval set by counting statistics. Gold was determined in the Au-film standard by INAA using a conventional counting system and standard procedure to obtain accuracy comparable to counting statistics i.e., well below 1%.37 The INAA technique was used to assess whether the observed variability was due to the analytical system alone, or sampling error also.38
Calculations showed that the sampling constant, Ks, was ∼22 g for Au in copper concentrate in the present NAA determinations. It is interesting to note that the sampling constant was the highest for Au among all the elements in IAEA-396.36 Kontas also has reported a sample mass of 30 g as the representative analytical portion for determination of Au in ore reference materials.39 The representativeness of the analytical portion (laboratory subsample) is debatable, especially in the case of rocks and minerals36 and more so in the case of gold ores or gold bearing concentrate. Typically, gold occurs as native grains in these materials and it is very difficult to homogenize such samples. Improvement in the precision of Au values on increasing the sample mass has been reported in the literature.39
The combined uncertainties for INAA, RNAA and CNAA methodologies were practically identical, as shown in Table 2. The smaller combined uncertainties, compared to measurement repeatability, were indicative of the in-homogeneous distribution of Au in the copper concentrate sample.
Conclusion
Gold was determined in copper concentrate by INAA, RNAA and CNAA methodologies using the relative method. The results obtained by all the three methodologies were in very good agreement. The statistical indistinguishability of the results was evidenced by ANOVA. INAA methodology can be used for determination of gold in copper concentrate as it is simple to perform, even though the turn-around time is high. The detection limits are significantly lower in the case of RNAA and CNAA compared to INAA and are more suitable for determination of gold at a very low level provided that the uncertainty permits. The observed better measurement repeatability of CNAA was due to the large sample mass and improved counting geometry (higher count rate). RNAA stands first in terms of the detection limit, which was the combined outcome of the reduction in the background, increase in the sensitivity and the inherent freedom from the reagent blank. Step-wise, systematic uncertainty budgeting could throw light upon the chief component towards the combined uncertainty. It was the counting statistics in the case of the instrumental approach and the chemical separation yield for the radiochemical and chemical activation analysis methodologies. NAA could be used for establishing the heterogeneity of Au in copper concentrate samples, as the combined uncertainty was smaller than the measurement repeatability.Acknowledgements
The authors are thankful to Shri Ashish K. Singha Deb (51st batch OCES chemistry trainee, BARC), who contributed significantly during his training school project work. The authors also thank the operating staff of the APSARA reactor for support during irradiation and Head, Analytical Chemistry Division for the constant encouragement and valuable suggestions.Notes and references
- http://environmentalchemistry.com/yogi/periodic/Cu.html, accessed 17 October 2014.
- F. E. Beamish and J. C. Van Loon, Recent Advances in the Analytical Chemistry of the Noble Metals, Pergamon Press, Oxford, 1972 Search PubMed.
- IAEA TECDOC 1443, Nuclear Analyitcal Methods for Platinum Group Elements, IAEA, Vienna, 2005.
- E. L. Hoffman, J. R. Clark and J. R. Yeager, Explor. Min. Geol., 1998, 7(1–2), 155–160 CAS.
- R. Al-Merey, Z. Hariri and A. J. Hilal, Microchem. J., 2003, 75(3), 169–177 CrossRef CAS.
- O. M. Petropulu and P. Schramel, Mikrochim. Acta, 1995, 119, 265–267 CrossRef.
- I. Jarvis, M. M. Totland and K. E. Jarvis, Analyst, 1997, 122, 19–26 RSC.
- A. Tunceli and A. R. Turker, Analyst, 1997, 122, 239–242 RSC.
- S. Kumar, R. Verma and S. Gangadharan, Analyst, 1993, 118, 1085–1087 RSC.
- I. Ahmad, S. Ahmad and D. F. C. Morris, Analyst, 1977, 102, 17–24 RSC.
- B. Torres, E. Montoya, P. Mendoza, P. Bedregal, M. Ubillús and P. Olivera, J. Radioanal. Nucl. Chem., 2003, 257(3), 597–601 CrossRef CAS.
- S. Kayasth and S. Gangadharan, J. Radioanal. Nucl. Chem., 1994, 181(2), 425–431 CrossRef CAS.
- K. K. Swain, A. Nicy, R. Acharya, R. Verma and A. V. R. Reddy, J. Radioanal. Nucl. Chem., 2012, 294(2), 319–322 CrossRef CAS.
- E. Damsgaard and K. Heydorn, Risϕ Rep., 1976, 326, 24 Search PubMed.
- A. J. Blotcky, J. P. Claassen, F. R. Roman, E. P. Rack and S. Badakhsh, Anal. Chem., 1992, 64(23), 2910–2913 CrossRef CAS PubMed.
- ISO/IEC 17025, General requirements for the competence of testing and calibration laboratories, 2nd edn, 2005.
- http://physics.nist.gov/cuu/Uncertainty/basic.html, dated 22 December 2014.
- K. Birch, Measurement Good Practice Guide no. 36, Addison-Wesley Publishing Company, Inc, London, 2003, ISSN 1368–6550 Search PubMed.
- http://www.measurementuncertainty.org, accessed 22 December 2014.
- http://www.kayelaby.npl.co.uk/atomic%20and%20nuclear%20physics/4%202/4%2021.html, accessed 17 October 2014.
- http://www.nds.iaea.org/relnsd/vcharthtml/vchartHTML.html, accessed 17 October 2014.
- K. Heydorn, Aspects of Precision and Accuracy in Neutron Activation Analysis, Riso National Laboratory, DK-4000 Roskilde, Denmark, 1980, vol. 69, p. 87 Search PubMed.
- IAEA TECDOC 1215, Use of research reactors for neutron activation analysis, IAEA, Vienna, 2001.
- K. A. Kraus and F. Nelson, Proc Intern Conf on the Peaceful Uses of Atomic Energy, United Nations, New York, 1955, vol. P/837, pp. 113–125 Search PubMed.
- R. R. Greenberg, J. Radioanal. Nucl. Chem., 2008, 278(2), 231–240 CrossRef CAS.
- J. Kucera and R. Zeisler, J. Radioanal. Nucl. Chem., 2004, 262(1), 255–260 CrossRef CAS.
- http://www.sussex.ac.uk/Users/grahamh/RM1web/F-ratio%20table"%20M1web/F-ratio%20table%20202005.pdf, accessed 17 October 2014.
- IUPAC, Spectrochim. Acta, Part B, 1978, 33(6), 241–245 CrossRef.
- ACS committee on environmental improvement, Anal. Chem., 1980, 52(14), 2242–2249 CrossRef.
- Analytical Methods Committee, Analyst, 1987, 112, 199–204 RSC.
- P. Bode, E. A. Nadai and R. R. Greenberg, J. Radioanal. Nucl. Chem., 2000, 245, 109–114 CrossRef CAS.
- R. R. Greenberg, P. Bode and E. A. Nadai, Spectrochim. Acta, Part B, 2011, 66, 210–217 CrossRef.
- IAEA TECDOC 1401, Quantifying uncertainty in nuclear analytical measurements, IAEA, Vienna, 2004.
- S. L. R. Ellison and A. Williams, Quantifying Uncertainty in Analytical Measurements, Eurachem/CITAC Guide CG 4, QUAM, 3rd edn, 2012 Search PubMed.
- C. O. Ingamells and P. Switzer, Talanta, 1973, 20, 547–568 CrossRef CAS PubMed.
- IAEA TECDOC 1295, Reference materials for microanalytical nuclear techniques, IAEA, Vienna, 2002.
- R. M. Lindstrom, S. H. Harrison and J. M. Harris, J. Appl. Phys., 1978, 49, 5903–5908 CrossRef CAS.
- G. D. Agostino, L. Bergamaschi, L. Giordani, M. Oddone, H. Kipphardt and S. Richter, Metrologia, 2014, 51, 48–53 CrossRef.
- E. Kontas, Geol. Surv. Finl., Rep. Invest., 1993, 114, 39–41 CAS.
- ASTM E 29–13, Standard Practice for using Significant Digits in test data to determine conformance with specifications, ASTM International, USA, 2013.
- M. Thompson, Anal. Methods, 2012, 4, 1598–1611 RSC.
| This journal is © The Royal Society of Chemistry 2015 |

