
 Open Access Article
 This Open Access Article is licensed under a
 Creative Commons Attribution 3.0 Unported Licence
Non-polar modifier assisted analysis of aromatic compounds by means of planar differential ion mobility spectrometry with a 63Ni ionization source†
Andriy
Kuklya
*a,
Florian
Uteschil
a,
Klaus
Kerpen
a,
Robert
Marks
a and
Ursula
Telgheder
ab
aDepartment of Instrumental Analytical Chemistry, University of Duisburg-Essen (UDE), Universitätsstraße 5, 45141 Essen, Germany. E-mail: andriy.kuklya@uni-due.de; Fax: +49 201 183 6773; Tel: +49 201 183 6786
bIWW Water Centre, Moritzstr. 26, 45476 Mülheim a.d. Ruhr, Germany
First published on 20th January 2015
Abstract
In this paper we demonstrate that the choice of an appropriate non-polar modifier which can provide sufficient chemical interactions with the target analytes may lead to the improvement of the selectivity and sensitivity of differential ion mobility spectrometric (DMS) methods. The influence of the aromatic modifier (benzene) on the DMS sensitivity and separation ability was proven using examples of five aromatic compounds (toluene, ethylbenzene, p-xylene, 1,2,4-trimethylbenzene (TMB), and naphthalene). These compounds can provide the π–π interaction with the chosen modifier. The influence of the modifier concentration on the compensation voltage, peak area, and peak width was investigated and discussed. The peak capacity for the mixture of toluene, ethylbenzene, p-xylene, TMB, and naphthalene was increased by about four times when the concentration of the benzene in the carrier gas was 0.09%. The strong influence of the proton affinity of analytes on the peak area in the measurements with a modifier was demonstrated. The peak area of the compounds with low proton affinity (toluene, ethylbenzene) significantly decreases with the increase of the aromatic modifier concentration. However, the peak area of the compounds with high proton affinity was significantly increased when benzene was added to the carrier gas. When the concentration of benzene in the carrier gas was 0.4% the peak area of naphthalene was more than tripled and the peak area of TMB was almost doubled. The increase of the peak area in the DMS equipped with a 63Ni-ionization source was explained by the improved ion transport within the DMS filter region. This differs from the DMS equipped with the APPI-source, which demonstrates increased signal intensities in the presence of aromatic dopants due to the increased ionization efficiency of analytes. Despite the higher response of the DMS in the presence of an aromatic modifier, the limits of detection for calibrations without a modifier and with 0.015% of benzene are within the same range (14.2–99.9 and 10.6–89.5 ng L−1, for the calibration without and with the modifier, respectively). This originates mainly from a higher background signal caused by benzene and a benzene dimer.
1. Introduction
The development of new analytical methods for the analysis of aromatic compounds is an important issue. The continuously increasing production and use of fossil fuels result in considerably increased contamination of water resources, particularly groundwater and aquifers. The contamination of aquifers and groundwater by fuels is an environmental issue of major concern worldwide and may lead to the risk of drinking water supply contamination.1,2Due to the leakage of oil tanks and pipelines the groundwater is contaminated by petroleum products such as gasoline, diesel fuel and heating oil. This is the one of the most common sources for the contamination of groundwater with BTEX (benzene, toluene, ethylbenzene, xylenes) and PAHs (polycyclic aromatic hydrocarbons). BTEX accounts for as much as 90% of the gasoline components that are found in the water-soluble fraction when gasoline contacts the water.3 The fraction of all C3-benzene isomers was found to be about 1% of the total aromatics. The same study demonstrates that naphthalene and its methylated derivatives are the dominating compounds in the water fraction among the other PAHs which were found in trace amounts. Therefore, toluene, ethylbenzene, p-xylene, 1,2,4-trimethylbenzene (TMB), and naphthalene were selected as representative aromatic model compounds for this study.
Due to the potentially rapid spread of water contaminants the continuous improvement of early warning systems and the development of new online water monitoring methods are challenges for modern analytical chemistry. Most of the existing methods for analysis of gasoline contaminated samples are laboratory-based and therefore require time-consuming sampling and transport procedures. The most commonly used extraction methods for analysis of gasoline contaminated water samples are “headspace”, “purge and trap”, “liquid–liquid extraction”, “solid phase extraction” (SPE), and “solid phase micro-extraction” (SPME). Headspace analysis is recommended as a screening method by the US Environmental Protection Agency (EPA), though it also performs well in particular situations, especially field analysis.4 In many cases derivatisation or extraction steps are required. Moreover, these methods frequently include the GC or LC pre-separation steps.5 Despite the fact that chromatography is an effective and well-established method, in the case of complex samples it can be very time consuming. Therefore, the interest in miniaturized systems for on-site rapid monitoring has grown in recent years. Driving forces for the development of miniaturized systems are the reduced cost and analysis time, as well as the possibility to integrate all steps (e.g. sampling, sample preparation, separation techniques, and detection of the analytes) in a single and portable device.
The differential ion mobility spectrometry (DMS), also known as planar high field asymmetric waveform ion mobility spectrometry (FAIMS), is a rapidly advancing technology that is both sensitive and fast, operates at atmospheric pressure, and provides a unique type of selectivity, which is orthogonal to most of the other separation techniques.6,7 In contrast to the conventional Time of Flight Ion Mobility Spectrometry (ToF-IMS), in which the separation of ions is based on specific coefficients of ion mobility in a uniform electric field, DMS separates ions based on a nonlinear dependence of the mobility coefficient on the electric field strength. The dependence of the ion mobility coefficient on the electric field can be explained by the reversible cluster formation model, which describes field dependent cluster formations that lead to variation of the average ion cluster cross-section.8 The functional principles of the DMS are described elsewhere.9,10
In the last few decades the DMS has found many applications as a stand-alone analyser (with and without GC pre-separation) as well as a fast and an effective pre-separation technique for atmospheric pressure ionization mass spectrometry.7,11 Separation based on ion mobility is fast in comparison with chromatographic methods and provides separation on the MS time scale. It was demonstrated that the methods based on ion mobility can significantly enhance the chromatographic separation or even be considered as an alternative to chromatography.12,13 The employment of DMS prior to mass spectrometry improves both the selectivity and signal to noise ratio of MS measurements. Moreover, the ability of DMS to separate the isobaric and isomeric compounds enhances the differentiation ability of the mass spectrometer.
The spectrometers with curved electrode geometry are usually named FAIMS (high field asymmetric waveform ion mobility spectrometry) and the spectrometers with planar electrode geometry are named DMS. Comparison of the performances of DMS with planar and cylindrical electrode design has been previously published.14,15 Planar geometries usually offer a higher resolving power at a cost of lower ion transmission, whereas curved geometries provide greater ion transmission due to an electrostatic focusing effect at a cost of resolving power.
Over the last decade it was demonstrated that addition of an appropriate amount of volatile organic compounds (modifiers) to the transport gas can significantly enhance the resolving power of planar DMS.16–19 For curved geometries the introduction of a solvent vapor of high concentration is problematic, since the focusing effect causes a dramatic decrease in ion signal or even a complete signal loss.20,21 The intensity of the ion signal in the spectrometers with planar electrode geometry is not as affected by solvent vapors due to the lack of the ion focusing effect. Typically polar modifiers (2-propanol, acetone, ethylacetate, etc.) are utilized for improving the spectrometer resolving power.12,16,22 The addition of non-polar modifiers to the transport gas for the improvement of the DMS separation is rarely presented. As reported in the literature, the addition of non-polar modifiers (e.g. cyclohexane) to the carrier gas results only in a negligible effect on observed separation.12 It is assumed that polar modifiers may induce the cluster/decluster mechanism, which provides an increase of the ion separation in comparison with the measurements with pure nitrogen. The separation efficiency is dependent on the strength of the interaction between the analyte and the modifier. Similar to nitrogen, non-polar modifiers have demonstrated no improvement in separation of the polar compounds due to the weak analyte–modifier interaction.12 In our previous publication we have demonstrated that the utilization of polar modifiers, which are usually applied for the improvement of separation ability of DMS based systems (water vapors and 2-propanol), does not improve the separation of non-polar aromatic compounds.23 The most likely reason for the compensation voltage (CV) being independent of the polar modifier concentration is a weak interaction of non-polar aromatic analyte-ions with the polar modifiers. Due to the weak analyte-ion to polar modifier interaction, the analyte-ion size is almost independent of the modifier concentration and no significant dependence of the analyte peak CV on the polar modifier concentration can be observed. Moreover, the peak area of the non-polar aromatic compounds decreases with the increase of the polar modifier concentration. Due to this limitation no advantages from the addition of the polar modifier to the transport gas of the DMS can be expected for a variety of non-polar compounds, including a number of environmentally important non-polar aromatic compounds.
In this paper, we demonstrate with the example of benzene that the choice of the appropriate non-polar modifier which can provide sufficient chemical interactions with the target analytes leads not only to the improvement in the selectivity but also in the increased sensitivity of the analysis of aromatic compounds with planar DMS. Five aromatic compounds of low polarity (toluene, ethylbenzene, p-xylene, 1,2,4-trimethylbenzene, and naphthalene), which can provide a π–π interaction with the aromatic modifier, were selected to prove the influence of the concentration of benzene on the compensation voltage and signal area.
2. Experimental
2.1 Experimental setup
The principal scheme of the experimental setup used in this study is shown in Fig. 1. The overall nitrogen flow entering the DMS was prepared by mixing the main flow of pure nitrogen (99.999%, Air Liquide, Germany), controlled using a mass flow controller (MFC, Pneutronics, VSO-GC), with an additional nitrogen flow containing the modifier. The main and additional flows of pure nitrogen were dried over molecular sieves (MSR, 4 Å, Typ 514, Roth). The homemade vapor generator (VG) included a temperature controlled saturated vapor source and a flow of nitrogen. The nitrogen flow containing the modifier was controlled using a mass flow controller (GFC17, 0–50 mL min−1 N2, Aalborg, USA). The overall nitrogen flow, controlled using a solid state flow meter (MFM, Restek 6000, Restek, UK) located on the exhaust of DMS, was kept constant at 300 mL min−1. The pressure was monitored using the pressure sensor from the DMS, which is built on the input to the analyser. The samples for the measurements were introduced via the syringe pump (SP).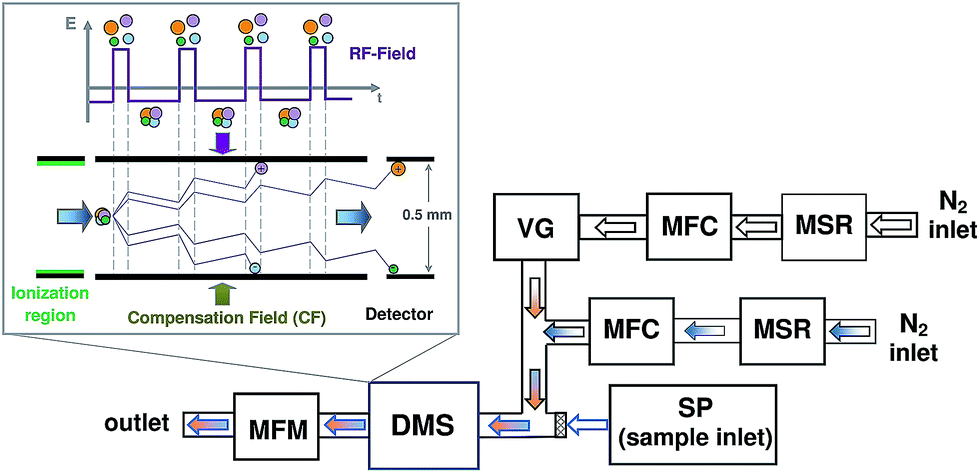 | ||
| Fig. 1 The principal scheme of the experimental setup: differential ion mobility spectrometer (DMS), syringe pump (SP), mass flow controller (MFC), mass flow meter (MFM), molecular sieves reservoir (MSR), vapor generator (VG). | ||
2.2 Chemicals
To prove the influence of an aromatic modifier of low polarity (benzene, AppliChem, 99+%) on the signal compensation voltage, FWHM, and area, five aromatic compounds of low polarity (toluene [J.T. Baker, 99.9%], ethylbenzene [Fluka, 99+%], p-xylene [Fluka, 99+%], 1,2,4-trimethylbenzene [Aldrich, 98%], and naphthalene [Sigma-Aldrich, 99%]) were selected. The molecular weights, the proton affinities, and the vapor pressures of the modifier and model compounds are summarized in Table 1.| Compound | MW [g mol−1] | PA [kJ mol−1] | VP at 20 °C [hPa] |
|---|---|---|---|
| Benzene | 78.11 | 744.8–750.4 (ref. 24–26) | 99.5 (ref. 27) |
| Toluene | 92.14 | 782.4–784.0 (ref. 24–26) | 29.1 (ref. 28) |
| Ethylbenzene | 106.17 | 788.0–789.9 (ref. 25 and 26) | 9.5 (ref. 29) |
| p-Xylene | 106.17 | 785.4–794.4 (ref. 24–26) | 8.7 (ref. 30) |
| TMB | 120.19 | ∼837 (ref. 31) | 2.3 (ref. 32) |
| Naphthalene | 128.17 | 800.0–802.9 (ref. 26) | 0.08 (ref. 33) |
The samples for the measurements were prepared as follows: an analyte sample volume of 1 mL was transferred into a 20 mL vial under a nitrogen atmosphere. The vial was closed with a screw cap equipped with Butyl/PTFE septa (S/N 100032, BGB, Germany) and equilibrated for 1 hour at 20 °C. The samples were taken from the headspace of the vial using a Hamilton gas-tight syringe (10, 50, and 500 μL size). The concentration of the analyte in the carrier gas of DMS was controlled by the injection rate of the syringe pump (kdScientific, KDS Legato 210) equipped with a Hamilton gas-tight syringe.
The concentrations of model compounds in the carrier gas for the measurements performed in Section 3.2 (Effect of the benzene concentration on the compensation voltage and peak area of model compounds) were as follows: 3564 ng L−1 for toluene, 1366 ng L−1 for ethylbenzene, 626 ng L−1 for p-xylene, 113 ng L−1 for TMB, and 105 ng L−1 for naphthalene.
2.3 DMS
The differential ion mobility spectrometer (SVAC-V, 63Ni 185 MBq, Scionex Corp., USA) settings were as follows: sensor temperature = 80 °C, number of steps = 100, step duration = 10 ms, step settle time = 3 ms, steps to blank = 1. The measurements were analysed in the positive (positive ions) mode with a RF-Voltage of 1000 V (20 kV cm−1) and nitrogen (99.999%, Air Liquide, Germany) flow rate of 300 mL min−1, otherwise noted. The compensating voltage range was set from −20 to +5 V.For each sample three single measurements were recorded using Sionex Expert software (version 2.4.0). For the determination of peak parameters (centre, area, FWHM) the measured data were analysed using the fityk (version 0.9.4) program.34 The peaks were fitted with Gaussian functions using the Levenberg–Marquardt algorithm.
It should be noted that the analyte signal positions on the compensation voltage scale are very sensitive to even minor pressure differences. To enable the comparison of spectra obtained under different experimental conditions the method described by Nazarov et al.35 was used. This method proposes the utilization of E/N scaling in Townsend units (Td). In this case the reduced compensation field scale (CF, in [Td]) is utilized instead of the compensation voltage scale (CV, in [V]). In our study the utilization of this method has minimized but not completely eliminated the differences between the measurements at different pressures. That is why the data presented in this manuscript were recorded within the narrow pressure gap between 14.45 and 14.57 psi.
3. Results and discussion
The utilization of non-polar aromatic modifiers for the improvement of sensitivity and separation ability of the 63Ni-DMS has hitherto not been systematically investigated. However, it was demonstrated that non-polar aromatic modifiers (e.g. benzene, toluene) can be employed as dopants to improve the sensitivity of the ion mobility devices equipped with atmospheric pressure photo ionization (APPI) sources. Roetering et al. have demonstrated that the utilization of traces of benzene (0.260 ppmv) for the analysis of the pesticides with APPI-DMS results in both an improvement of the sensitivity of the method and a shift of the analyte peaks.36 The increase in the sensitivity was explained by the increased ionization efficiency of analytes over the charge exchange with the photoionized benzene radical cation. Despite the differences in ionization mechanisms proposed for APPI (depends on the ionization potential) and 63Ni-ionization-based (depends on proton affinity) sources, these findings demonstrate the prospects for the utilization of aromatic modifiers for the improvement of the peak separation in the differential ion mobility based methods.Not much information is found in the literature about the utilization of non-polar modifiers for the improvement of the separation ability of the differential mobility based devices for ionization sources, other than APPI.12 Hill et al. have demonstrated the utilization of the aromatic modifier nitrobenzene for the improvement of the IMS separation power.37 This compound can provide π–π interactions with the aromatic compounds but has a proton affinity of 800.3 kJ mol−1.25 Due to the rather high proton affinity the utilization of nitrobenzene for all selected model compounds except TMB is problematic (see Table 1).
Due to the relatively low proton affinities of toluene, ethylbenzene, and p-xylene (see Table 1) the choice of the modifier is very limited. The modifier should have a proton affinity lower than, or comparable to, those of the analytes. Furthermore, the modifier should be able to cluster with the analyte in a reversible manner. In the current work the effect of the aromatic modifier (benzene) on the sensitivity and separation power of DMS for aromatic compounds is examined. This modifier provides separation based on the π–π modifier-to-analyte interactions. Therefore, this type of modifier can be utilized for a large number of substances containing π-electrons. This includes all compounds which have aromatic structural components. The effect on the compounds with double and triple bonds can also be expected. Because of the low proton affinity benzene can be used as a modifier for a large number of compounds.
3.1 Effect of the benzene concentration on the reactive ion peak (RIP)
The dependence of the compensation field (CF) and area of benzene peaks on the benzene concentration is presented in Fig. 2 (top). The addition of benzene into the carrier gas caused complete replacement of the RIP peak by a new peak (Fig. 2, top, Peak 1). When the concentration of benzene was less than 0.01%, this peak demonstrated the identical CF-values as observed in the standard measurements of the pure benzene samples. Therefore, this peak was assigned to the product ions of benzene. The following increase in the benzene concentration results in the appearance of the second peak (Fig. 2, top, Peak 2). The appearance of this peak is supposed to be induced by the dimerization of the protonated benzene cation with a neutral benzene molecule. A further increase in the benzene concentration (within the range of 0.015–0.06%) leads to the complete replacement of these two peaks by a new peak (Fig. 2, top, Peak 3). A further increase of benzene concentration leads to a significant increase of Peak 3 area. The maximum of Peak 3 area is observed at a benzene concentration of ∼0.4%. Within the benzene concentration range of 0.4–1.5% the area of Peak 3 slightly decreases. Additionally, Peak 4 was detected at benzene concentrations as high as 0.15%. The area of this peak continuously increases within the benzene concentration range of 0.15–1.5%. The possible reason for the formation of Peak 3 and Peak 4 is a further complexation of the cation of the benzene dimer with neutral benzene molecules. To prove this hypothesis further investigation is required. With the increase in benzene concentration all peaks undergo a shift on the CF scale toward more negative CF values. Peaks 1 and 2 undergo a higher shift in comparison to Peaks 3 and 4. This shift toward the negative CF values can be explained by the reversible cluster formation model, which describes field dependent cluster formations that lead to variation of the average ion cluster cross-section.8 This model demonstrates that the ion-cluster size and the ion-cluster mobility are dependent on the concentration of the clustering particles (in this case the benzene concentration), cluster temperature, and complex formation energy. With an increase of electric field strength the effective ion-cluster temperature increases, resulting in rapid declustering due to a high collision rate at atmospheric pressure. Hence, the average ion-cluster size is reduced. A reduction in the average ion-cluster size may increase the ion mobility significantly. Under a low electric field a higher benzene concentration in the gas phase leads to an increase in the average ion-cluster size. An increase in the ion-cluster cross-section, which correlates with the benzene concentration, results in a reduced ion-cluster mobility and a corresponding increase in the frequency of cluster to carrier gas collisions. As a result the difference between the mobility of the ions in the low and in the high electric field at higher benzene concentrations increases, leading to an increase of the signal shift on the CF scale.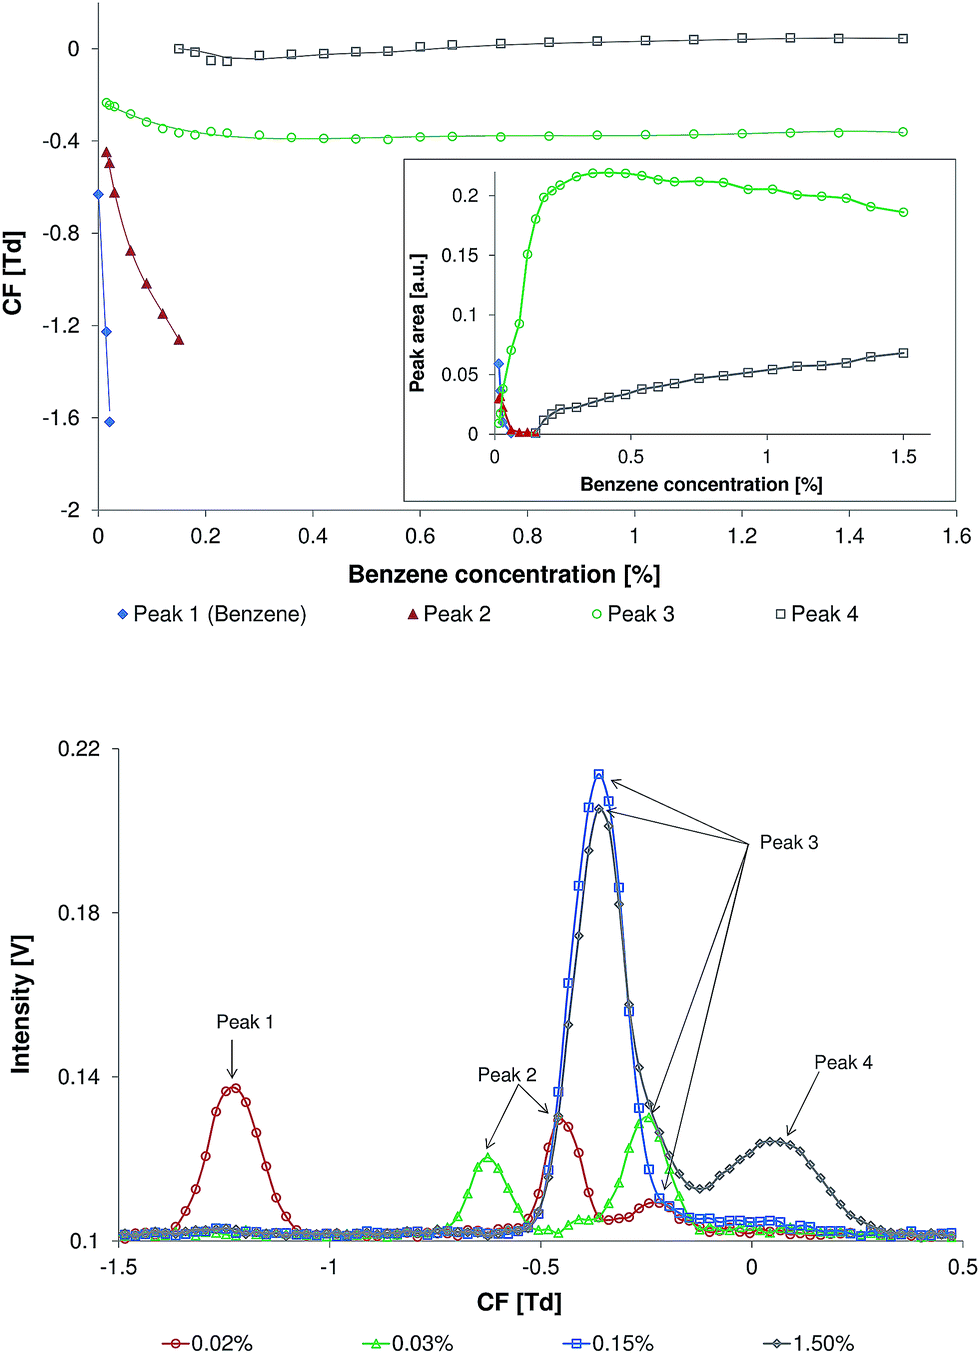 | ||
| Fig. 2 Top: the relationship between the compensation field (CF) of benzene peaks and the concentration of benzene in the carrier gas. The relationship between the area of benzene peaks and benzene concentration is shown in the inset. Bottom: the spectra recorded at benzene concentrations of 0.02, 0.03, 0.15, and 1.50%. | ||
The spectra recorded at benzene concentrations of 0.02, 0.03, 0.15, and 1.50% are demonstrated in Fig. 2 (bottom).
3.2 Effect of the benzene concentration on the compensation voltage and peak area of model compounds
Benzene is the smallest representative of non-polar aromatic compounds. The rather low proton affinity of benzene (∼750 kJ mol−1, see Table 1) allows the efficient ionization of most of the aromatic compounds.When the concentration of the benzene was less than 0.01%, the peaks of all model compounds were observed at usual positions on the CF scale. With the increase in benzene concentration all peaks undergo a shift on the CF scale toward the more negative CF values (Fig. 3, top). The compounds with a lower molecular weight undergo a higher shift in comparison to the compounds with a higher molecular weight. The highest effect was observed for the peak of toluene. This shift toward the negative CF values can be explained by the reversible cluster formation model, in correspondence to that discussed in Section 3.1 for the benzene clusters.
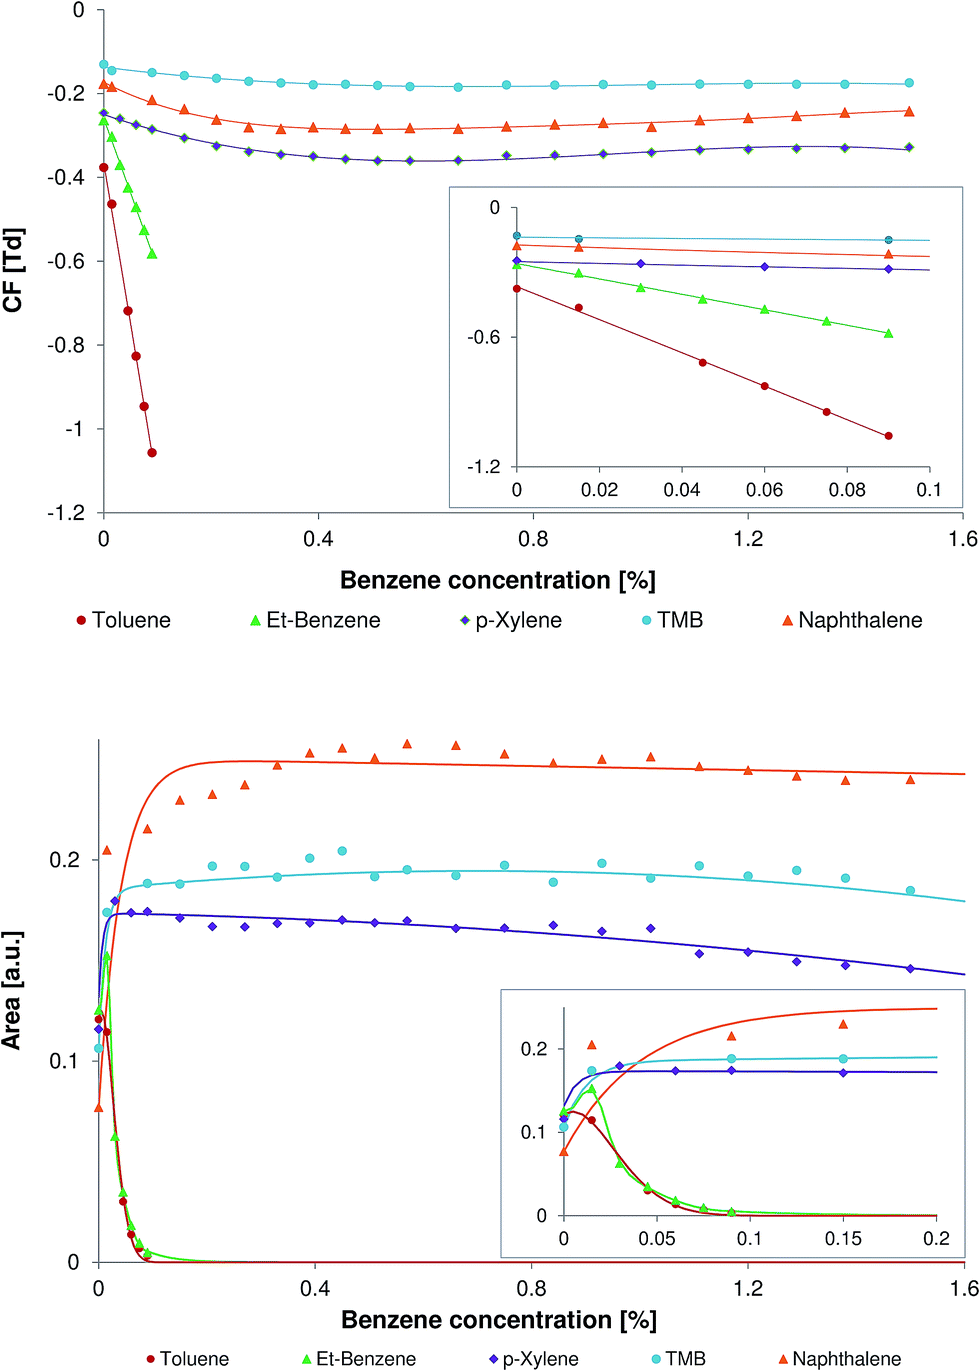 | ||
| Fig. 3 Top: the relationship between the compensation field (CF) of the model compounds and the concentration of the benzene in the carrier gas. Bottom: the relationship between the peak area of the model compounds and the concentration of the benzene in the carrier gas. The corresponding relationships within narrow CF ranges are presented in the insets. | ||
The relationship between the peak area of the model compounds and the concentration of the benzene in the carrier gas is shown in Fig. 3 (bottom). All selected model compounds except toluene demonstrate an increase of the peak area at a benzene concentration of 0.015%. The following increase of the benzene concentration results in an extreme decrease of the peak area of toluene and ethylbenzene. The decrease of the peak area for toluene and ethylbenzene can be explained by the low proton affinities of these compounds (see Table 1). The compounds with high proton affinity, namely naphthalene and TMB, demonstrate no significant decrease of the peak area within a benzene concentration range of 0.15–1.5%. The peak area of naphthalene slightly increases within the benzene concentration range of 0.15–0.4% and is almost unchanged within the range of 0.4–1.5%. When the concentration of benzene in the carrier gas was 0.4% the peak area of naphthalene was more than tripled and the peak area of TMB was almost doubled.
The proton affinity of p-xylene is only slightly higher than that of ethylbenzene. Despite their comparable proton affinities these two compounds demonstrate a different relationship between the peak area and benzene concentration. In contrast to ethylbenzene, the peak area of p-xylene is only slightly affected within the wide benzene concentration range of 0.15–1.5%.
Sherrill et al. have demonstrated that all complexes of benzene with substituted benzenes (toluene, xylene, etc.) have greater interaction energy than the benzene dimer.38,39 It is remarkable that the increase of interaction energy is linear in the series of the benzene complexes with benzene, toluene, p-xylene, and 1,3,5-trimethylbenzene. Thus, the interaction of benzene with poly-substituted aromatic compounds should be stronger than the interaction of benzene with mono-substituted compounds. Due to the increase in interaction energy the lifetime of the cluster-ions formed with polysubstituted benzenes (e.g. p-xylene) should be increased in comparison with that of monosubstituted benzenes (e.g. toluene and ethylbenzene), which results in an increased peak area. Thus, the increase of the peak area in the DMS equipped with a 63Ni-ionization source most likely originates from the better ion transport within the DMS filter region. This differs from the DMS equipped with an APPI-source, which demonstrates the increased signal intensities in the presence of aromatic dopants due to the increased ionization efficiency of analytes.
In Fig. 4 the differential mobility spectra of the aromatic model compounds with no modifier (top) and with 0.06% of benzene (bottom) in the carrier gas are demonstrated. At this concentration the analyte peak separation is sufficient and the peak areas of the toluene (Fig. 4, bottom, CF = −0.83 Td) and ethylbenzene (Fig. 4, bottom, CF = −0.48 Td) are high enough for accurate analysis. It should be noted that at a benzene concentration of 0.06% the peak of the benzene product at CF = −0.29 Td is not completely replaced by peaks of toluene and ethylbenzene.
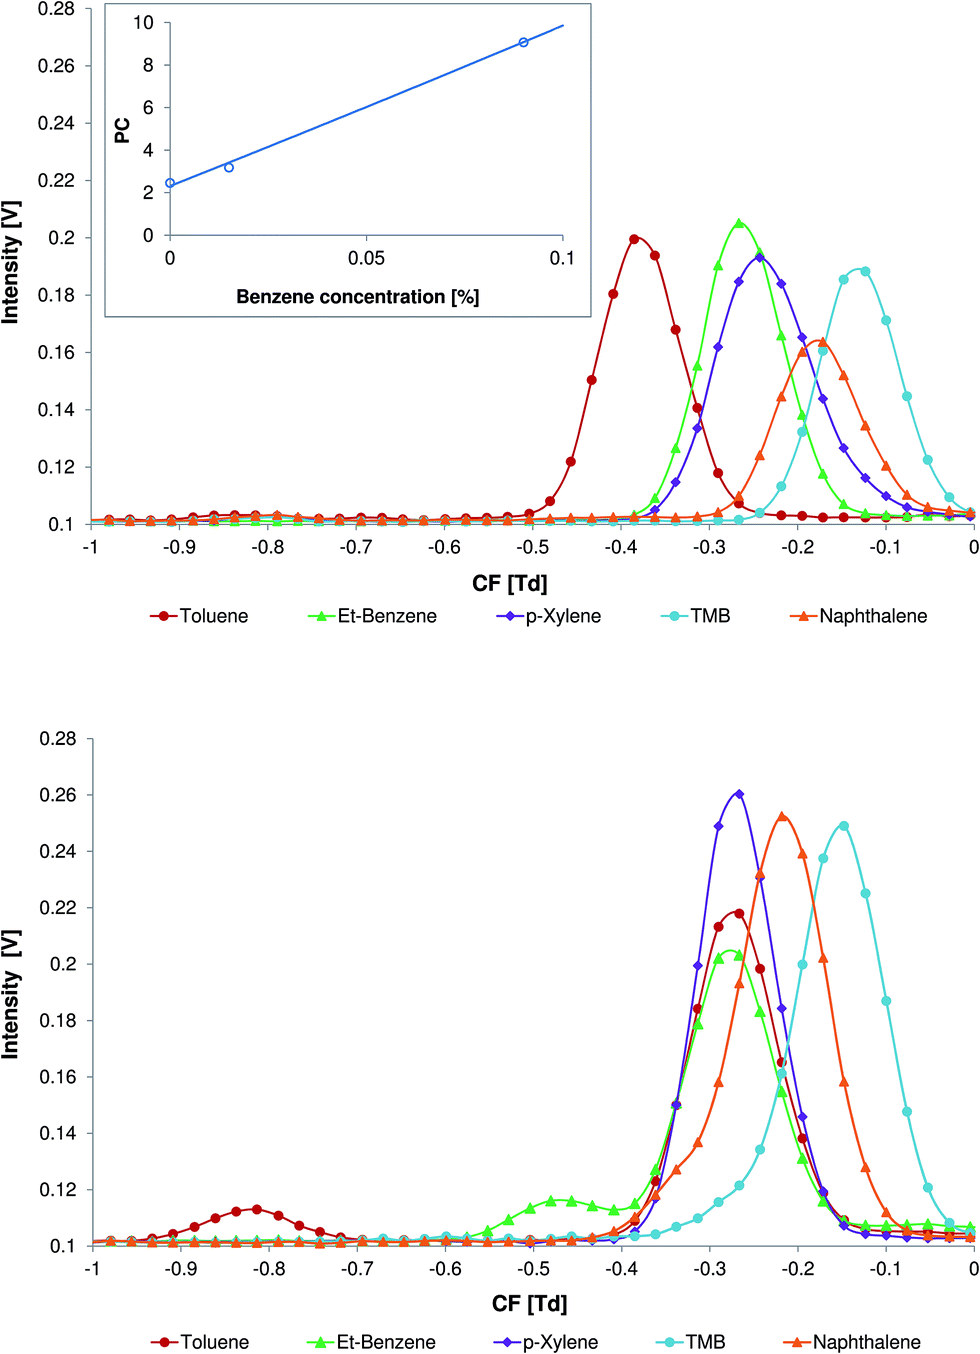 | ||
| Fig. 4 Differential mobility spectra of toluene, ethylbenzene, p-xylene, 1,2,4-trimethylbenzene, and naphthalene with no modifier (top) and with 0.06% of benzene (bottom) in the carrier gas. The relationship between the peak capacity (PC) and the concentration of the benzene in the carrier gas is presented in the inset. | ||
Peak capacity is one way to express the separation capability of an analytical device. For DMS, the peak capacity can be defined as a spread of peaks in the compensation voltage scale divided by the average peak width at half height (see eqn (1)).
| PC = (Cmax − Cmin)/FWHMav | (1) |
3.3 Determination of analytical parameters for the model compounds with and without modifier
The DMS spectra of naphthalene without the modifier and with 0.015% of benzene in the carrier gas, in the positive mode (detection of the positive ions) within a concentration range of 1.4 to 210 ng L−1 (concentration in the carrier gas), are shown in Fig. 5. These measurements were performed at an electric field strength of 20 kV cm−1 (RF = 1000 V). The DMS spectra of ethylbenzene, p-xylene, and 1,2,4-trimethylbenzene recorded under the same experimental conditions can be found in the ESI.† At a benzene concentration of 0.015% the peak areas of all of the selected model compounds are significantly increased and the background is not high as compared with those at higher benzene concentrations (see Fig. 2 and 3).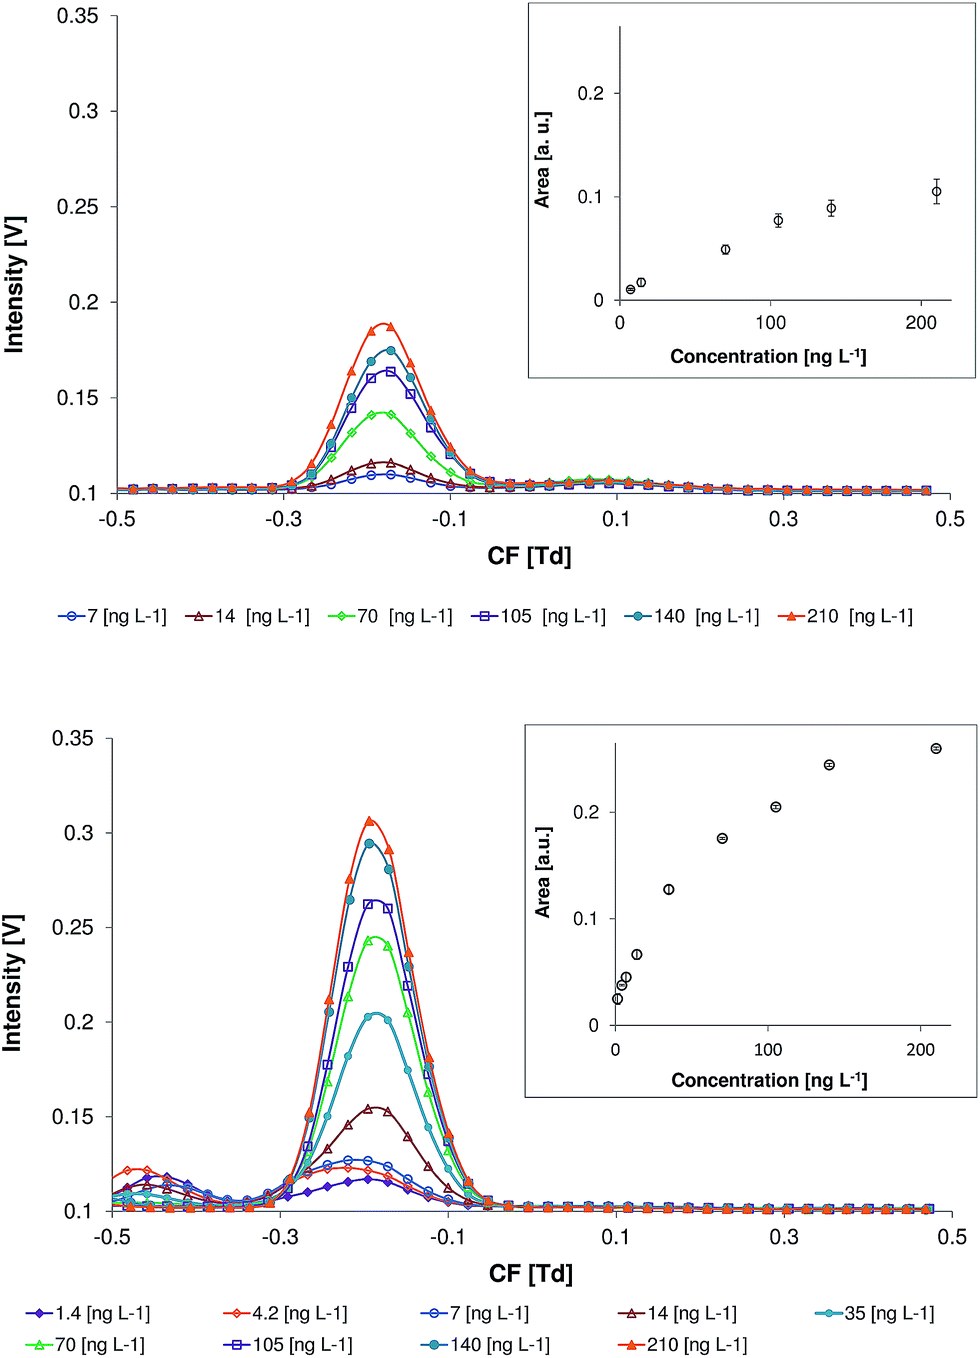 | ||
| Fig. 5 Differential mobility spectra of naphthalene at different concentrations without the modifier (top) and with 0.015% of benzene (bottom) in the carrier gas. | ||
The reason for the observed minor variations in the analyte peak shapes and compensation voltages is the deviation of the benzene concentration in the carrier gas during these measurements.
For all of the selected analytes a common for non-direct ionization mechanisms, such as APCI, a non-linear signal area to concentration relationship was observed.40,41 Due to this reason non-linear second-order calibration functions according to DIN 8466-2 were applied. The relevant equations for the non-linear calibration can be found in the ESI section.† The use of the non-linear calibration for the ion mobility spectrometry based methods was found to enlarge the concentration range in which the analyte can be quantified.41,42 The addition of benzene to the carrier gas results in an increase of the DMS response for all of the analytes (see Fig. 4 and ESI†). The highest effect was observed for naphthalene. However, the increase of the benzene concentration leads to the reduction of the dynamic range.
Calibration ranges, coefficients of determination, and limits of detection for the ethylbenzene, p-xylene, 1,2,4-trimethylbenzene, and naphthalene are summarized in Table 2. Quantification of toluene in the measurements with a modifier was not possible due to an overlap in the toluene signal and the signal of benzene dimer (see Section 3.1). The limits of detection were calculated according to the concentration of the analyte in the carrier gas. Despite the higher response of the DMS in the presence of aromatic modifier, the limits of detection for calibrations without the modifier and with 0.015% of benzene are within the same range (14.2–99.9 and 10.6–89.5 ng L−1, for the calibration without and with modifier, respectively). This originates mainly from the higher background signal caused by benzene and the benzene dimer (see Section 3.1). These peaks are detected within the CF range that is similar to those observed for the most of the model substances. This results in the interference between the benzene and model compound signals. The only compound whose LOD was significantly lower in the presence of 0.015% of benzene than that without a modifier was p-xylene. Nevertheless, the analysis of the compounds with high proton affinity, e.g. 1,2,4-thrimethyl benzene and naphthalene, was possible even at a benzene concentration of 0.6%.
| Range [ng L−1] | R 2 | LOD [ng L−1] | |
|---|---|---|---|
| No modifier | |||
| Ethylbenzene | 14–1366 | 0.9916 | 99.9 |
| p-Xylene | 38–1880 | 0.9919 | 98.7 |
| 1,2,4-Trimethylbenzene | 11–377 | 0.9967 | 16.6 |
| Naphthalene | 7–210 | 0.9939 | 14.2 |
![[thin space (1/6-em)]](https://www.rsc.org/images/entities/char_2009.gif) |
|||
| 0.015% of benzene | |||
| Ethylbenzene | 14–683 | 0.9412 | 89.5 |
| p-Xylene | 2.5–376 | 0.9629 | 30.9 |
| 1,2,4-Trimethylbenzene | 11–302 | 0.989 | 18.9 |
| Naphthalene | 1.4–140 | 0.9905 | 10.6 |
|
|||
| 0.6% of benzene | |||
| 1,2,4-Trimethylbenzene | 3.8–189 | 0.9831 | 16.1 |
| Naphthalene | 7–140 | 0.9865 | 10.4 |
4. Conclusions
It was demonstrated that the choice of an appropriate non-polar modifier, which can provide sufficient chemical interactions with the target analytes, can lead to a significant improvement in the sensitivity and selectivity of the DMS.The proposed method simultaneously improves two analytical parameters, namely the peak capacity and sensitivity (response to the analyte). In our opinion the synergistic effect of these two improvements will result in an increased sensitivity during the analysis of the complex mixtures (e.g. real samples).
The increase of the peak area in the DMS equipped with a 63Ni-ionization source was explained by the improved ion transport within the DMS filter region. This differs from the DMS equipped with the APPI-source, which demonstrates the increased signal intensities in the presence of aromatic dopants due to the increased ionization efficiency of the analytes.
The results reported in this paper demonstrate that the use of the proper modifier can potentially improve the sensitivity of ion mobility-based analytical methods. This knowledge is especially interesting for the development of ion mobility-based methods for the analysis of gasoline samples, which contain a high fraction of aromatic compounds.
References
- R. Baciocchi, S. Berardi and I. Verginelli, J. Hazard. Mater., 2010, 181, 226–233 CrossRef CAS PubMed.
- T. Shih, Y. Rong, T. Harmon and M. Suffet, Environ. Sci. Technol., 2004, 38, 42–48 CrossRef CAS.
- T. Saeed and M. Al-Mutairi, Environ. Int., 1999, 25, 117–129 CrossRef CAS.
- W. Weisman, TPH Series Vol. 1: Analysis of Petroleum Hydrocarbons in Environmental Media, Amherst Scientific Publishers, 1998 Search PubMed.
- N. S. Chary and A. R. Fernandez-Alba, TrAC, Trends Anal. Chem., 2012, 32, 60–75 CrossRef CAS PubMed.
- A. A. Shvartsburg, Differential Ion Mobility Spectrometry: Nonlinear Ion Transport and Fundamentals of FAIMS, CRC Press, 2008 Search PubMed.
- B. M. Kolakowski and Z. Mester, Analyst, 2007, 132, 842–864 RSC.
- E. V. Krylov and E. G. Nazarov, Int. J. Mass Spectrom., 2009, 285, 149–156 CrossRef CAS PubMed.
- I. A. Buryakov, E. V. Krylov, E. G. Nazarov and U. Kh. Rasulev, Int. J. Mass Spectrom. Ion Processes, 1993, 128, 143–148 CrossRef CAS.
- R. A. Miller, E. G. Nazarov, G. A. Eiceman and A. T. King, Sens. Actuators, A, 2001, 91, 301–312 CrossRef CAS.
- B. B. Schneider, T. R. Covey, S. L. Coy, E. V. Krylov and E. G. Nazarov, Int. J. Mass Spectrom., 2010, 298, 45 CrossRef CAS PubMed.
- B. B. Schneider, T. R. Covey and E. G. Nazarov, Int. J. Ion Mobility Spectrom., 2013, 16, 207–216 CrossRef CAS PubMed.
- F. Liang, K. Kerpen, A. Kuklya and U. Telgheder, Int. J. Ion Mobility Spectrom., 2012, 15, 169–177 CrossRef CAS PubMed.
- E. V. Krylov, Int. J. Mass Spectrom., 2003, 225, 39–51 CrossRef CAS.
- A. A. Shvartsburg, F. Li, K. Tang and R. D. Smith, Anal. Chem., 2006, 78, 3706–3714 CrossRef CAS PubMed.
- G. A. Eiceman, E. V. Krylov, N. S. Krylova, E. G. Nazarov and R. A. Miller, Anal. Chem., 2004, 76, 4937–4944 CrossRef CAS PubMed.
- L. C. Rorrer III and R. A. Yost, Int. J. Mass Spectrom., 2011, 300, 173–181 CrossRef PubMed.
- D. S. Levin, P. A. Vouros, R. A. Miller, E. G. Nazarov and J. C. Morris, Anal. Chem., 2006, 78, 96–106 CrossRef CAS PubMed.
- B. B. Schneider, T. R. Covey, S. L. Coy, E. V. Krylov and E. G. Nazarov, Eur. J. Mass Spectrom., 2010, 16, 57–71 CrossRef CAS PubMed.
- R. W. Purves, R. Guevremont, S. Day, C. W. Pipich and M. S. Matyjaszczyk, Rev. Sci. Instrum., 1998, 69, 4094–4105 CrossRef CAS PubMed.
- B. M. Kolakowski, M. A. McCooeye and Z. Mester, Rapid Commun. Mass Spectrom., 2006, 20, 3319–3329 CrossRef CAS PubMed.
- B. B. Schneider, E. G. Nazarov and T. R. Covey, Int. J. Ion Mobility Spectrom., 2012, 15, 141–150 CrossRef CAS PubMed.
- A. Kuklya, F. Uteschil, K. Kerpen, R. Marks and U. Telgheder, Int. J. Ion Mobility Spectrom. DOI:10.1007/s12127-014-0162-8 , published online.
- S.-L. Chong and J. L. Franklin, J. Am. Chem. Soc., 1972, 94, 6630–6635 CrossRef CAS.
- E. P. L. Hunter and S. G. Lias, J. Phys. Chem. Ref. Data, 1998, 27, 413–656 CrossRef CAS PubMed.
- D. H. Auea, M. Guidonia and L. D. Betowski, Int. J. Mass Spectrom., 2000, 201, 283–295 CrossRef.
- Benzene, MSDS, version 5.1, Sigma-Aldrich, 17 Oct 2013 Search PubMed.
- Toluene, MSDS, version 5.4, Sigma-Aldrich, 29 Jan 2014 Search PubMed.
- Ethylbenzene, MSDS, version 10.1, Merck, 04 Nov 2010 Search PubMed.
- p-Xylene, MSDS, version 9.3, Merck, 15 May 2014 Search PubMed.
- J. Zhao and R. Zhang, Atmos. Environ., 2004, 38, 2177–2185 CrossRef CAS PubMed.
- 1,2,4-Trimethylbenzene, MSDS, version 5.1, Sigma-Aldrich, 04 Jul 2013 Search PubMed.
- Naphthalene, MSDS, RN 1, Acros, 27 Sep 2010 Search PubMed.
- M. Wojdyr, J. Appl. Crystallogr., 2010, 43, 1126–1128 CrossRef CAS.
- E. G. Nazarov, S. L. Coy, E. V. Krylov, R. A. Miller and G. A. Eiceman, Anal. Chem., 2006, 78, 7697–7706 CrossRef CAS PubMed.
- S. Roetering, E. G. Nazarov, H. Borsdorf and C. Weickhardt, Int. J. Ion Mobility Spectrom., 2010, 13, 47–54 CrossRef CAS PubMed.
- R. Fernández-Maestre, C. Wu and H. H. Hill Jr, Rapid Commun. Mass Spectrom., 2012, 26, 2211–2223 CrossRef PubMed.
- A. L. Ringer, M. O. Sinnokrot, R. P. Lively and C. D. Sherrill, Chem.–Eur. J., 2006, 12, 3821–3828 CrossRef CAS PubMed.
- M. O. Sinnokrot and C. D. Sherrill, J. Phys. Chem. A, 2006, 110, 10656–10668 CrossRef CAS PubMed.
- G. A. Eiceman and Z. Karpas, Ion Mobility Spectrometry, CRC Press, 2nd edn, 2005 Search PubMed.
- A. Kuklya, F. Uteschil, K. Kerpen, R. Marks and U. Telgheder, Talanta, 2014, 120, 173–180 CrossRef CAS PubMed.
- C. Zscheppank, U. Telgheder and K. Molt, Int. J. Ion Mobility Spectrom., 2012, 15, 257–264 CrossRef CAS PubMed.
Footnote |
| † Electronic supplementary information (ESI) available. See DOI: 10.1039/c4ay03029j |
| This journal is © The Royal Society of Chemistry 2015 |