
 Open Access Article
 This Open Access Article is licensed under a
 Creative Commons Attribution 3.0 Unported Licence
Dairy manure protein analysis using UV-vis based on the Bradford method
Zong
Liu
a,
Jorge Santini
Gonzalez
b,
Hui
Wang
a,
Sundaram
Gunasekaran
a and
Troy
Runge
*a
aDepartment of Biological Systems Engineering, University of Wisconsin–Madison, Madison, WI 53706, USA. E-mail: trunge@wisc.edu
bUniversity of Puerto Rico at Mayagüez, Mayagüez, 00680, Puerto Rico
First published on 9th February 2015
Abstract
Organic nitrogen in the form of protein and degraded protein fragments is one of the most important components of dairy manure. Conventionally, protein concentration in dairy manure was estimated by crude protein but it is often overestimated because crude protein contains non-protein nitrogen (NPN). The Bradford assay is predominantly used in measuring clinic samples. In this paper, dairy manure protein assays including the Bradford assay, total Kjeldahl nitrogen method and amino acid analysis were compared using various types of manure samples with a wide range of solids contents at different on-farm treatment steps. The manure protein concentration assay by UV-vis using Bradford method was validated to be compatible to measure the protein concentration in manure samples. Relationships for estimating manure total protein concentration from soluble protein based on the solids contents have been determined. The method described in this study could be used as a supplement method for traditional protein assay, especially when the solids content in manure samples is low. In addition, this method can be easily adapted at a farm level to monitor manure soluble protein and estimate crude protein concentration in order to evaluate the effects of diet change and to manage manure field application amount as fertilizer.
Introduction
In the United States, approximately 350 billion pounds of dry manure are produced annually1 most of which is used as field fertilizer. Long-term manure application may result in high risks of runoff and leaching of manure-derived components such as nitrogen and phosphorus from the agricultural fields.2 Developing not only new ways to process dairy manure, as most current research is focused on, but also new methods to evaluate its composition may be beneficial to further research and management of manure utilization and disposal.3,4Organic nitrogen in the form of protein and degraded protein fragments is one of the most important components of dairy manure. In this paper, manure protein including degraded protein fragments is subsequently referred to as “protein”. Crude protein content in dairy manure is about 15–20% (dry basis) estimated by the total nitrogen.5 The manure protein consists primarily of peptide chains of the degraded proteins from the digested forages, though they may also contain whole proteins from undigested feed or those secreted by microbes. Besides the major application as fertilizer, manure protein could be potentially used for many other purposes such as animal feed, amino acid production, adhesive, plastic and biofuels.6,7 Manure proteins are usually low in molecular weight, which made them more biologically accessible nitrogen sources than large molecular weight proteins such as intact proteins in plant tissue. Therefore, manure proteins are potentially excellent nutrient sources for microbial growth, because nitrogen is a key nutrient in microbial growth media.8 Previous research results also have suggested that dairy manure can be a great source of protein-rich material for many other purposes including culture medium supplements.9 However, there is no specific research developing manure protein assay as the currently applied manure protein analyses were adapted from clinic sample or plant/food sample analysis methods. The major advantages and disadvantages of these protein assays were compared in Table 1.
| Assays | Advantages | Disadvantages |
|---|---|---|
| Crude protein analysis (Kjeldahl method) | • Low cost (about $8/sample) | • May overestimate because of NPN |
| • Standard lab test for soil & manure samples | • Slow (3+ hours) | |
| Bradford method | • Low cost (about $3/sample) | • Low extraction efficiency of manure samples |
| • Easy and fast to conduct (15 min) | • Sensitive to contaminants | |
| • Standard lab test of clinic samples | ||
| Amino acid analysis | • More accurate | • High cost (about $65/sample) |
| • Provides amino acids profile | • Specialized lab test | |
| • Slow (3+ hours) |
Approximate protein content in soil, plant tissue, food, and animal feed is typically determined on the basis of total nitrogen content using the total Kjeldahl nitrogen (TKN) method.10 Crude protein (CP) content is usually calculated as 6.25 times the TKN value.11 However, this calculation is not accurate in many cases, especially when determining the protein content in dairy manure,12 because a substantial amount of the nitrogen in dairy manure comes from other sources. These compounds, such as nucleotides, urea, and ammonia, which are known as non-protein nitrogen (NPN) contribute to TKN and thus to an overestimated CP value.13
Amino acid analysis (AAA) is a more accurate way to quantify proteins since it is based on amino acid data, although it is more expensive and labor intensive than other methods.14 The food industry uses this method to determine the peptide and amino acid content in food.15 The AAA is essential to quantify proteins with higher accuracy levels, as it determines absolute protein quantities in solution. However, the accuracy of amino acid analysis suffers due to multiple purification and post-translational modification steps involved.16 Therefore, a simple, quick, accurate, and inexpensive method to quantify proteins in manure samples needs to be developed.
The Bradford assay is a protein quantification method that involves binding of Coomassie Brilliant Blue G-250 dye to proteins.17 This method is commonly used for protein quantification of clinical samples.18 However, validity of the Bradford assay is unclear because it may also release polymer excipients such as polyethylene glycol.19 These polymer excipients may bind with Coomassie Brilliant Blue G-250 dye and cause false-positive results. In addition, environmental samples such as dairy manure are more complicated.20 Dairy manure components are primarily water, proteins, NPN minerals and fibers (cellulose, hemicellulose and lignin).21 The Bradford method has not been investigated and evaluated for its suitability to quantify protein content in dairy manure despite its establishment for clinic samples. The Bradford assay has its own disadvantage such as relatively poor linearity, considerable protein-to-protein variability which is often systematic error and moderate sensitivity to interfering substances.22
In this study, we present a simple and inexpensive method based on the Bradford assay to quantify protein content in dairy manure using UV-vis spectroscopy. The goal was to validate the compatibility of using Bradford assay to determine manure protein concentration and also to compare results between the three commonly used methods for protein quantification in order to obtain more accurate results and understand the best method for different types of manure samples. The soluble protein extraction efficiency using Bradford method of different manure samples throughout large dairy farm operation was also tested, analyzed and compared.
Materials
The manure samples were collected from Maple Leaf Dairy, Cleveland, WI at various points in the manure processing system. The samples were collected fresh, immediately cooled and stored at 4 °C until analyzed. Three samples including raw manure (RM), dissolved air flotation (DAF) effluent (AD) and DAF sludge (DS) samples were collected in 4 liter bottles and analyzed within 4 weeks after sampling. These three samples selected for manure protein assay validation because they were from the most important farm treatment procedures and represent a large range of manure solids content.Five batches of manure samples from different treatment processes at Maple Leaf Dairy were collected within 5 consecutive weeks. These samples are summarized in Table 2.
| Sampling points | Average solid contents (%) | Standard deviation |
|---|---|---|
| Reception tank liquid | 4.59 | 0.54 |
| Pre clarifier liquid | 4.01 | 0.68 |
| Post trident solid | 8.38 | 0.62 |
| Clarifier effluent & water | 3.35 | 0.63 |
| Clarifier effluent | 0.47 | 0.27 |
| Mixing tank | 6.92 | 0.76 |
| Clarifier sludge | 3.78 | 0.50 |
| Digestate | 4.48 | 0.27 |
| Digestate before press | 5.92 | 1.80 |
| Digestate after press | 2.93 | 0.15 |
| Digestate & PAM | 2.75 | 0.10 |
| DAF sludge | 5.80 | 0.65 |
| DAF effluent | 1.48 | 0.06 |
| Lagoon solids dry | 17.59 | 3.51 |
| Lagoon solids wet | 0.82 | 0.24 |
These manure samples were also collected fresh, cooled on ice, transported in coolers, and stored at 4 °C. Soluble protein concentration using the modified Bradford assay developed in this study, solids content and TKN were measured of each sample. Protein analysis was done within one week to insure the samples did not undergo transient changes.
Methods
Validation of the Bradford method for manure protein analysis
The Quick Start™ Bradford Protein Assay protocol by Bio-Rad (Hercules, CA) was employed in this study.23 Two standard calibrations using bovine serum albumin (BSA) as standard protein were constructed. A calibration was prepared using a series of concentrations of BSA in Millipore water and another calibration was prepared using BSA in 50 mM Tris buffer with Pierce™ Proteinase Inhibitor (Thermo Fisher Scientific, Rockford, IL). These two calibrations were compared to determine if the extraction buffer had any significant interference on the UV-vis absorbance readings. A UV mini-1240 from Shimadzu Corp (Columbia, MD) UV-vis spectrophotometer was used with disposable plastic cuvettes from Fisherbrand® (Houston, TX).Raw manure (RM), dissolved air flotation (DAF) effluent (AD) and DAF sludge (DS) samples were spiked with Quick Start™ BSA in the range of 0.00–0.25 mg mL−1. The calibrations generated by plotting spike concentration versus UV-vis absorbance were evaluated to determine whether the Bradford method is compatible with manure protein analysis and also to determine the accuracy of the Bradford method for manure protein analysis. To validate the compatibility of the Bradford method with chemicals which are commonly present in manure sample but have not been confirmed by Bio-Rad, sodium nitrate (NaNO3) with concentrations from 0.00–1.25 M were spiked into manure samples and the UV-vis absorbance was measured. 20 μL of each sample was added to 1 mL Quick Start™ ready-to-use dye reagent in a cuvette, mixed briefly by inverting and then incubated at room temperature for approximately 5 min before UV-vis absorbance reading.
Solids analysis
RM, AD, and DS samples were mixed thoroughly upon arriving to the lab. About 150 g from each well-mixed manure sample was poured into crucibles and dried in an oven at 105 °C overnight. Triplicates of each fresh manure sample were made. The samples were weighed after dried to determine the solid content of each fresh sample.Amino acid analysis
The dry samples prepared during the solid analysis were analyzed by the Experiment Station Chemical Laboratories at the University of Missouri–Columbia for amino acid profile with content in details using a Beckman 6300 AA analyzer following the AOAC 2006 procedure.24 Triplicates of each fresh manure samples were sent for analysis.Protein extraction buffers comparison for Bradford method
Two different extraction buffers were tested to determine their effectiveness for soluble protein extraction. A 50 mM Tris buffer with Pierce™ Proteinase Inhibitor and a 50 mM Tris/0.02 wt% sodium dodecyl sulfate (SDS)/2.5 mM dithiothreitol (DTT) buffer with Pierce™ Proteinase Inhibitor were prepared, referred as simplified buffer and complete buffer respectively. Approximately 3 g of well mixed manure samples (RM, AD, and DS) were added into each buffer for UV-vis absorbance measurement. Triplicates of each sample in both buffers were prepared. To each sample, 15 mL of each protein extraction buffer was mixed thoroughly with the manure sample using a vortex for 15 s. Samples were then centrifuged at 10![[thin space (1/6-em)]](https://www.rsc.org/images/entities/char_2009.gif) 000 rpm for 5 min at 4 °C in 50 mL high speed Corning™ CentriStar™ Centrifuge Tubes (Tewksbury, MA) in an Allegra™ 25R Centrifuge from Beckman Coulter Inc. (Indianapolis, IN). The supernatant from each tube was measured for UV-vis absorbance to determine the soluble protein concentration in manure samples.
000 rpm for 5 min at 4 °C in 50 mL high speed Corning™ CentriStar™ Centrifuge Tubes (Tewksbury, MA) in an Allegra™ 25R Centrifuge from Beckman Coulter Inc. (Indianapolis, IN). The supernatant from each tube was measured for UV-vis absorbance to determine the soluble protein concentration in manure samples.
Different extraction buffer volumes and soluble protein extraction times for Bradford analysis were also compared. Around 3 g of each mixed manure sample was measured in a 50 mL centrifuge tube for each test which is consistent with previous experiments. Triplicates of each sample were prepared. 45 mL of simplified buffer was added and mixed using a vortex for 15 s or shaken at 125 rpm overnight at 25 °C to compare the effects of extraction time and mixing intensity. Another set of samples were added in 15 mL simplified buffer and mixed using a vortex for 15 s or shaken at 125 rpm overnight at 25 °C to compare the effects of extraction buffer volume. After vortex mixing or overnight shaking incubation, these tubes were centrifuged at 10000 rpm for 5 min at 4 °C. The absorbance of the supernatant from these samples was measured by UV-vis for protein concentration determination.
Crude protein analysis – total Kjeldahl nitrogen (TKN)
Approximately 3 g of RM, AD and DS samples were aliquoted in triplicates, diluted into 20 mL of Millipore water and tested for TKN using a SEAL AQ2 Discrete Analyzer (Mequon, WI). Additionally, to wash out the NPN, 3 g of each manure sample was aliquoted in triplicates and suspended in 3 mL 30% trichloroacetic acid (TCA) solution in a 50 mL centrifuge tube, mixed using a vortex for 15 s and let stand for 1 h. These samples were then centrifuged at 10000 rpm for 15 min. The supernatant of each sample was discarded and the pellet formed was re-suspended into 20 mL of Millipore water. TKN was then determined by digesting the samples on a SEAL Analytical BD50 Block digester with sulfuric acid and metal catalyst according to USEPA 351.2 (ref. 3) and then analyzing in the SEAL AQ2 based on EPA 136-A Rev. 4.3 Subsamples were filtered with Whatman 0.45 μm filters (Vernon hills, IL), acidified with 0.01 N sulfuric acid and then analyzed for ammonia and ammonium (NH3 + NH4+-N) using the SEAL AQ2 according to EPA-129-A Rev. 5.3 To investigate the content of ammonia nitrogen in the TKN analysis, triplicate samples of RM, AD and DS and their TCA precipitated pellets were oven-dried at 105 °C overnight and then tested for TKN and ammonia again using AQ2.
Batch samples – protein assay comparison between Bradford method and crude protein method
Five batches of manure samples from different treatment processes at Maple Leaf Dairy were divided into two portions: one was tested for soluble protein concentrations using the Bradford method as described previously (15 mL of simplified buffer, vortex briefly) and the other was frozen and sent to the Marshfield Ag Research Station at University of Wisconsin–Madison for total Kjeldahl nitrogen, ammonium-nitrogen, moisture content, total solids content (dry matter) and volatile solids content (percentage in the dry matter) analysis followed the standard protocols.3Statistical analysis
The statistical analysis in this study was conducted using R program version 0.98.1091 (Rstudio, Boston, MA). Comparison among different protein extraction methods was done using the t-test for independent samples.Results and discussion
Solids analysis
The solids content of RM, AD and DS manure samples were 4.87%, 2.79% and 5.61% respectively. These manure samples were selected to represent the important samples from different steps of manure treatment process and large range of solids content.Standard calibration curve and spikes in fresh manure samples
According to the standard calibration curves present in Fig. 1, 50 mM Tris buffer with Pierce™ Proteinase Inhibitor does not have notable effects on the absorbance when compared to BSA in Millipore water. These results confirmed the findings from previous studies that a low concentration of the extraction buffer would not affect the absorbance.25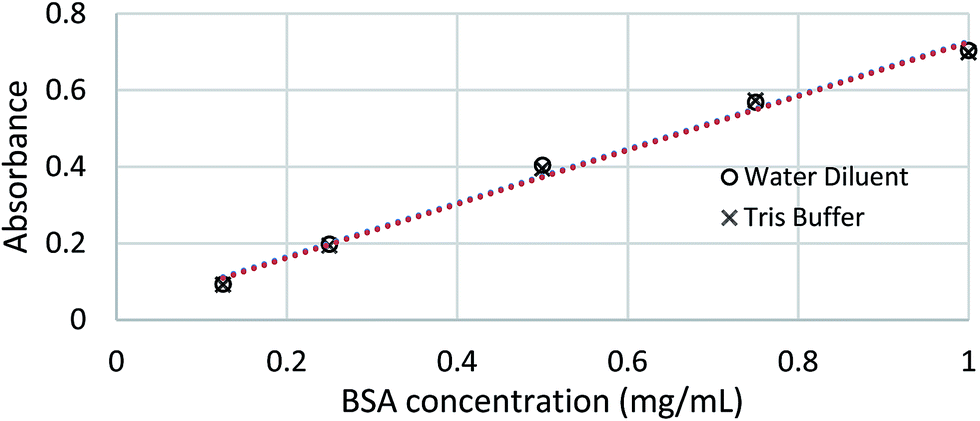 | ||
| Fig. 1 Comparison between standard calibration curves of BSA in water versus BSA in 50 mM Tris buffer. | ||
Three different types of each fresh manure sample including RM, AD and DS were spiked with BSA concentrations ranging of 0.00–0.25 mg mL−1. The UV-vis absorbance plotted against each spiked sample in the Quick Start™ dye showed similar linear behaviors (Fig. 2). These BSA spike results illustrate that Bradford method is acceptable for manure samples with its inherent dark colors, and works over a wide range of solids content (2–6%) and different manure types from treatment processes. The Bradford method also works with a broad range of concentrations of selected reagents, including ammonium sulfate up to 1 M, DTT up to 10 mM, potassium phosphate up to 0.5 M and urea up to 4 M.23 Most of the mineral nitrogen in the animal manure was in the nitrate form.26 The effect of various concentrations of nitrate has not been validated by the commercial protein analysis kit suppliers, including the Quick Start™ by Bio-Rad (Hercules, CA). The results of a series of sodium nitrate (NaNO3) spike with concentrations up to 1.25 M demonstrate that the manure soluble protein quantification method described in this study is compatible with high concentrations of nitrate (Fig. 3).
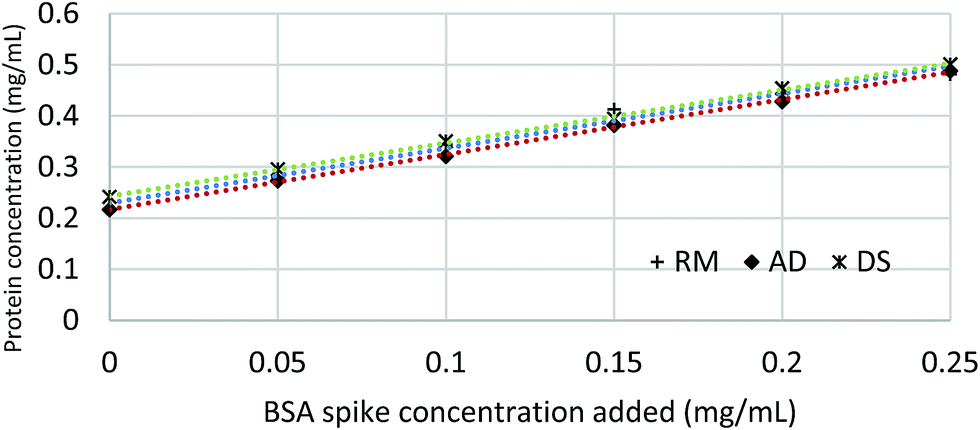 | ||
| Fig. 2 Fresh manure samples (RM, AD and DS) spiked in with a range of 0.00–0.25 mg mL−1 of BSA concentration (RM: y = 1.0719x + 0.2294, R2 = 0.999; AD: y = 1.0757x + 0.2168, R2 = 0.999; DS: y = 1.0381x + 0.2431, R2 = 0.999). | ||
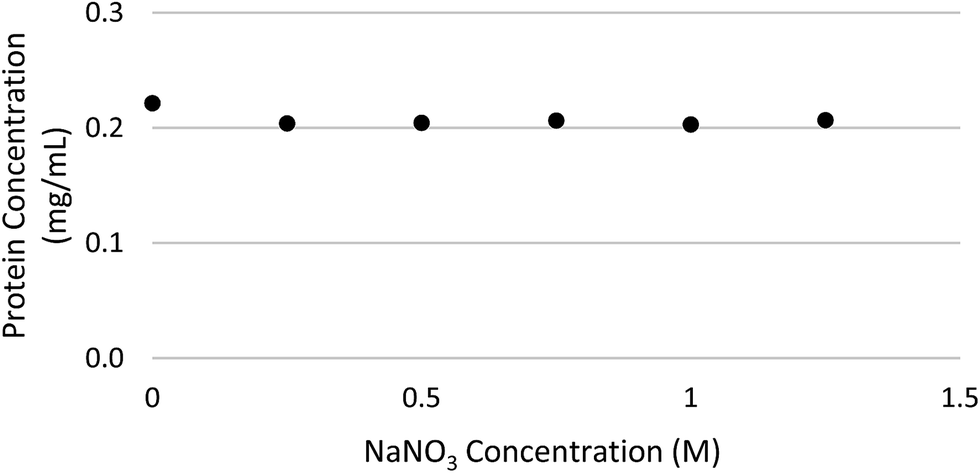 | ||
| Fig. 3 Manure samples spiked with NaNO3. | ||
Soluble protein extraction methods for Bradford analysis
Tris buffer is commonly used to extract proteins from plant tissue.27 Solubilization of protein from undigested plant tissue is often performed using Tris buffer with detergents such as SDS with disulfide bridges reduced by DTT.28 However, even 0.1% SDS has a significant effect on UV-vis absorbance compared to control samples.25 A simplified buffer of 50 mM Tris and Pierce™ Proteinase Inhibitor was compared to the traditionally complete buffer of 50 mM Tris, Pierce™ Proteinase Inhibitor, SDS and DTT. As shown in Fig. 4, the simplified protein extraction buffer yielded lower average protein extraction efficiency for high solids manure samples (RM and DS). In contrast, the average soluble protein extraction efficiency using the simplified buffer was higher for the low solids content manure sample (AD). The results suggest SDS and DTT may assist protein solubilizing when more solids exist in manure. The solids in dairy manure usually are fiber and insoluble minerals, thus the deposited protein were easier to be washed out when detergents added in the extraction buffer. These two buffers for protein quantification of RM and DS were not significantly different (at a 95% confidence interval) although the average of protein concentrations were slightly lower when using the simplified extraction buffer compared to the complete buffer. Similarly, there was no significant different (95% CI) between these two buffers for protein quantification of AD samples either. These results indicate that simplified protein extraction buffer for animal manure protein assay is a potential alternative to the traditional (complete) extraction buffer used for plant tissue and it is easier to be adapted for farm-level application.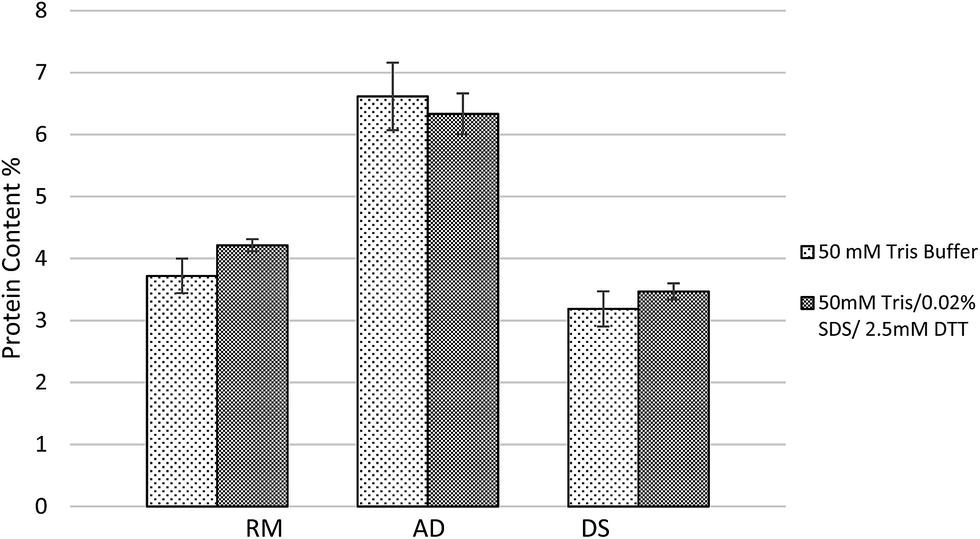 | ||
| Fig. 4 Comparison between simplified buffer and complete protein extraction buffer. | ||
The ratio of sample volume to protein extraction buffer volume and the extraction time were the important parameters to optimize manure protein extraction using Bradford method. According to Fig. 5, no significant differences (95% CI) were obtained for RM among the four treatments, including the 45 mL simplified buffer shaken overnight, 45 mL simplified buffer of 15 s vortexing, 15 mL simplified buffer shaken overnight, and 15 mL simplified buffer of 15 s vortexing. For the AD sample, the protein extraction efficiency using 45 mL simplified buffer shaken overnight was significant lower. For the DS sample, the protein extraction efficiency using 15 mL simplified buffer shaken overnight was significantly higher (95% CI) than the other extraction methods, which was possibly because the extraction of protein sediments and fiber associated protein was enhanced by the longer extraction time.
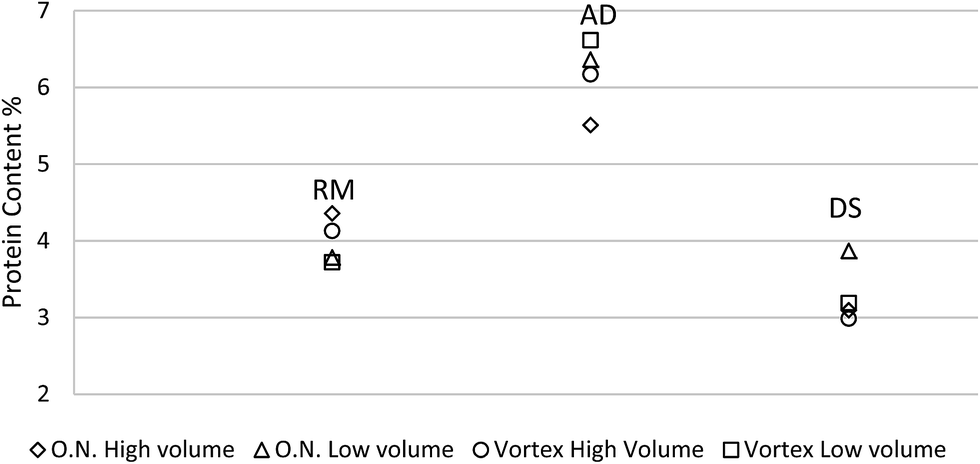 | ||
| Fig. 5 Comparison of four different protein extraction methods: overnight high volume (45 mL), overnight low volume (15 mL), vortex high volume (45 mL) and vortex low volume (15 mL). | ||
Total Kjeldahl nitrogen (TKN) and amino acid analysis (AAA)
The results from the TKN analysis demonstrated an estimate of crude protein concentration of each manure sample. The crude protein concentrations of RM, AD and DS samples were 14.8%, 22.4% and 18.7% respectively. Traditional methods used to measure protein concentrations in dairy manure (TKN) include NPN such as urea and ammonia. These methods usually overestimate the protein concentration, especially when the ammonia concentration is high. Trichloroacetic acid (TCA) has been used in protein purification since TCA stops enzymatic reactions and precipitates the proteins.29 The TKN results that washed with TCA precipitation were much lower than TKN results using the original fresh manure samples, as seen in Fig. 6. Manure samples tested after being dried in an oven had a significantly lower TKN due to the ammonia evaporation during drying.30 Using dry dairy manure samples for TKN measurement is more accurate for protein determination because ammonia nitrogen is excluded.31 The ammonia nitrogen in original RM, AD and DS samples were 3.2%, 4.2% and 3.0% of the dry matter. In contrast, the ammonia nitrogen in oven dried RM, AD and DS samples were 0.002%, 0.005% and 0.002% of the dry matter which are negligible. Although washing the dry manure with TCA eliminated most of the NPN in animal manure, there is a possibility that some NPN residue still existed. Therefore, using the TKN value in dry manure washed with TCA for protein estimation is likely slightly higher but close to the “real” protein concentration. In conclusion, to better estimate protein content in manure samples using crude protein analysis method, the samples should be either oven dried, TCA washed or subtracted ammonia nitrogen.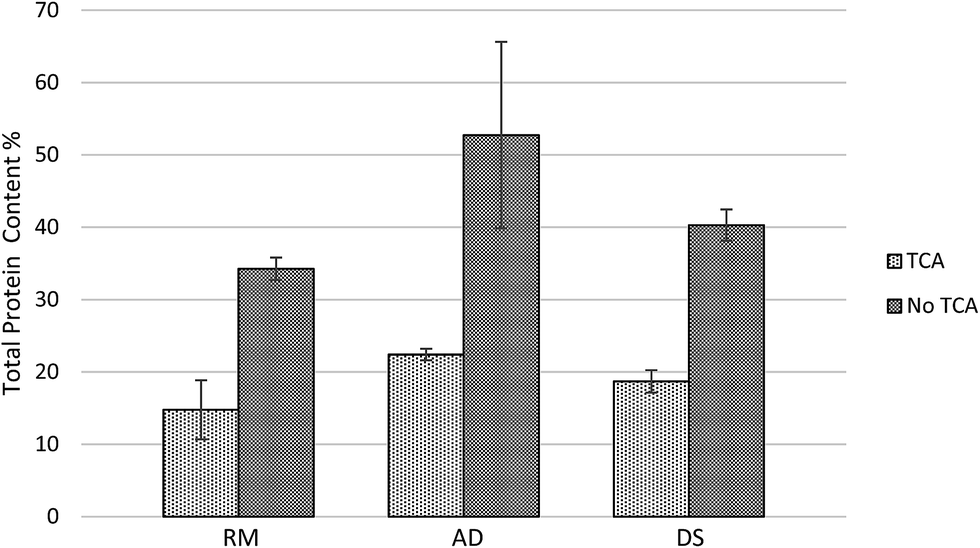 | ||
| Fig. 6 Protein concentration analysis in fresh dairy manure samples (RM, AD and DS) by total Kjeldahl nitrogen method. | ||
The amino acid analysis (AAA) is considered to be a more accurate protein quantification method since it is based on amino acid data. The protein concentration of the DS samples measured by AAA was 4 times higher than that measured by the Bradford method (Fig. 7). This is likely because there were more solids in sludge samples, which contained higher amount protein sediments and fiber associated protein. These proteins are harder to extract and detect using the Bradford method. Since manure samples contain large amount contaminants that can hinder the actual analysis, they must be subjected to multiple purification steps before analysis. Because of this, the manure protein concentration may be underestimated, and the manure protein estimation using AAA is likely slightly lower but close to “real” protein concentration. The “real” protein concentration should be within the range of the AAA results and the results calculated from corrected TKN. As expected, the results in Fig. 7 revealed that crude protein value was the highest among these three protein assays but it was likely overestimated. These results also suggest the Bradford method has low protein extraction efficiency for high solids samples and AAA is a more accurate assay for manure protein concentration determination. A protein range can be estimated by the results of crude protein assay and Bradford assay if AAA is not available or feasible for some circumstances.
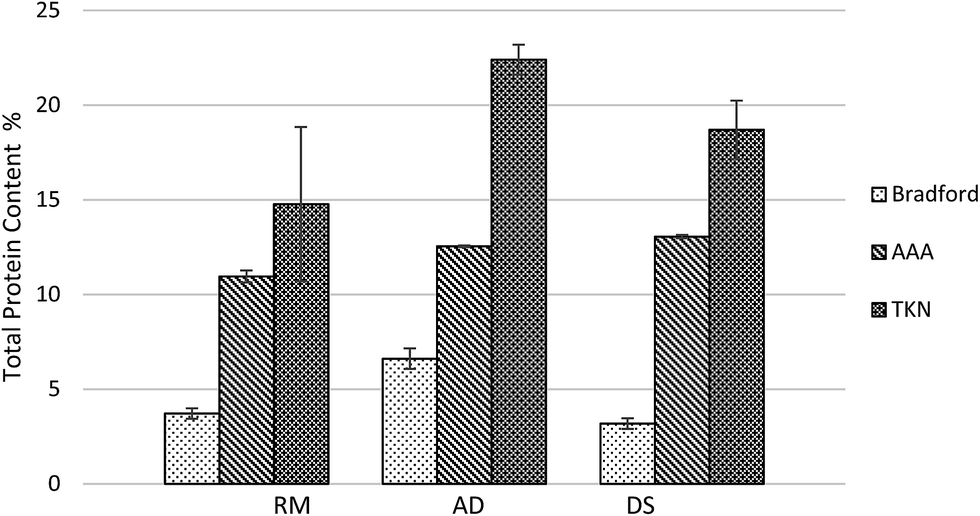 | ||
| Fig. 7 Comparison of dairy manure protein assays. | ||
Comparison between Bradford method and total Kjeldahl nitrogen method on batch samples
Relationships between soluble protein extraction efficiency and solids contents were studied. The soluble protein extraction efficiency was defined in eqn (1). | (1) |
As shown in Fig. 8, manure samples with higher volatile solids contents and higher total solids contents yielded lower soluble protein extraction efficiencies. This result is likely related to the fiber content in the manure samples. Also, the observations to the both end of the curves showed in Fig. 8a and b are interesting. When the solids content was high, the protein extraction efficiency was very low and reached a plateau. It is possibly because of the majority of the component in the high solids manure are large fibers which have not been digested or degraded. The protein associated with these fibers is the most difficult to be solubilized and extract. In addition, the dairy manure samples with highest solids content are usually dry samples such as lagoon dry solids. Protein can be used as adhesive material which applied as coating on fibers for various purpose such as wood fiberboard preparation.32 The air-dried protein coating on fiber is very stable and usually insoluble in water. Furthermore, protein and nitrogen in excessively heated samples are usually unavailable to animals and thus inaccessible for protein extraction. These facts may explain why the low protein extraction efficiency obtained from dry manure samples in this study. In contrast, the organic matters in manure samples of lowest solids content and volatile solids content are usually very small fibers and other soluble contents including soluble protein.33 This feature made Bradford protein analysis a very fast and accurate method that is suitable for protein determination in low solids content manure samples.
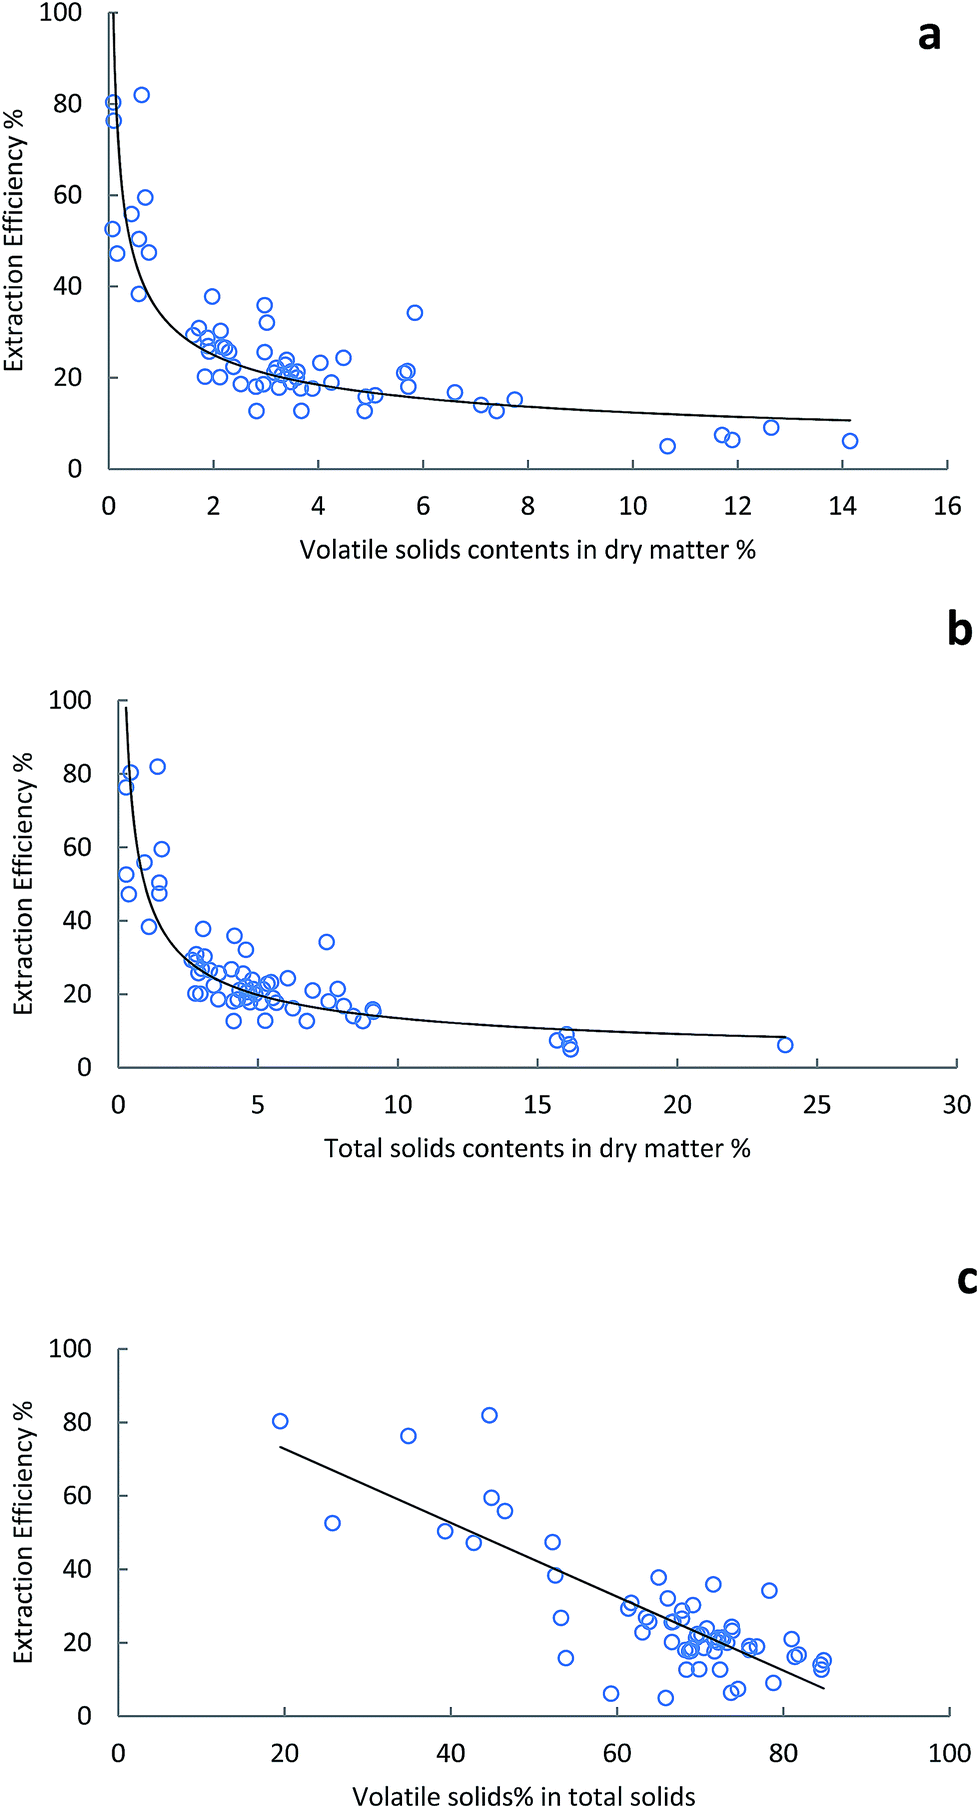 | ||
| Fig. 8 Protein extraction efficiency in manure samples with various amounts of (a) volatile solids, (b) total solids and (c) volatile solids% in total solids. | ||
Additionally, Fig. 8c demonstrated a linear relationship that increasing volatile solids percentage in the total solids yielded decreasing protein extraction efficiency. Usually, the manure samples with higher solids content have higher volatile solids percentage, thus the results in Fig. 8c were consistent with the results shown in Fig. 8a and b. The R2 of protein extraction efficiency versus volatile solids contents, total solids contents and the percentage of volatile solids in total solids using R program (Rstudio, Boston, MA) were 0.81, 0.78 and 0.67 respectively. These equations could be potentially used for total nitrogen and protein concentration estimation by plotting the soluble protein results in when total solids and/or volatile solids content are available. The protein concentration in dairy manure samples with very low solids content could be considered very close to the soluble protein concentration measured by Bradford method using UV-vis described in this study.
To better understand the interactions of the protein and fiber in manure system, related researches have been reviewed. The fiber content including cellulose, hemicellulose, and lignin in manure can be determined by the analysis of neutral detergent fiber (NDF), acid detergent fiber (ADF) and acid detergent lignin (ADL).34 Protein associated with the NDF fraction was likely to be more difficult to be extracted into the extraction buffer because the reagents have limited access to the cell wall components and the cell contents.35 The protein bound to ADF, such as acid detergent fiber crude protein (ADIN), is also difficult to extract into the soluble form and it is usually considered to be unavailable to animals.36 ADIN is defined as the nitrogen remaining in the acid detergent fiber residue, it occurs naturally in plant material and animal manure. It is generally analyzed to estimate the heat damage that occurred during storage or processing. Research indicates that recovery of ADIN in feces was poor, which explains the lower soluble protein extraction efficiency in high fiber and solids content dairy manure samples.37
Conclusion
Dairy farms often feed high crude protein diets to ensure a sufficient supply required for maximal milk and protein production of dairy cows. However, overfeeding crude protein is excreted in the urine or in the manure. It reduces profit margins when over feeding crude protein since it lowers the nitrogen utilization efficiency and the high protein diets are relatively of high cost.38 Animal feeding including the concentration of crude protein can affect the amount and route of nitrogen excretion such as via fecal or urinary. Currently, common method for estimating manure nitrogen contents is total Kjeldahl nitrogen but it often needs to be corrected by subtracting ammonia nitrogen. It is a sophisticated and time consuming procedure which usually over estimates the nitrogen contents according to the results discussed in this paper. The method developed and validated using UV-vis based on Bradford method in this study can be easily adapted at a farm-level with simple calculation to monitor manure soluble protein and estimate crude protein concentration in order to control protein feeding in the diet and to manage the amount of the manure as fertilizer when spread to the field. In addition, the soluble protein measured using Bradford method could be beneficial for determining the value of manure as nutrient media or for other purposes.In conclusion, a manure protein concentration measurement assay adopted from Bradford method using UV-vis has been validated in this study. It has been proven to be compatible to measure protein concentration in manure samples and it is effective and relatively easy to perform. The method described in this study would be used as a supplement of traditional protein concentration quantification, especially when the solids content in manure sample is low. The results of comparing multiple on-farm treatment samples suggested possible relationships for estimating manure total protein concentration using soluble protein concentration based on manure solids content.
Acknowledgements
We gratefully acknowledge the United States Department of Agriculture-National Institute of Food and Agriculture for its financial support (USDA BRDI Grant number 2012-10006-19423).References
- G. Koneswaran and D. Nierenberg, Environ. Health Perspect., 2008, 116, 578 CrossRef PubMed.
- H. Zhang, T. H. Dao, N. T. Basta, E. A. Dayton and T. C. Daniel, Remediation techniques for manure nutrient loaded soils, Animal Agriculture and the Environment: National Center for Manure and Animal Waste Management White Papers, American Society Agriculture Biological Engineers, St. Joseph, MI, 2006, pp. 483–503 Search PubMed.
- J. Peters, S. Combs, B. Hoskins, J. Jarman, J. Kovar, M. Watson, A. Wolf and N. Wolf, Recommended methods of manure analysis, University of Wisconsin, Coop. Ext. Publishing, Madison, WI, 2003, Publication A3769 Search PubMed.
- X. Cao and W. Harris, Bioresour. Technol., 2010, 101, 5222–5228 CrossRef CAS PubMed.
- S. Chen, W. Liao, C. Liu, D. C. Elliott, M. D. Brown and A. E. Solana, Value-added chemicals from animal manure, Pacific Northwest National Laboratory, 2003 Search PubMed.
- C. O. Tuck, E. Pérez, I. T. Horváth, R. A. Sheldon and M. Poliakoff, Science, 2012, 337, 695–699 CrossRef CAS PubMed.
- R. Kumar, V. Choudhary, S. Mishra, I. Varma and B. Mattiason, Ind. Crops Prod., 2002, 16, 155–172 CrossRef CAS.
- A. Burkovski and R. Krämer, Appl. Microbiol. Biotechnol., 2002, 58, 265–274 CrossRef CAS PubMed.
- W. Yao, X. Wu, J. Zhu, B. Sun and C. Miller, Bioresour. Technol., 2010, 101, 4132–4138 CrossRef CAS PubMed.
- N. G. Hall and H. C. Schönfeldt, Food Chem., 2013, 140, 608–612 CrossRef CAS PubMed.
- D. Jones, V. Munsey and L. Walker, J. Assoc. Off. Agric. Chem., 1942, 25, 118–120 Search PubMed.
- F. Mariotti, D. Tomé and P. P. Mirand, Crit. Rev. Food Sci. Nutr., 2008, 48, 177–184 CrossRef CAS PubMed.
- A. Bhattacharya and J. Taylor, J. Anim. Sci., 1975, 41, 1438–1457 CAS.
- H. Greenfield and D. Southgate, Production, management and use, Food and Agricultural Organization of the United Nations, Rome, 2nd edn, 2003 Search PubMed.
- D. E. Otter, Br. J. Nutr., 2012, 108, S230–S237 CrossRef CAS PubMed.
- M. Fountoulakis and H.-W. Lahm, J. Chromatogr. A, 1998, 826, 109–134 CrossRef CAS.
- M. M. Bradford, Anal. Biochem., 1976, 72, 248–254 CrossRef CAS.
- N. Carlsson, A. Borde, S. Wölfel, B. Åkerman and A. Larsson, Anal. Biochem., 2011, 411, 116–121 CrossRef CAS PubMed.
- H. Barbosa, N. K. Slater and J. C. Marcos, Anal. Biochem., 2009, 395, 108–110 CrossRef CAS PubMed.
- R. Labatut and C. Gooch, Proceedings of Got Manure? Enhancing Environmental and Economic Sustainability, 2012, pp. 209–225 Search PubMed.
- H. B. Møller, V. Moset, M. Brask, M. R. Weisbjerg and P. Lund, Atmos. Environ., 2014, 94, 36–43 CrossRef PubMed.
- M. Guttenberger, Protein determination, Academic Press, Orlando, FL, 1998 Search PubMed.
- Bio-Rad Laboratories, Inc., "Quick Start™ Bradford Protein Assay" Instruction Manual (4110065 Rev A), 19 May 2014, http://www.bio-rad.com/webroot/web/pdf/lsr/literature/4110065A.pdf Search PubMed.
- W. Horwitz and G. W. Latimer, Official methods of analysis of AOAC International, AOAC International, Gaithersburg, MD, 18th edn, 2006 Search PubMed.
- N. J. Kruger, in The protein protocols handbook, Springer, 2009, pp. 17–24 Search PubMed.
- R. Atiyeh, C. Edwards, S. Subler and J. Metzger, Bioresour. Technol., 2001, 78, 11–20 CrossRef CAS.
- F. Granier, Electrophoresis, 1988, 9, 712–718 CrossRef CAS PubMed.
- J. R. Wisniewski, A. Zougman, N. Nagaraj and M. Mann, Nat. Methods, 2009, 6, 359 CrossRef CAS PubMed.
- R. J. Mans and G. D. Novelli, Arch. Biochem. Biophys., 1961, 94, 48–53 CrossRef CAS.
- W.-Z. Liang, J. J. Classen, S. B. Shah and R. Sharma-Shivappa, Water, Air, Soil Pollut., 2014, 225, 1–9 CrossRef CAS.
- C.-W. Choi, S. Ahvenjärvi, A. Vanhatalo, V. Toivonen and P. Huhtanen, Anim. Feed Sci. Technol., 2002, 96, 203–220 CrossRef CAS.
- X. Li, Y. Li, Z. Zhong, D. Wang, J. A. Ratto, K. Sheng and X. S. Sun, Bioresour. Technol., 2009, 100, 3556–3562 CrossRef CAS PubMed.
- S. Chen, Z. Wen, W. Liao, C. Liu, R. Kincaid, J. Harrison, D. C. Elliott, M. D. Brown and D. J. Stevens, Appl. Biochem. Biotechnol., 2005, 124, 999–1015 CrossRef.
- H. Goering and P. Van Soest, Forage fiber analysis (apparatus, reagents, procedures, and some application), Agric. Handbook, ARS-USDA, Washington, D.C., 1970, No. 379 Search PubMed.
- S. Huang, W. Sauer and B. Marty, J. Anim. Sci., 2001, 79, 2388–2396 CAS.
- A. Aderibigbe, C. Johnson, H. Makkar, K. Becker and N. Foidl, Anim. Feed Sci. Technol., 1997, 67, 223–243 CrossRef CAS.
- B. Britton, T. Klopfenstein, R. Cleale, F. Goedeken and V. Wilkerson, Methods of estimating heat damage in protein sources, Proc. Distillers Feed Conf., 1986, 41, 67–75 Search PubMed.
- J. Colmenero and G. Broderick, J. Dairy Sci., 2006, 89, 1704–1712 CrossRef CAS.
| This journal is © The Royal Society of Chemistry 2015 |