
 Open Access Article
 This Open Access Article is licensed under a
 Creative Commons Attribution 3.0 Unported Licence
Direct detection of histamine in fish flesh using microchip electrophoresis with capacitively coupled contactless conductivity detection†
Leigh D.
Thredgold
a,
Amanda V.
Ellis
a and
Claire E.
Lenehan
*b
aFlinders Centre for Nanoscale Science and Technology, Flinders University, GPO Box 2100, Adelaide 5001, Australia
bSchool of Chemical and Physical Sciences, Flinders University, GPO Box 2100, Adelaide 5001, Australia. E-mail: claire.lenehan@flinders.edu.au
First published on 12th January 2015
Abstract
We demonstrate the use of microchip electrophoresis with capacitively coupled contactless conductivity detection (C4D) for the direct detection of histamine in fish flesh samples. Optimization of the background electrolyte (BGE) conditions showed that a competitive detection limit of 0.43 mg L−1 was achievable using a mixed 2-[4-(2-hydroxyethyl)piperazin-1-yl]ethanesulfonic acid and histidine BGE at pH 6.03. The developed method was successfully applied to the determination of spiked histamine in yellowfin tuna flesh samples with recoveries ranging from 88.8 to 112.5% with relative standard deviations below 13%. Further versatility of the method was demonstrated with the analysis of histamine levels in four frozen fish samples, purchased from a local supermarket, showing all contained concentrations well below the Australian and New Zealand Food Standards Code maximum limit for decomposition (200 μg g−1). The reported method eliminates the need for analyte derivatization associated with common optical detection techniques and the use of C4D offers increased portability. Further, this approach could easily be adapted for the detection of histamine in other food and beverage samples.
Introduction
Histamine is a primary amine formed by the decarboxylation of the amino acid L-histidine1 and belongs to a group of compounds known as biogenic amines (BAs). BAs are synthesized by microbial, vegetable or animal metabolisms and are known to be the causative agents in a number of food poisoning cases; which is due to their ability to initiate a variety of pharmacological reactions.1,2 High levels of BAs during food intake are unable to be metabolized by the body to sufficiently eliminate the toxins, leading to food poisoning conditions ranging from migraines to hypertension.3,4 BAs can be present in certain foods, such as some fruit and vegetables (e.g., spinach and bananas) with concentrations dependant on maturity;5 however they are normally formed as a result of uncontrolled microbial action,5 resulting in elevated levels in food and beverage products after degradation. This is usually as a result of poor quality raw materials, contamination or unsuitable conditions during food processing and storage.5 Typically, elevated levels of BAs above safe limits are found in fish and fish products, dairy products, meat and meat products as well as fermented products such as vegetable, soy and alcoholic beverages.2,3 The maximum limits are BA dependant with important BAs present in food and beverages including histamine, β-phenylethylamine, tyramine, tryptamine, putrescine, cadaverine, spermine and spermidine.3,6In particular histamine has been reported as the toxin responsible for scombroid fish poisoning7–9 a type of food poisoning arising from the incorrect handling and storage of scombroid fish products.10 The current maximum limit for histamine in certain fish and fish products ranges from 50 μg g−1 in the United States11 up to 100 μg g−1 for decomposition or 200 μg g−1 as a result of hygiene and handling in Australia and New Zealand.12 Elevated levels of histamine have also been reported in fermented wines.6,13 Therefore, simple portable quantitative methods for the determination of histamine levels in food and beverage products are of increasing interest to allow monitoring of food spoilage and quality during processing and storage.
Numerous quantification methods for biogenic amines, including histamine, have been developed and are the subject of multiple reviews.14–16 The most common approaches to BA detection have been coupling fluorescence or UV based detection with analytical separation methods such as high performance liquid chromatography (HPLC)17–19 and capillary electrophoresis (CE).20–22 The lack of chromophore in histamine is the major drawback of these methods which means derivatization with other highly fluorescent or UV active compounds is required to achieve adequate sensitivity.15,16 Often this results in time intensive indirect analysis methods. LC methods have also been coupled with mass spectrometric (MS) detection23,24 for the analysis of histamine but this still required histamine derivatization. CE has also been coupled with chemiluminescence,25 amperometry26 and conductivity27 detection systems. Whilst providing sensitive detection, CE techniques are restricted to laboratory settings and cannot be deployed for simple in-field analysis in their traditional format. Further analytical methods that have been reported for the determination of histamine include thin layer chromatography (TLC),28,29 gas chromatography-mass spectrometry (GC-MS)30,31 and biosensor/assay based techniques.32,33 Of these methods TLC is the most simple and does not require complex instrumentation but is often time consuming and only semi-quantitative.15 GC is not commonly applied for BA analysis with only one example not requiring derivatization.30 Biosensors are simple, portable, low cost and have inherently short analysis times; however, most only produce semi-quantitative determinations. Ideally, the timely and efficient monitoring of food quality and spoilage would be done using a simple portable technique that negates the need for derivatization.
More recently, the use of portable analytical devices coupled with different detection techniques have been reported for the quantification of a range of BAs, including histamine. Microchip electrophoresis with indirect fluorescence detection has been reported for the detection of histamine and other common BAs in fermented beverages,34,35 fish products36 and standards.37,38 A novel chemiluminescene detection system has also been used with microchip electrophoresis for the indirect detection of BAs including histamine in urine samples.39 Whilst the reported systems symbolize a shift towards the desire to achieve greater portability most still contained laboratory scale detection components and require a derivatization step. There remains a need for the development of a truly portable device with miniaturized detection components for quantitative histamine analysis.
To date microchip electrophoresis with capacitively coupled contactless conductivity detection (C4D) has only been demonstrated for the detection of small volatile aliphatic amines40 in seafood and amines present in pharmaceutical formulations.41 We present a method for the direct detection of histamine using a previously reported microchip electrophoresis system with C4D![[thin space (1/6-em)]](https://www.rsc.org/images/entities/char_2009.gif) 42 that employs a simpler electrode integration approach than the previously reported systems for the analysis of amines using microchip C4D.40,41 The optimal electrolyte conditions to achieve histamine resolution from other BAs and sample matrix are comprehensively discussed. The new approach developed was then demonstrated for the quantitative analysis of histamine levels in four frozen fish flesh samples in combination with a standard extraction procedure.
42 that employs a simpler electrode integration approach than the previously reported systems for the analysis of amines using microchip C4D.40,41 The optimal electrolyte conditions to achieve histamine resolution from other BAs and sample matrix are comprehensively discussed. The new approach developed was then demonstrated for the quantitative analysis of histamine levels in four frozen fish flesh samples in combination with a standard extraction procedure.
Experimental
Samples, reagents and solutions
All chemicals were of analytical reagent grade, purchased from Sigma-Aldrich, Australia and used as received. The biogenic amines, namely histamine and tyramine were obtained in their natural form whereas 2-phenylethylamine was obtained as its hydrochloride salt. Background electrolyte (BGE) components 2-(N-morpholino)ethanesulfonic acid (MES), 2-amino-2-hydroxymethyl-propane-1,3-diol (Tris), 2-(cyclohexyl amino)ethanesulfonic acid (CHES) and 3-(cyclohexylamino)-1-propanesulfonic acid (CAPS) were investigated before the final optimized BGE solution for electrophoretic separation was determined to be 2-[4-(2-hydroxyethyl)piperazin-1yl] ethanesulfonic acid (HEPES) (50 mM) and histidine (His) (5 mM) in 5% v/v isopropanol (pH = 6.03). Standard stock solutions of histamine, tyramine and 2-phenylethylamine at concentrations of 200 mg L−1 were prepared by dissolving the respective amines in 5% v/v isopropanol. Working standard solutions containing the three biogenic amines were freshly prepared by dilution of the stock solutions with BGE. Frozen fish samples were purchased from a local supermarket and stored at −20 °C prior to thawing at 4 °C before extraction.Electrophoresis instrumentation and procedure
Electrophoretic separations were performed using a previously described homemade poly(dimethylsiloxane) (PDMS) microchip system equipped with C4D detection using injected gallium electrodes.42,43 A rectangular PDMS microchannel with cross sectional dimensions 100 μm × 40 μm and a length of 57 mm (37 mm effective) was used for electrophoretic separations. Standards and samples were introduced electrokinetically using an applied voltage of 1 kV for a period of 5 s. The separation potential was 1.2 kV and the C4D operated at 216 kHz (sinusoidal) and 10 V (peak to peak amplitude). Before the first analysis of the day the PDMS microchannels were sequentially washed with Milli-Q water (18.2 MΩ cm) for 2 min, BGE containing n-dodecyl β-D-maltoside (DDM) (0.4 mM) for 10 min, Milli-Q water for 2 min and finally BGE for 5 min. After each analysis the microchannels were flushed with BGE for 1.5 min. All analyzes were carried out at ambient temperature (20–25 °C).A standard curve for histamine was obtained by injecting (in triplicate) five working standards containing histamine at concentration levels ranging from 1.07 mg L−1 to 8.62 mg L−1. The histamine peak height from the resulting electropherograms were determined and plotted versus analyte concentration. A linear regression was performed on the standard curve using the least-squares method and the obtained regression equations were used to estimate the concentration of histamine in the fish flesh samples. Peak integration and statistical analysis were carried out with the software OriginPro 9.0 (OriginLab, Northhampton, MA, USA).
Histamine extraction procedure
Extractions were performed using 2 g of homogenized yellowfin tuna flesh weighed directly into 10 mL capped polyethylene centrifuge tubes. For recovery experiments, a standard solution containing histamine (8.07 g L−1) was used to spike the samples. Histamine extraction was then performed using a method modified from Hwang et al.30 Namely, 10 mL of methanol alkalized with 40 μL of concentrated ammonia (28–30%) was added to the sample tubes. Solutions were manually homogenized for 1 min followed by sonication for 5 min. Samples were then centrifuged for 5 min at 3000 rpm to separate the solid fish flesh matrix from the aqueous phase. After centrifugation, 2–5 mL of supernatant was removed from each tube via micropipette and evaporated to dryness under nitrogen. Samples were then reconstituted in the same volume of Milli-Q water and filtered through a 0.45 μm nylon membrane prior to solid phase extraction (SPE) cleanup.SPE cleanup procedure
SPE cleanup of aqueous histamine extracts were performed using C18 cartridges (Phenomonex, Australia). Prior to cleanup 1 mL of filtered aqueous extract was alkalized with 10 μL of concentrated ammonia solution (28–30%) to increase histamine retention on the C18 column. The cartridges were first conditioned and equilibrated with 1.2 mL of methanol and Milli-Q water, respectively. This was followed by loading of 1 mL of the alkalized aqueous extract, washing with 5 mL of Milli-Q water and elution of histamine with 1 mL of BGE. This produced a matrix matched histamine extract ready for injection into the microchip electrophoresis device. Where required fish extracts were diluted with BGE prior to injection to ensure they fitted within the reported linear range for histamine analysis.Results and discussion
Investigation of suitable BGE for BA analysis
Initial investigations focussed on finding a suitable BGE for histamine analysis in PDMS microchips with conductivity detection. Traditionally, low conductivity buffer systems containing MES and histidine are used for the separation of cationic mixtures in microchip electrophoresis devices coupled with C4D. However; attempting to use this BGE with 3% v/v isopropanol, to prevent the BAs from precipitating out of solution in the microchannels, yielded very low signals for all three analytes (Fig. 1(A)). | ||
| Fig. 1 Resulting electropherograms using (A) MES/histidine BGE, (B) Tris/histidine BGE and (C) HEPES–histidine BGE of each BA (a) histamine, (b) tyramine and (c) 2-phenylethylamine. Operating conditions: microchip 57/37 mm total/effective length; injection voltage 1.0 kV for 5 s; separation voltage 1.4 kV. C4D detector: sine waveform of 216 kHz 10 Vp–p. | ||
Therefore, HEPES, Tris, CHES and CAPS were investigated for their suitability for this application. These alternatives were chosen due to their structural similarities and range of pKa values, as demonstrated in Table 1.
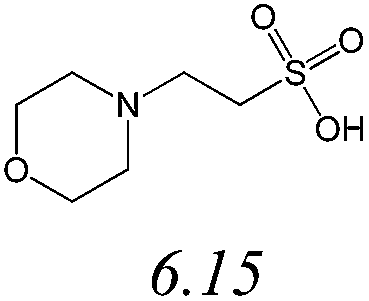
| BGE# | Structure and pKa | pH | Mean* conductivity (μS) | Mean* μEOF (cm2 V−1 S−1) |
|---|---|---|---|---|
| a #(15 mM), *(n = 3). | ||||
| MES/His |
|
6.26 | 359 ± 3 | 2.64 ± 0.07 × 10⁻⁴ |
| HEPES–His |

|
6.97 | 109 ± 2 | 4.47 ± 0.04 × 10⁻⁴ |
| Tris/His |

|
8.93 | 177 ± 2 | 4.31 ± 0.03 × 10⁻⁴ |
| CHES/His |
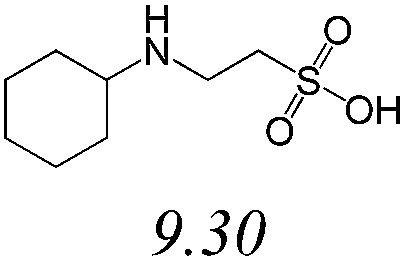
|
7.72 | 27.0 ± 0.1 | 3.80 ± 0.08 × 10⁻⁴ |
| CAPS/His |

|
7.87 | 21.1 ± 0.2 | 6.29 ± 0.28 × 10⁻⁴ |
Initially the conductivity and electro-osmotic flow mobility (μEOF) of the BGEs were determined to assess their properties in PDMS microchips with C4D (Table 1). All of the investigated alternatives produced BGEs with lower conductivities and larger μEOFs than that of MES/histidine Table 1. Lower conductivities were considered advantageous as using these BGE systems in conjunction with C4D should result in improved signal to noise ratios, attributed to lower background conductivity levels, and potentially improved detection limits. Subsequent analysis of individual BA standards using the alternate BGE systems found that both CHES/His and CAPS/His were unsuitable for this analysis as a result of distorted peak shapes. Of the remaining alternatives Tris/His produced only a low intensity signal for histamine and no discernable signal for other BAs (Fig. 1(B)) whereas HEPES–His produced signals for all analytes greater than that originally observed using MES/His BGE (Fig. 1(C)). As a result HEPES–His was chosen as the preferred BGE for further optimization.
Optimization of HEPES–histidine BGE
Fig. 2 shows that the three BA analytes were poorly resolved using the equimolar 15 mM HEPES–His BGE with 3% v/v isopropanol. In order to produce the best sensitivity and resolution in electrophoretic techniques careful optimization of BGE conditions is often required. Two commonly optimized variables include the addition of organic modifiers and alteration of the BGE ionic strength. These act to alter the μEOF of the system or the electrophoretic mobility of specific analytes. Initially, the concentration of isopropanol added as an organic modifier to the 15 mM HEPES–His BGE was sequentially increased to investigate its effect on BA resolution. Fig. 2 shows shifting of the BA peaks to slightly higher migration times as a result of increasing isopropanol concentration from 3% v/v (28 s and 30 s) to 10% v/v (36 s and 39 s). Despite this small shift, BA resolution was not significantly improved and higher concentrations were not trialled due to the incompatibility of organic solvents with PDMS microchips.44 Overall, minimal improvement in BA resolution was observed upon increasing isopropanol concentration. Therefore, for all further experiments the intermediate concentration of 5% v/v isopropanol was used as organic modifier in the BGE. | ||
| Fig. 2 Electropherograms of a standard containing the biogenic amines, namely histamine (10 mg L−1), tyramine (10 mg L−1) and 2-phenylethylamine (10 mg L−1) in 15 mM HEPES–His using BGE containing (a) 3% v/v isopropanol, (b) 5% v/v isopropanol and (c) 10% v/v isopropanol as organic modifier. Operating conditions: microchip 57/37 mm total/effective length; injection voltage 1.0 kV for 5 s; separation voltage 1.4 kV. C4D detector: sine waveform of 216 kHz 10 Vp–p. | ||
An additional variable that is easily manipulated to achieve enhanced resolution is BGE ionic strength. For this application low conductivity BGEs were essential due to the use of C4D. This ruled out the addition of high conductivity additives to increase this parameter. Therefore, altering ionic strength was achieved two ways. Firstly by altering the ratio of the BGE components whilst maintaining the same overall concentration and secondly, after the ratio was optimized, by increasing the concentration of both BGE components whilst maintaining the same overall ratio. The electropherograms that resulted from altering the BGE component ratio are shown in Fig. 3.
 | ||
| Fig. 3 Electropherograms of a standard containing the biogenic amines, namely histamine (10 mg L−1), tyramine (10 mg L−1) and 2-phenylethylamine (10 mg L−1) using BGE with HEPES–His component ratios of (a) 1:5 (pH 7.23), (b) 1:2 (pH 6.94), (c) 1:1 (pH 6.97), (d) 2:1 (pH 6.59) and (e) 5:1 (pH 6.32). Operating conditions as in Fig. 2. | ||
Increasing the HEPES–His ratio was expected to reduce the overall ionic strength of the BGE as zwitterions are known not to contribute to the ionic strength of a solution.45 However, upon incrementally increasing the ratio from 1:5 to 2:1 the resolution of the histamine peak from tyramine and 2-phenylethylamine peaks improved with baseline resolution achieved using a final ratio of 5:1 (Fig. 3). The increased resolution observed was attributed to the ability of the zwitterions to interact electrostatically with solvent and other charged molecules45 combined with the decreased pH achieved at higher HEPES–His ratios.
To study the effect of increasing the overall BGE ionic strength the molar concentration of HEPES and histidine was increased incrementally whilst maintaining the previously optimised ratio. A trend of greater resolution of the three BAs was observed as the BGE molar concentration was increased (see ESI Fig. S1†). However, increased resolution was at the expense of peak height. As histamine was fully resolved from tyramine and 2-phenylethylamine using the intermediate concentrations of 50 mM HEPES and 10 mM histidine this BGE was chosen for additional optimization. Further optimization was performed by again investigating the ratio of HEPES–His at the higher BGE concentration. Specifically, molar concentration ratios of 5:1, 10:1 and 20:1 were trialled (see ESI Fig. S2†). It was found that a ratio of 10:1 v/v corresponding to 50 mM HEPES and 5 mM histidine provided optimum resolution and peak heights for the analysis of histamine (Fig. 4).
 | ||
| Fig. 4 Electropherogram of a standard containing the biogenic amines, namely histamine (10 mg L−1), tyramine (10 mg L−1) and 2-phenylethylamine (10 mg L−1) using the final optimised BGE containing 50 mM HEPES and 5 mM histidine in 5% v/v isopropanol (pH: 6.03). Operating conditions as in Fig. 2. | ||
Direct histamine quantification
After optimization of the BGE the developed ME method was applied to a series of histamine calibration standards (1.07 mg L−1 to 8.62 mg L−1) to determine its suitability for quantitative histamine analysis. The resulting analytical figures of merit are shown in Table 2. The relative standard deviation (%RSD) of migration time was 1.32 (n = 15) reflecting the excellent repeatability and analytical performance of the system for quantitative analysis. The linearity of the standard curve over the evaluated concentration range was confirmed with an R2 value of 0.997. The instrumental limit of detection (LOD) and limit of quantification (LOQ) are comparable to other reported methods for the direct detection of histamine using electrophoresis.21,27 Whilst more sensitive detection using indirect methods with electrophoresis have been reported,22,36,39 direct detection using conductivity was considered advantageous as it does not require lengthy histamine derivatization steps prior to analysis. Further, the reported LOD (0.43 mg L−1) was only slightly higher than LODs reported for the analysis of volatile aliphatic amines in seafood (0.041–0.40 mg L−1) using microchip electrophoresis with C4D.40 However, the microchip fabrication and C4D electrode integration approaches utilised in this work are considerably simpler.42 The reported LOD and LOQ were also considered adequate for the determination of elevated histamine levels in food and beverage samples. Combined with an efficient extraction procedure; the limits reported in Table 2 permit detection in samples that contain histamine below the maximum allowed levels in fish and fish products in the USA (50 μg g−1).| Analyte | Equation | R 2 | LOD (mg L−1) | LOQ (mg L−1) | Migration time RSD (%) |
|---|---|---|---|---|---|
| Histamine | y = 0.0073x − 0.0034 | 0.997 | 0.43 | 0.69 | 1.32 |
Application: detection of histamine in fish flesh
The applicability of the developed microchip electrophoresis-C4D method was demonstrated through the determination of histamine levels in fish flesh. To extract histamine from flesh samples an extraction method reported by Hwang et al.,30 used for the determination of histamine by GC-MS, was modified. The adapted method extracted histamine from the flesh samples into methanol alkalized with concentrated ammonia. After evaporation of the supernatant, the extracts were reconstituted in water. SPE cleanup was then performed with the analyte elution step performed using the optimised BGE. This produced final matrix matched extracts for electro-kinetic injection under non-stacking conditions.Initially, recoveries of spiked yellowfin tuna samples were determined to validate the extraction procedure outlined. Tuna flesh samples were spiked with three different amounts of histamine corresponding to a low, medium and high level in the range 40–190 μg g−1. The histamine peak was confirmed by the increased peak height observed after spiking (see ESI Fig. S3†). As shown in Table 3, tuna flesh used in this experiment initially contained 17.7 ± 0.7 μg g−1 of histamine. The mean recovery of histamine using the standard extraction procedure ranged from 88.8 to 112.5% and all showed acceptable relative standard deviation values (%RSD < 13%). These results strongly indicated that the extraction procedure in conjunction with the electrophoretic separation and direct detection via C4D produced reliable measurements of histamine levels in the yellowfin tuna flesh samples.
| Sample | Histamine content (μg g−1) | Mean recoveryb (%) | RSD (%) | ||
|---|---|---|---|---|---|
| Initiala | Spikea | Detecteda | |||
| a Each histamine determination was performed in triplicate and final amount is reported as mean ± S.D. b Recovery of spiked samples was calculated using [(detected histamine content − initial histamine content)/spiked histamine content] × 100%. | |||||
| Tuna flesh | 17.7 ± 0.7 | 43 ± 7 | 61 ± 8 | 100.8 | 12.8 |
| 92 ± 11 | 121 ± 8 | 112.5 | 6.5 | ||
| 187 ± 5 | 184 ± 21 | 88.8 | 11.6 | ||
To demonstrate the versatility of the developed methodology the histamine content of a number of additional frozen fish samples, purchased at a local supermarket, were determined. Table 4 shows that the fish samples analyzed contained histamine levels ranging from 17.7 to 63.3 μg g−1. Both Basa and Pacific cod fillets contained histamine above the US FDA recommended 50 μg g−1 however, all were well below (<65 μg g−1) the Australian and New Zealand food safety standards maximum histamine content for decomposition of 200 μg g−1. The significant advantage of employing microchip electrophoresis coupled with C4D for this analysis was its simple instrumental setup with enhanced portability; which combined with simplified sample preparation, negating lengthy histamine derivatization, and a rapid electrophoretic separation (<50 s) allowed fast analysis time frames.
| Frozen fish sample | Histamine contenta (μg g−1) |
|---|---|
| a Each histamine content determination was performed in triplicate and final amount is reported as mean ± S.D. | |
| Yellowfin tuna (Thunnus albacares) | 17.7 ± 0.7 |
| Atlantic salmon (Salmo salar) | 43.4 ± 5.0 |
| Basa (Pangasius hypophthalmus) | 63.3 ± 3.3 |
| Pacific cod (Gadus macrocephalus) | 57.4 ± 2.6 |
Conclusion
We have demonstrated the first use of microchip electrophoresis coupled with C4D for the direct analysis of histamine. This approach negates the need for derivatization, required for the detection of these analytes using optical detection techniques, and incorporates the significant advantage of enhanced analysis portability for potential on-site analysis. The reported method has comparative LODs with other direct detection approaches and its suitability has been demonstrated for histamine recovery in yellowfin tuna flesh samples. Further, we demonstrated the versatility of this new approach by determining the histamine content in a number of frozen fish samples purchased from a local supermarket. This approach has the potential to be adapted for the determination of histamine in other food and beverage samples and with further extraction method development could result in its implementation for monitoring of food quality during processing and storage.Acknowledgements
This research was supported by the Smart Futures Fund National and International Research Alliances Program – Australian Future Forensic Network (AFFIN), the Australian National Fabrication Facility Ltd (ANFF) South Australian Node Start-Up Award and the South Australian Department of Justice.Notes and references
- S. L. Taylor and R. R. Eitenmiller, Crit. Rev. Toxicol., 1986, 17, 91–128 CrossRef CAS PubMed.
- A. R. Shalaby, Food Res. Int., 1996, 29, 675–690 CrossRef CAS.
- S. Bodmer, C. Imark and M. Kneubühl, Inflammation Res., 1999, 48, 296–300 CrossRef CAS.
- L. M. Nollet and F. Toldrá, Safety analysis of foods of animal origin, CRC Press, 2010 Search PubMed.
- A. Halász, Á. Baráth, L. Simon-Sarkadi and W. Holzapfel, Trends Food Sci. Technol., 1994, 5, 42–49 CrossRef.
- M. H. S. Santos, Int. J. Food Microbiol., 1996, 29, 213–231 CrossRef CAS.
- K. J. Motil and N. S. Scrimshaw, Toxicol. Lett., 1979, 3, 219–223 CrossRef CAS.
- J. D. Morrow, G. R. Margolies, J. Rowland and L. J. Roberts, N. Engl. J. Med., 1991, 324, 716–720 CrossRef CAS PubMed.
- J. M. Hungerford, Toxicon, 2010, 56, 231–243 CrossRef CAS PubMed.
- P. Visciano, M. Schirone, R. Tofalo and G. Suzzi, Front. Microbiol., 2012, 3, 188 Search PubMed.
- United States Food and Drug Administration, Decomposition and Histamine Raw, Frozen Tuna and Mahi-Mahi; Canned Tuna; and Related Species Section 540.525, http://www.fda.gov/ICECI/ComplianceManuals/CompliancePolicyGuidanceManual/ucm074506.htm, accessed 13th November, 2014.
- Australia New Zealand Food Standards Code, Standard 2.2.3-Fish and Fish Products http://www.comlaw.gov.au/Details/F2009C01233, accessed 13th November, 2014.
- T. Bauza, A. Blaise, F. Daumas and J. C. Cabanis, J. Chromatogr. A, 1995, 707, 373–379 CrossRef CAS.
- T.-C. Chiu, Y.-W. Lin, Y.-F. Huang and H.-T. Chang, Electrophoresis, 2006, 27, 4792–4807 CrossRef CAS PubMed.
- A. Önal, Food Chem., 2007, 103, 1475–1486 CrossRef PubMed.
- A. Önal, S. E. K. Tekkeli and C. Önal, Food Chem., 2013, 138, 509–515 CrossRef PubMed.
- V. Šimat and P. Dalgaard, LWT--Food Sci. Technol., 2011, 44, 399–406 CrossRef PubMed.
- S. Tahmouzi, R. Khaksar and M. Ghasemlou, Food Chem., 2011, 126, 756–761 CrossRef CAS PubMed.
- M. L. Latorre-Moratalla, J. Bosch-Fusté, T. Lavizzari, S. Bover-Cid, M. T. Veciana-Nogués and M. C. Vidal-Carou, J. Chromatogr. A, 2009, 1216, 7715–7720 CrossRef CAS PubMed.
- P. Ginterová, J. Marák, A. Staňová, V. Maier, J. Ševčík and D. Kaniansky, J. Chromatogr. B: Anal. Technol. Biomed. Life Sci., 2012, 904, 135–139 CrossRef PubMed.
- L. Vitali, A. C. Valese, M. S. Azevedo, L. V. Gonzaga, A. C. O. Costa, M. Piovezan, J. P. Vistuba and G. A. Micke, Talanta, 2013, 106, 181–185 CrossRef CAS PubMed.
- M.-S. Steiner, R. Meier, C. Spangler, A. Duerkop and O. Wolfbeis, Microchim. Acta, 2009, 167, 259–266 CrossRef CAS.
- G. L. La Torre, M. Saitta, A. Giorgia Potortì, G. Di Bella and G. Dugo, J. Chromatogr. A, 2010, 1217, 5215–5224 CrossRef CAS PubMed.
- R. L. Self, W.-H. Wu and H. S. Marks, J. Agric. Food Chem., 2011, 59, 5906–5913 CrossRef CAS PubMed.
- Y.-M. Liu and J.-K. Cheng, J. Chromatogr. A, 2003, 1003, 211–216 CrossRef CAS.
- W.-l. Li, J.-y. Ge, Y.-l. Pan, Q.-c. Chu and J.-n. Ye, Microchim. Acta, 2012, 177, 75–80 CrossRef CAS.
- X. Y. Gong and P. C. Hauser, Electrophoresis, 2006, 27, 468–473 CrossRef CAS PubMed.
- J. Lapa-Guimarães and J. Pickova, J. Chromatogr. A, 2004, 1045, 223–232 CrossRef PubMed.
- A. R. Shalaby, Food Chem., 1999, 65, 117–121 CrossRef CAS.
- B.-S. Hwang, J.-T. Wang and Y.-M. Choong, Food Chem., 2003, 82, 329–334 CrossRef CAS.
- J. O. Fernandes and M. A. Ferreira, J. Chromatogr. A, 2000, 886, 183–195 CrossRef CAS.
- R. Draisci, G. Volpe, L. Lucentini, A. Cecilia, R. Federico and G. Palleschi, Food Chem., 1998, 62, 225–232 CrossRef CAS.
- J. Lange and C. Wittmann, Anal. Bioanal. Chem., 2002, 372, 276–283 CrossRef CAS PubMed.
- C. N. Jayarajah, A. M. Skelley, A. D. Fortner and R. A. Mathies, Anal. Chem., 2007, 79, 8162–8169 CrossRef CAS PubMed.
- N. Dossi, R. Toniolo, A. Pizzariello, S. Susmel and G. Bontempelli, Electrophoresis, 2011, 32, 906–912 CrossRef CAS PubMed.
- N. P. Beard, J. B. Edel and A. J. deMello, Electrophoresis, 2004, 25, 2363–2373 CrossRef CAS PubMed.
- N. P. Beard and A. J. de Mello, Electrophoresis, 2002, 23, 1722–1730 CrossRef CAS.
- N. P. Beard, C.-X. Zhang and A. J. deMello, Electrophoresis, 2003, 24, 732–739 CrossRef CAS PubMed.
- S. Zhao, Y. Huang, M. Shi and Y.-M. Liu, J. Chromatogr. A, 2009, 1216, 5155–5159 CrossRef CAS PubMed.
- J. J. P. Mark, A. Kumar, H. Demattio, W. Hoffmann, A. Malik and F.-M. Matysik, Electroanalysis, 2011, 23, 161–168 CrossRef CAS.
- J. Zhao, Z. Chen, X. Li and J. Pan, Talanta, 2011, 85, 2614–2619 CrossRef CAS PubMed.
- L. D. Thredgold, D. A. Khodakov, A. V. Ellis and C. E. Lenehan, Analyst, 2013, 138, 4275–4279 RSC.
- L. D. Thredgold, D. A. Khodakov, A. V. Ellis and C. E. Lenehan, SPIE 8923, Micro/Nano Materials, Devices, and Systems, Melbourne, 2013 Search PubMed.
- J. C. McDonald and G. M. Whitesides, Acc. Chem. Res., 2002, 35, 491–499 CrossRef CAS PubMed.
- E. Stellwagen, J. D. Prantner and N. C. Stellwagen, Anal. Biochem., 2008, 373, 407–409 CrossRef CAS PubMed.
Footnote |
| † Electronic supplementary information (ESI) available: Fig. S1–S3. See DOI: 10.1039/c4ay02866j |
| This journal is © The Royal Society of Chemistry 2015 |