
 Open Access Article
 This Open Access Article is licensed under a
 Creative Commons Attribution 3.0 Unported Licence
Comparison of key modalities of micro-scale spatially offset Raman spectroscopy
C.
Conti
*a,
M.
Realini
a,
C.
Colombo
a and
P.
Matousek
*b
aConsiglio Nazionale delle Ricerche, Istituto per la Conservazione e la Valorizzazione dei Beni Culturali (ICVBC), Via Cozzi 53, 20125, Milano, Italy. E-mail: c.conti@icvbc.cnr.it
bCentral Laser Facility, Research Complex at Harwell, STFC Rutherford Appleton Laboratory, Harwell Oxford, OX11 0QX, UK. E-mail: pavel.matousek@stfc.ac.uk
First published on 3rd November 2015
Abstract
We compare several basic embodiments of a recently proposed and demonstrated micrometer-scale Spatially Offset Raman Spectroscopy (micro-SORS). Micro-SORS is a recently introduced analytical method for noninvasive characterisation of the chemical composition of subsurface, micrometre-scale-thick diffusely scattering layers at depths beyond the reach of conventional confocal Raman microscopy. The technique is applicable, for example, in nondestructive subsurface analysis of highly scattering stratified matrices such as painted layers in cultural heritage or in noninvasive analysis of stratified polymer systems or biological samples. Using Monte Carlo simulations, we analysed two defocusing variants of micro-SORS and a variant involving a full separation of illumination and collection zones on the sample surface. Both the penetration depth into the sample and relative enhancement of sublayer Raman signals were studied as a function of layer thickness and type of technique and their parameters. The model predicts that the most effective method by far is the variant with fully spatially separated illumination and collection zones. On the other hand, the defocusing micro-SORS, where both the laser and Raman collection zones are defocussed and overlapped, yielded the lowest performance although its key benefit lies in its simplicity as the concept can be practiced on existing conventional Raman microscopes without any modifications. A basic experimental verification of the theoretical findings contrasting two extreme modalities, the fully separated micro-SORS variant with the defocusing one, is also presented.
Introduction
Micrometer-scale Spatially Offset Raman Spectroscopy (micro-SORS), a derivative of Spatially Offset Raman Spectroscopy (SORS),1 facilitates a new analytical capability for the noninvasive chemical characterization of thin, highly turbid stratified samples such as the layers of paint in cultural heritage, multilayer polymeric films, paper coatings or biological samples at depths beyond the reach of conventional confocal Raman microscopy.2–5The presented Monte Carlo simulations provide, for the first time, thorough insight into the relative performance of several key micro-SORS schemes permitting the most optimum choices to be made when selecting an appropriate scheme; a decision often balancing the performance against instrumental and budgetary constraints. The study also paves the way for further development of micro-SORS by providing deeper understanding of underlying processes. The models presented here build on earlier advances in theoretical understanding of migrating laser and Raman photons in turbid matrices,6,7 earlier Monte Carlo models developed for micro-SORS3,5 and, in general, on a large body of literature on light scattering and photon propagation in tissue and other turbid materials.8–10 In general SORS principles are also related to concepts used in NIR absorption tomography10–12 and fluorescence spectroscopy.13–16 However the chemical content derived from SORS measurements is typically considerably higher than that of its counterparts and the specific technical implementation and optimum regimes are also different defining its distinct application niches. On the other hand, the penetration depths of SORS can be typically lower than those achievable by NIR and fluorescence counterparts, which are often based around much stronger signals.
Micro-SORS variants
The full defocusing variant of the micro-SORS method (DLR) relies on defocusing both the laser and Raman collection zones on the sample surface (see Fig. 1a and b). This is realised typically by moving the sample away from the microscope objective (or the microscope objective away from the sample). Although this is unlikely the most effective micro-SORS variant the key benefit of this scheme is in its simplicity as it is compatible with existing conventional Raman microscopes and can be practiced on such instruments without any further modifications. As such it has a high degree of attractiveness to the users of existing confocal Raman microscopes. Naturally, it is also important to understand how well this concept performs with respect to more advanced variants which do require, often rather complex, adaptations to the optical configuration of existing Raman microscopes.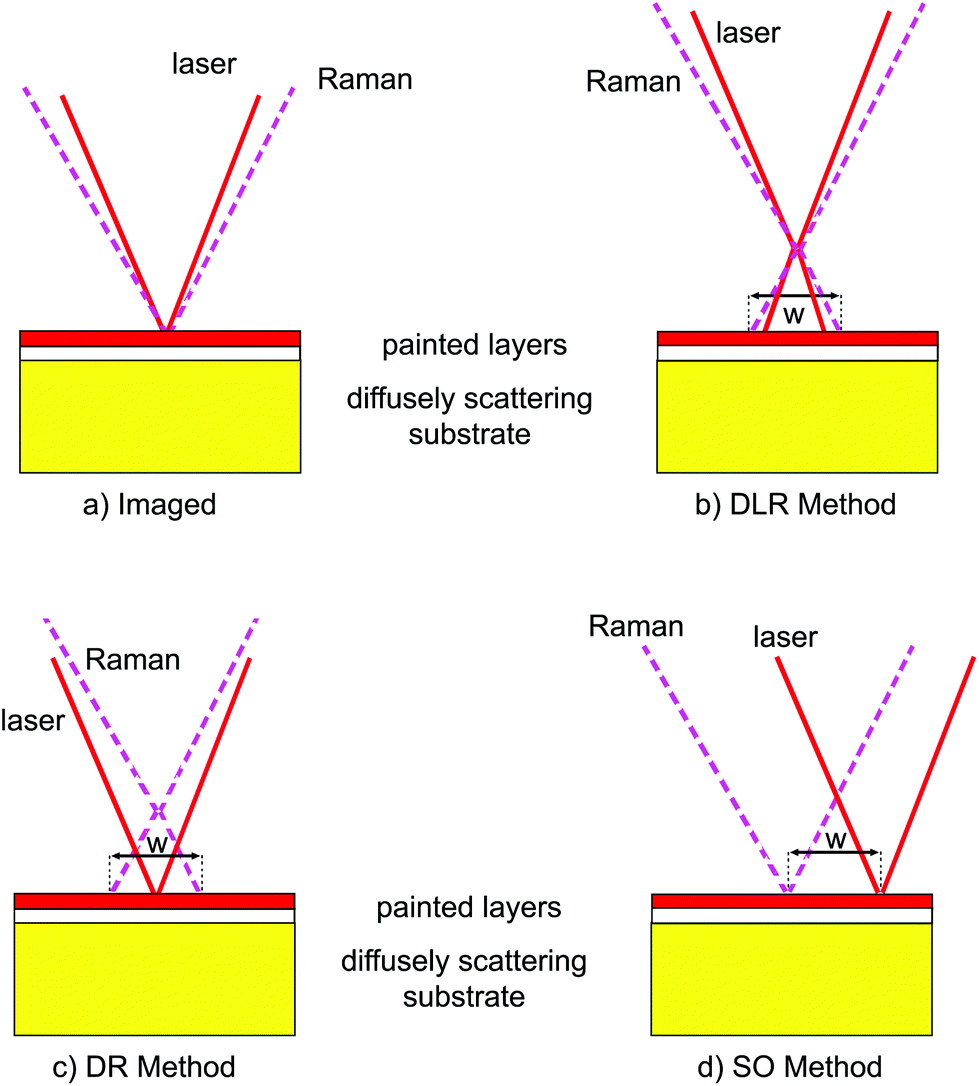 | ||
| Fig. 1 Micro-SORS variants studied showing the meaning of varying parameter w for each method: (a) the initial (‘imaged’) position common to all the three variants (w ∼ 0); (b) DLR – both the laser beam and Raman illumination zones are defocused; (c) DR – only Raman collection area is defocused whilst the laser illumination area on sample surface remains unchanged; (d) SO – spatially offset variant where both the laser beam and Raman illumination zones remain of the same (initial) dimensions but their separation is varied. | ||
The DLR scheme relies on collecting at least two Raman spectra using a Raman microscope, first one, with the sample in a conventional ‘imaged’ position and then, by moving the sample away from the microscope objective by a ‘defocusing distance Δz’, in a ‘defocused’ position.3 This leads to the defocusing of both the laser illumination and Raman collection zones on the sample surface and their resulting enlargement (see Fig. 1a, b). The ‘imaged’ position measurement provides a Raman spectrum dominated by the surface layer and corresponds conceptually to a zero-spatially offset measurement in SORS analysis whereas the ‘defocused’ measurement generates a Raman spectrum which has a significantly higher degree of Raman signal contributions from sublayers.1 In SORS, in general, the subsurface signal decreases with offset, but the top layer signal decreases faster and therefore their ratio (selectivity for the deeper layer) improves. By a scaled subtraction of the ‘imaged’ spectrum from a ‘defocused’ spectrum aiming at cancelling the contribution of the top layer it is then possible to recover the pure Raman spectrum of the sublayer. The pure Raman spectrum of the top layer can be obtained in analogy by a reverse process – by scaled subtraction of the ‘defocused’ spectrum away from the ‘imaged’ spectrum cancelling any present sublayer features. The concept of scaled subtraction was first applied to confocal Raman microscopy with transparent samples by the Morris group.17,18
The schematic diagrams in Fig. 1 also illustrate the other principal variants of micro-SORS studied here. For all the embodiments considered the measurement includes the collection of a Raman spectrum in a common ‘imaged’ sample surface position (see Fig. 1a). In the DR variant (see Fig. 1c) only the Raman collection zone is varied and the laser illumination remains fixed. In the SO variant (see Fig. 1d) the dimensions of the laser illumination and Raman collection zones on the sample surface remain constant but their relative separation is varied instead. The DLR variant can be implemented by altering the sample to microscope objective distance. In contrast DR and SO variants require modifications of a standard instrument for a full unrestrained implementation. A possible implementation of SO may include bringing the laser beam on the sample surface via a separate route bypassing the Raman collection microscope. Spatial offsets in the SO method can also be set by spatially resolving images on the CCD detector in a standard confocal Raman microscope as demonstrated by Di et al.5 although a range of spatial offsets deployable in this arrangement is restricted by the field of view of the microscope. In the DR method, the laser beam can be either brought onto the sample via a separate route bypassing the Raman collection microscope objective or its divergence/convergence, before entering the Raman collection microscope objective, can be varied.
For the sake of simplicity, in subsequent discussions, we define a ‘varying parameter w’ of a specific method as the spatial offset Δs for the SO method, the diameter of laser illumination and Raman collection areas on the sample surface for the DLR method and the diameter of the Raman collection zone on the sample surface for the DR method (see Fig. 1).
Monte Carlo model
Monte Carlo simulations were used to study the micro-SORS signal dependences for the three variants, DLR, DR and SO for a sample consisting of two thin turbid layers located on the top of an extended turbid substrate. For simplicity the transport length t was assumed to be the same for all the three layers. No absorption was assumed to be present in any of the layers at both the laser and Raman excitation wavelengths. The thicknesses of the two thin layers were varied in tandem keeping them identical to each other in all the calculations. The substrate was assumed to be of infinite thickness mimicking common situations encountered for example with paintings where pigments are often deposited on canvas, plaster or panels. It should be noted that the presence of such substrates is significant to the results as the substrate layer returns both the laser and Raman photons originating from the two overlayers back into them boosting, in essence, the detected Raman signal at the sample surface.The simulations were carried out using a modified version of a code described earlier.3,19 The laser and Raman photons were individually tracked through a turbid medium in three dimensions with each calculation/propagation step length equated to the photon transport length t, i.e. the distance on which the photon direction of travel is just fully randomised.10 This model was shown to predict well photon behaviour on propagation distances much larger than photon transport length such as those encountered in common SORS situations.19
In the DLR method the beam diameter of the incident laser beam and the collection Raman areas at the sample surface, defined typically by the numerical aperture of the microscope and the degree of defocusing, were exactly overlapped and of an identical diameter w = 10 μm.
With the DR method only the Raman collection zone dimension on the sample surface w was varied from 10 to 300 μm and the laser illumination diameter on the sample surface remained constant (10 μm). It should also be noted that a variant with the opposite configuration, with a defocused laser beam of varying diameter on the sample surface and constant Raman collection area of 10 μm diameter produced identical results within the error of calculations and as such its results are considered identical in the range of parameters studied and are not explicitly presented here.
An advanced SO method was considered here with high collection efficiency where the collection of Raman photons is facilitated through a ring zone area of a constant thickness of 10 μm drawn around the illumination zone and concentric with it. The laser illumination zone diameter was also kept constant (10 μm). The spatial offset is defined as the radius of the Raman collection ring taken from the ring centre and its midpoint. The results with this concept also replicate the performance of inverse SORS20 where the laser and Raman collection zones are swapped resulting in a ring illumination geometry. For spatial offsets much larger than the laser beam and Raman collection zone radii the performance of the advanced SO geometry is also identical to the point-like collection geometry19 depicted in Fig. 1d. The use of a ring illumination zone was necessitated by the nature of Monte Carlo simulations performed here enabling to maintain simulation times at viable levels by yielding much higher numbers of ‘detected‘ Raman photons.
For each value of w the number of detected Raman photons originating from each layer was evaluated. The laser beam was assumed to be of uniform intensity across its spatial profile at the point of incidence. 2![[thin space (1/6-em)]](https://www.rsc.org/images/entities/char_2009.gif) 000000 photons were propagated simultaneously through 5000 steps, each step was equated to photon transport length t, which was set to 5 μm in all calculations and was assumed to be the same for all the three layers (corresponds to reduced scattering coefficient μ′s = 0.2 μm−1). The photon transport length chosen crudely represents a value one could encounter with art pigments.21,22
000000 photons were propagated simultaneously through 5000 steps, each step was equated to photon transport length t, which was set to 5 μm in all calculations and was assumed to be the same for all the three layers (corresponds to reduced scattering coefficient μ′s = 0.2 μm−1). The photon transport length chosen crudely represents a value one could encounter with art pigments.21,22
Experimental
Raman spectroscopy
DLR measurements were carried out using a Senterra dispersive micro-Raman spectrometer (Bruker Optik GmbH) that includes a standard confocal optical microscope (Olympus BX51). Two objectives have been used, with different working distances (WD) and numerical apertures (NA): 20× (WD 1.3 mm, NA 0.4) and 4× (WD 18.5 mm, NA 0.1). Raman spectra were acquired using a laser 785 nm excitation wavelength (nominal power 100 mW), a Peltier cooled CCD detector (1024 × 256 pixels), 1200 grooves per mm grating and the largest confocal slit (50 μm × 1000 μm). The spectra were acquired with total acquisition times ranging from 50 to 840 s (5–70 co-additions, 10–12 s integration time each).The SO measurements were carried out using the same instrumentation with a small modification. An external standard Raman probe (UniLabII, Bruker Optik GmbH), equipped with a 4× lens (working distance about 15 mm), was used to deliver the laser beam to the sample (bypassing completely the microscope optics) at about 50° with respect to the incidence plane. This resulted in an elongated illumination spot on the sample surface. The elongation direction was set perpendicular to the direction of spatial offset to minimise its influence on the SORS measurements. In this configuration its effect would only be noteworthy at the zero (‘imaged’) position or at very small spatial offsets where it would be reducing the overlap between the collection and illumination zones and as such the signal contrast between the surface and subsurface layers. The laser beam spot size on the sample surface was determined by performing Raman mapping across the sharp edge of a silicon reference sample, moving the reference sample by the automated sample stage with the probe fixed in its position on an external mount. It was measured to be approximately 30 μm along the x axis and 40–50 μm along the y (elongated) axis (calculated between 90% and 10% of the maximum signal). The Raman signal was collected using the standard microscope optics and a 4× objective (WD 18.5 mm, NA 0.1). The external probe was mounted on the sample micro-positioning stage (OPUS-IR™ software controlled) enabling controlled sideways movement to permit the setting of spatial offsets with respect to the Raman collection zone with a high accuracy and reproducibility in the positioning (i.e. mapping measurements are carried out by moving the laser leaving the sample in the same position). To keep the sample immobile with respect to the objective during the measurements it was positioned on top of the condenser, used as a fixed sample stage (see Fig. 2).
 | ||
| Fig. 2 Scheme (a) and experimental (b) configuration of SO measurement. | ||
Materials
The sample consists of painted layers simulating a real artistic stratigraphy (Fig. 3). Three pigments were used, red ochre (hematite – Fe2O3), titanium white (rutile – TiO2) and bismuth vanadate yellow (BiVO4) here called R, W and Y, respectively. The stratigraphy sequence is the R layer (40 μm thick) on top of the W layer (40 μm thick); Y layer is the most internal layer (200 μm thick) deposited on a paper sheet. The extended thickness of the yellow layer allows one to avoid the overlapping of W with the white rutile pigment component of the paper surface.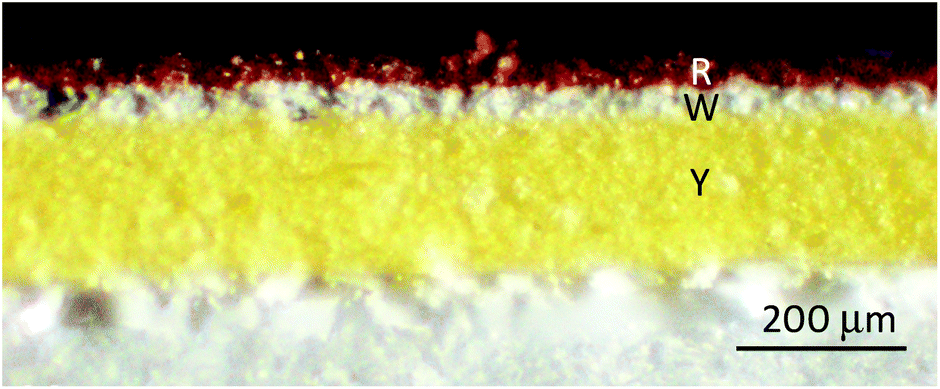 | ||
| Fig. 3 Optical-microscopy image of the specimen cross section. The stratigraphy consists of three layers: red on the top (R – red ochre), white on the middle (W – titanium white) and yellow on the bottom (Y – bismuth vanadate). The white paper was used as a substrate. | ||
Raw spectra are presented with no background correction. The spectra are rescaled relative to each other for clarity.
Results and discussion
Monte Carlo simulations
The results of Monte Carlo simulation comparing DLR, DR and SO methods are summarised in Fig. 4. The relative Raman intensity ratio between the sublayer (second) and the top layer is given normalised to the value observed at the ‘imaged’ position and defined as an ‘enhancement factor’. The enhancement factor is shown for all the three methods for layer thicknesses of 20, 30 and 40 μm as a function of varying parameter w of the respective method. Very similar enhancement factors were found to be present with the DLR and DR methods. In contrast, much larger enhancements factor values are achieved with the SO method. For example, for a thickness of 30 μm of the two utmost top layers and 300 μm varying parameter the SO method offers 55-times signal enhancement for the sublayer over the top layer. This is around 6-times larger than achievable with either the DLR or DR method.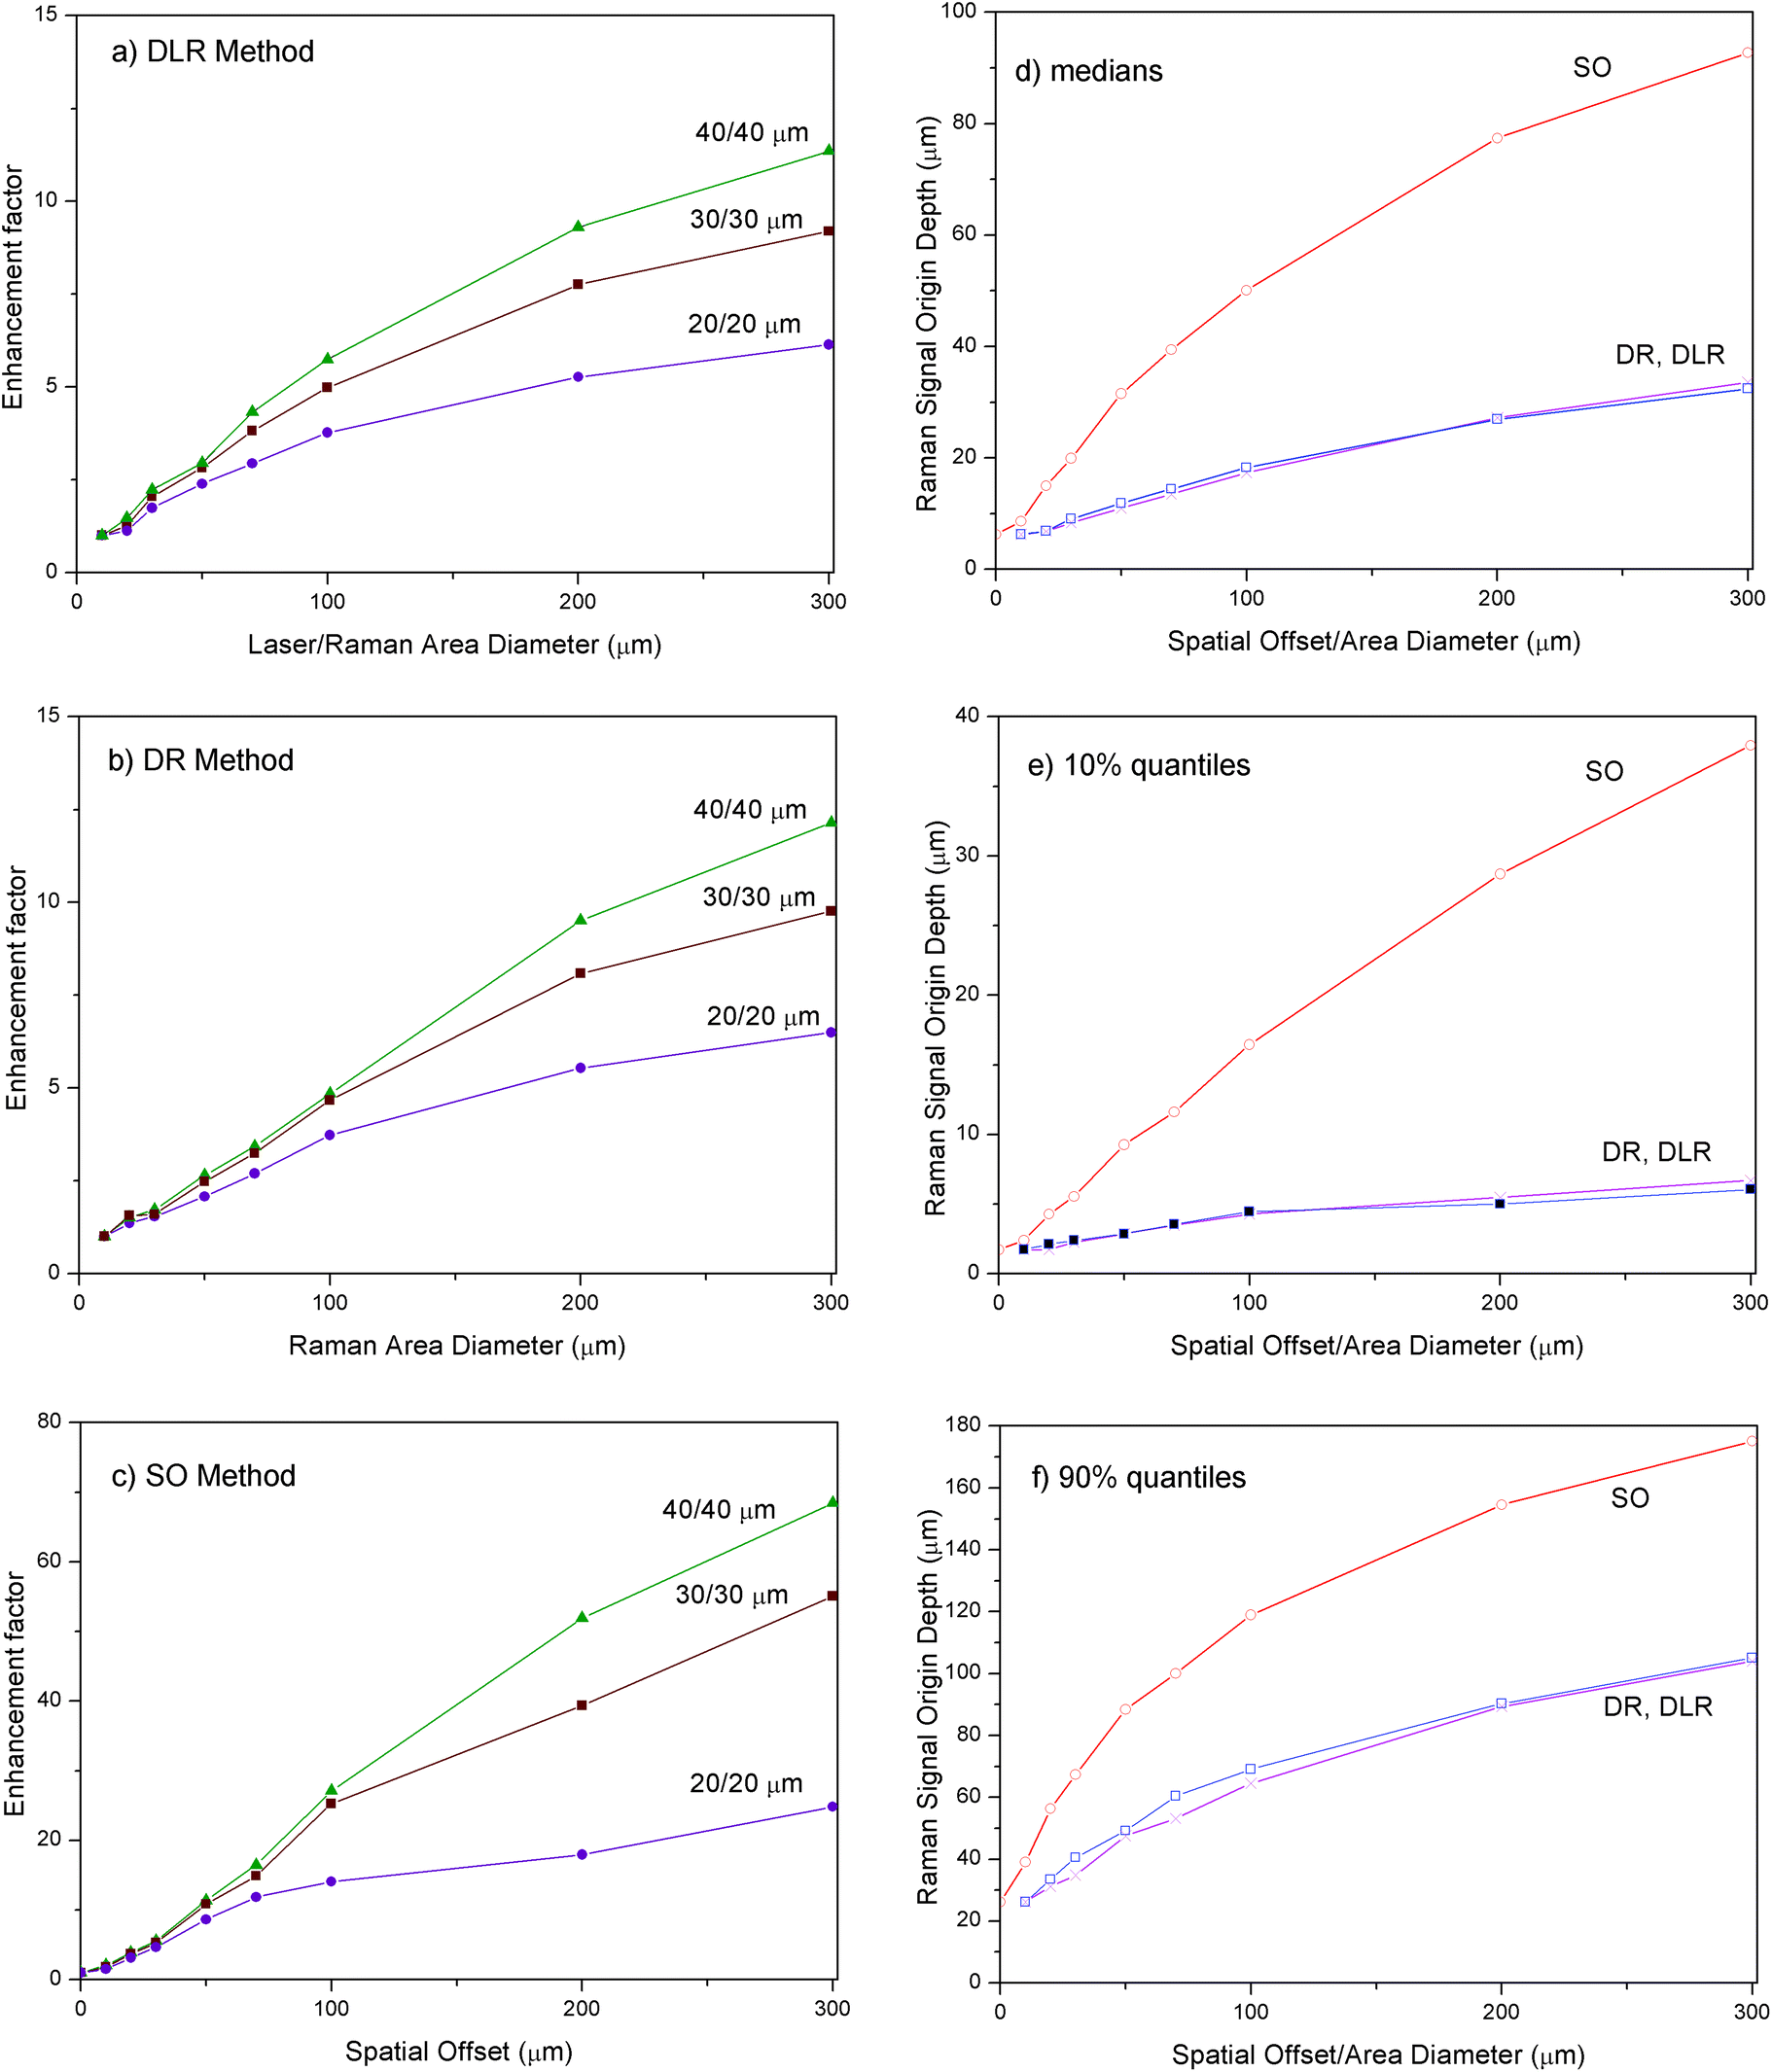 | ||
| Fig. 4 The results of Monte Carlo simulations depicting the enhancement of sublayer Raman signal intensity relative to the surface layer signal (normalised to the initial intensity ratio at ‘imaged’ position) in micro-SORS measurements for (a) DLR, (b) DR and (c) SO methods. The layer thicknesses are indicated next to the curves. The penetration depths into sample expressed as (d) median, (e) 10% quantile and (f) 90% quantile depth ranges down to which the corresponding fractions of Raman signals originate from are given as a function of the varying parameter w for DLR, DR and SO methods (‘spatial offset/area diameter’). | ||
A similar observation is made when comparing the penetration depths of individual methods expressed as median, 10% quantile and 90% quantile depths down to which the given fraction of detected Raman photons originates from. All the median, 10% quantile and 90% depths are practically identical for DLR and DR methods for the same varied parameter w. This may come perhaps as a surprise as in the DR method the Raman illumination zone is not changed and this would be expected to lead to a larger fraction of Raman-to-originating laser photons to have a non-zero spatial offset. Although this is the case the DLR method also permits the Raman-to-originating laser photons to have two-times larger offsets at the extremes, i.e. when at the opposite sides of the illumination/collection zones. This appears to fully compensate for the earlier mentioned difference leading to virtually identical performance of the two methods. In a sharp contrast the SO methods exhibit vastly superior performance ascribed to the presence of a full separation of illumination and collection zones. The penetration depths are by 2.8, 5.9 and 1.7-times larger for median, 10% and 90% quantiles, respectively at 300 μm varying parameter, for the SO method than for the DLR and DR methods. Of particular note is a much larger 10% quantile depth in proportion to the median and 90% quantile for the SO method, a feature responsible for a much larger suppression of near surface signals with the SO method than achievable with the DLR and DR variants. As much smaller spatial offsets of detected Raman photons from the originating laser photons are also present in the DLR and DR methods this leads to their lower discriminating capability against signals near the sample surface.
As a consequence the SO method also exhibits much higher depth selectivity overall to the DR and DLR methods. At 300 μm varying parameter the range of depth from which 80% of overall Raman signal is collected (10% to 90% quantile depths) relative to the median depth of the respective method is approximately two times narrower for the SO method compared with the DLR and R methods.
Fig. 5 compares the enhancement factors of the three methods overlaid in a single graph for a special situation where only a single layer (30 μm thick) is present on the top of an infinitely deep sublayer with identical optical parameters. The increase of the enhancement factor relates to the improvement of the contrast of the sublayer signal over the top layer. In this situation, the performance of the SO method is yet further set aside from the DLR and DR methods. For 300 μm varying parameter of the methods the enhancement factor is around 180 for the SO method, i.e. 13-times larger than for DLR and DR methods. This is again explained in the light of 10% quantile depth for the SO method being pushed deeper into the sample compared with the DLR and DR variants resulting in much larger discrimination available against surface layers with the SO method.
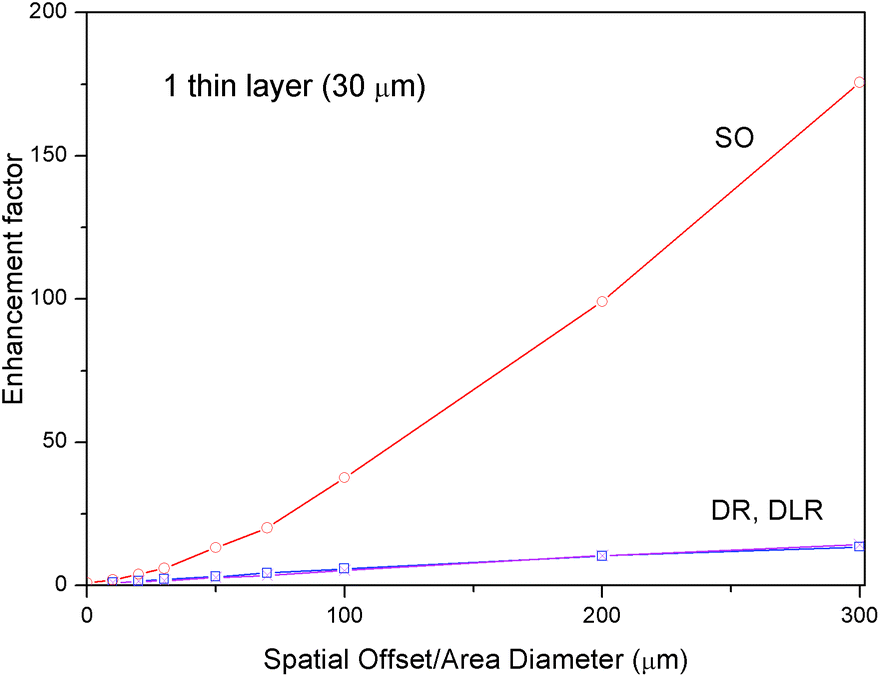 | ||
| Fig. 5 The results of Monte Carlo simulations depicting the enhancement factor for an infinitely thick sublayer below a single 30 μm thick overlayer for DLR, DR and SO methods (both the layers are of identical optical properties). | ||
Experimental verification
To test qualitatively the basic predictions of the models we have compared the performance of the DLR and SO methods also experimentally. The measurements were performed on the 3 paint layers system illustrated in Fig. 3 and described above.The micro-SORS spectra obtained using the SO methods with the point illumination geometry are shown in Fig. 6d (only the most representative offsets are shown). The ‘0’ spatial offset spectrum represents a conventional Raman spectrum and is dominated by Raman bands associated with the top layer (R). The Raman bands of the second layer (W) are also clearly visible. No Raman spectra of the substrate layer are seen at this initial position. The gradual incrementing of the spatial offset leads to a rapid diminishment of the top layer signal (R) relative to that of the second layer (W) in line with model's predictions. At a spatial offset >40 μm one already begins to see the bands of the third layer (Y) which keeps increasing relative to the intensity of the Raman bands of the both the top (R) and second (W) layers.
 | ||
| Fig. 6 (a) Raman spectra of the pure pigments R (top layer), W (intermediate layer) and Y (the third, the most inner layer); experimental results of the micro-SORS measurements system using (b) DLR methods using a 4× objective, (c) DLR methods using a 20× objective (sample displacement from microscope objective is indicated next to the spectra) and (d) SO (spatial offset is indicated next to the spectra). | ||
The experiments were carried out again on the same sample using the DLR method and two different objectives (4× and 20×). With a 20× objective, again a similar pattern is seen (Fig. 6c). The top layer signal (R) diminishes in relative terms to the second layer signal (W) with increasing the displacement of the sample from the microscope objective. However, in this case, the rate of the change is much smaller and the ultimate ratio reached at 1 mm is much lower than that with the SO method at 160 μm offset. In addition the third (Y) layer is only tenuously resolved at the extreme displacement of 1 mm. The measurements acquired with a 4× objective (Fig. 6b) do not show any significant variations with the increase of defocusing: the ‘imaged’ and the 1 mm defocusing spectra are rather similar. This is due to a relatively large size of ‘imaged’ laser and collection areas and their smaller increase with the defocusing than with the large magnification objective. (With the DLR method, the displacement of 1 mm corresponds approximately to a varying parameter of w ∼ 0.9 mm and 0.2 mm for the ×20 and ×4 objectives, respectively.)
The observations are, in general, consistent with the prediction of the model indicating that the SO variant exhibits a larger penetration depth and provides larger enhancement factors. For example the magnitude of the enhancement for the second layer is at best 1.0, 1.9 and 27 for DLR/×4, DLR/×20 and SO (×4) measurements, respectively. This means that the DLR/×20 method is outperformed by the SO (×4) configuration by a factor of ×14. And this is achieved at an order of magnitude lower varying parameter and with a lower magnification objective for the SO method. Using a smaller laser illumination area and larger magnification microscope objective with the SO concept would be expected to still further improve its performance. The theory also predicts large outperformance of the DLR method by the SO concept (by a factor of 5 for 40 μm thick layers) but the exact quantitative comparison is impossible to carry out as the optical properties of the samples used in the experiments were unknown.
Conclusions
The Monte Carlo simulations compare three basic variants of micro-SORS concluding that the fully spatially offset laser illumination and Raman collection zones with the SO method leads to a dramatically better performance than that achievable with the defocusing DLR and DR methods. Practically no difference was found between the two defocusing methods studied, DLR and DR. Although of lower performance compared with the SO variant, the DLR method possesses an advantage of being deployable on existing Raman microscopes without any modifications. As such it is potentially very attractive to the existing users of Raman microscopes. The level of underperformance versus the SO methods, which can be deduced from the presented simulations enables one to assess whether the extra resources required for customisation of a Raman microscope to enable the more advance SO variant are warranted by the application. The modelling also enables the Raman practitioners to evaluate a specific application first on an existing system with the DLR method and project the expected performance on a potential SO system prior to the development of dedicated SO instrumentation. In general, the study paves a way for further development of micro-SORS as a new analytical capability offering extended penetration depth to Raman microscopy.References
- P. Matousek, I. P. Clark, E. R. C. Draper, M. D. Morris, A. E. Goodship, N. Everall, M. Towrie, W. F. Finney and A. W. Parker, Appl. Spectrosc., 2005, 59, 393–400 CrossRef CAS PubMed.
- C. Conti, M. Realini, C. Colombo and P. Matousek, J. Raman Spectrosc., 2015, 46, 476–482 CrossRef CAS.
- P. Matousek, C. Conti, C. Colombo and M. Realini, Appl. Spectrosc., 2015, 69, 1091–1095 CrossRef PubMed.
- C. Conti, M. Realini, C. Colombo, K. Sowoidnich, N. Kristian Afseth, M. Bertasa, A. Botteon and P. Matousek, Anal. Chem., 2015, 87, 5810–5815 CrossRef CAS PubMed.
- Z. Di, B. H. Hokr, H. Cai, K. Wang, V. V. Yakovlev, A. V. Sokolov and M. O. Scully, J. Mod. Opt., 2014, 62, 97–101 CrossRef.
- N. Everall, T. Hahn, P. Matousek, A. W. Parker and M. Towrie, Appl. Spectrosc., 2004, 58, 591–597 CrossRef CAS PubMed.
- N. Everall, T. Hahn, P. Matousek, A. W. Parker and M. Towrie, Appl. Spectrosc., 2001, 55, 1701–1708 CrossRef CAS.
- V. Tuchin, Tissue Optics: Light Scattering Methods and Instruments for Medical Diagnosis, SPIE Press Book, 2007, 2nd edn Search PubMed.
- K. H. Song and L. V. Wang, J. Biomed. Opt., 2007, 12, 060503 CrossRef PubMed.
- B. B. Das, F. Liu and R. R. Alfano, Rep. Prog. Phys., 1997, 60, 227–292 CrossRef.
- J. C. Hebden, A. Gibson, R. Yusof, N. Everdell, E. M. C. Hillman, D. T. Delpy, S. R. Arridge, T. Austin, J. H. Meek and J. S. Wyatt, Phys. Med. Biol., 2002, 47, 4155–4166 CrossRef PubMed.
- H. Koizumi, Y. Yamashita, A. Maki, T. Yamamoto, Y. Ito, H. Itagaki and R. Kennan, J. Biomed. Opt., 1999, 4, 403–413 CrossRef CAS PubMed.
- T. J. Pfefer, K. T. Schomacker, M. N. Ediger and N. S. Nishioka, Appl. Opt., 2002, 41, 4712–4721 CrossRef PubMed.
- N. Ghosh, S. K. Majumder, H. S. Patel and P. K. Gupta, Opt. Lett., 2005, 30, 162–164 CrossRef CAS PubMed.
- L. Quan and N. Ramanujam, Opt. Lett., 2002, 27, 104–106 CrossRef PubMed.
- S. C. Gebhart, S. K. Majumder and A. Mahadevan-Jansen, Appl. Opt., 2007, 46, 1343–1360 CrossRef PubMed.
- A. Govil, D. M. Pallister and M. D. Morris, Appl. Spectrosc., 1991, 45, 1604–1606 CrossRef CAS.
- A. Govil, D. M. Pallister and M. D. Morris, Appl. Spectrosc., 1993, 47, 75–79 CrossRef.
- P. Matousek, M. D. Morris, N. Everall, I. P. Clark, M. Towrie, E. Draper, A. Goodship and A. W. Parker, Appl. Spectrosc., 2005, 59, 1485–1492 CrossRef CAS PubMed.
- P. Matousek, Appl. Spectrosc., 2006, 60, 1341–1347 CrossRef CAS PubMed.
- M. Elias, Appl. Opt., 2011, 50, 2464–2473 CrossRef PubMed.
- N. J. Elton and A. Legrix, J. Coat. Technol. Res., 2014, 11, 555–566 CrossRef CAS.
| This journal is © The Royal Society of Chemistry 2015 |