DOI:
10.1039/C5AN01782C
(Communication)
Analyst, 2015,
140, 8080-8087
Gold nanodome-patterned microchips for intracellular surface-enhanced Raman spectroscopy†
Received
31st August 2015
, Accepted 22nd September 2015
First published on 23rd September 2015
Abstract
While top-down substrates for surface-enhanced Raman spectroscopy (SERS) offer outstanding control and reproducibility of the gold nanopatterns and their related localized surface plasmon resonance, intracellular SERS experiments heavily rely on gold nanoparticles. These nanoparticles often result in varying and uncontrollable enhancement factors. Here we demonstrate the use of top-down gold-nanostructured microchips for intracellular sensing. We develop a tunable and reproducible fabrication scheme for these microchips. Furthermore we observe the intracellular uptake of these structures, and find no immediate influence on cell viability. Finally, we perform a proof-of-concept intracellular SERS experiment by the label-free detection of extraneous molecules. By bringing top-down SERS substrates to the intracellular world, we set an important step towards time-dependent and quantitative intracellular SERS.
1 Introduction
A number of groups have recently demonstrated how nanophotonic technologies can provide solutions for tagging cells1,2 or probing intracellular parameters like pressure changes3 and protein interactions.4 Here, we fabricate a new type of intracellular nanophotonic microchip for surface-enhanced Raman scattering. By directly probing molecular vibrations, Raman spectroscopy offers fingerprint specificity in a label-free fashion. However, it suffers from the inherently low Raman scattering cross section of most molecules. Furthermore live cell measurements require a limited laser power, short integration time and Raman excitation in the near infrared therapeutic window5 to limit photo-damage. The resulting low signals limit the applicability of the technique for live cell sensing. Surface-enhanced Raman spectroscopy (SERS) offers a promising solution to this problem, where molecules close to metallic nanostructured surfaces experience a dramatic increase in Raman scattering by six to ten orders of magnitude.6Conditio sine qua non for intracellular SERS is a non-invasive introduction of gold nanostructures into living cells.7,8 The first demonstration of intracellular SERS in the early nineties9 made use of colloidal silver nanoparticles, later to be replaced by the more chemically inert gold nanoparticles10 (AuNP) or -nanorods.11 Plasmonic hot spots created in the gaps and crevices of aggregated clusters of these nanoparticles offer a strong Raman enhancement, which is why to date AuNP (and their aggregates) have remained the most important workhorse for intracellular SERS.7,12 Amongst others, AuNP-assisted SERS has been used to distinguish and classify various cell types on the basis of their biochemical signatures,13,14 to study pathways like endocytosis15 or apoptosis,16 for a real-time and label-free monitoring of extraneous molecules17,18 or for probing chemical parameters like pH12,19,20 or redox potentials.21 Despite their strong enhancement and potentially limited cytotoxicity,22,23 colloidal nanoparticles often affect reproducibility due to their spatio-temporal dynamics. These result in clustering and a non-uniform distribution of these nanoparticles. In turn, this leads to enhancement factors which are unpredictable in space and time, thereby restricting quantitative or time-dependent intracellular SERS experiments. Probes with a predefined metal configuration have been designed to solve this problem, either in the form of nanopipettes pierced through the cell membrane during measurement8,24–26 or as micron-sized beads coated with silver27 and gold nanoparticles28,29 which can be entirely engulfed by cells without compromising cell viability.27,29 Although the nanopipettes solve the problem of variable gold nanostructures during measurement and coated microbeads allow to do this without a permanent incision of the cell membrane, these approaches still rely on the self-assembly of colloidal gold nanoparticles. This inhibits control on the position and amount of SERS hot spots on the probes, which inevitably leads to a variability between different probes. In contrast, a wide variety of extracellular SERS substrates have been developed using top-down fabrication techniques30 like electron-beam-,31,32 deep-UV-33 or nanosphere-lithography,34–37 where an accurate control of the shape and position of nanostructures have resulted in reproducible and tunable enhancements.
In this work, we develop intracellular SERS probes based on nanosphere lithography-fabricated gold-film-over-nanoparticle (AuFON) substrates, where the topography of a monolayer of polystyrene beads is used as a template for gold deposition.35,36,38,39 First, we develop micron-sized chips with a uniform, reproducible gold nanopattern. Next, we characterize these chips in the near- and far-field and optimize them towards optimal enhancement for near-infrared Raman excitation. We also show the cellular uptake of these microchips, while preliminary observations of cell mitosis indicate their low cytotoxicity. Finally, we detect the intracellular SERS spectrum of extraneously added molecules in live cells as a proof-of-concept experiment. To the best of our knowledge, this approach demonstrates for the first time the possibility of using top-down SERS substrate fabrication techniques for intracellular sensing, thereby providing a predefined and reproducible gold nanopattern. However, the variability encountered with surface-enhanced Raman spectroscopy experiments in cells or tissue originates from a number of different factors. Important challenges are the adsorption of a protein corona on the gold surface,40 the exact intracellular location of the nano- or microstructure41 and the variability in the gold nanopattern. We believe that by taking out this variability, the use of top-down deposited SERS substrates for intracellular sensing provides a promising step towards reproducible SERS experiments in cells or tissue, although this is currently still limited by the challenges mentioned before. Furthermore, the traceability and potentially low cytotoxicity of micron sized structures can provide an additional advantage in specific applications like a localized detection in tissue or a targeted delivery.
2 Results and discussion
2.1 Fabrication of the SERS microchips
A nanosphere lithography (NSL) based process is developed for the fabrication of a nanodome-patterned surface. This self-assembly based lithographic technique is chosen because it allows for a relatively cheap, fast and reproducible nanopatterning.34Fig. 1(a) schematically shows the most important fabrication steps, which are described in detail in the ESI.† We start from a thin film of silicon nitride (Si3N4) deposited on top of a 4′′ silicon wafer. A monolayer of hexagonally-close packed (HCP) polystyrene beads is generated by spin coating a colloidal solution of 450 nm beads on the Si3N4 surface.42,43 Next, a periodic pattern of nanodomes is etched into the Si3N4 substrate. Starting from the dense-packed monolayer, the polystyrene beads are first thinned down in an oxygen plasma. The duration and power of this plasma are of key importance for the performance of the substrate, as this will finally determine the separation of the gold-coated nanodomes (parameter |d| in Fig. 2(b)). Next, the pattern is transferred into the Si3N4 layer by an anisotropic reactive-ion etch44 (see also ESI Fig. S1†), followed by lifting off what remains of the polystyrene beads. Subsequently 6 μm disks are defined by UV contact lithography. A 200 nm gold layer is then evaporated on the micro disk-patterned nanodome surface. Finally, the chips are released from the underlying silicon surface with a potassium-hydroxide wet etch. Fig. 1(b) shows a tilted view of such a nanopatterned microchip. Note that the size and shape of the microchips is fully controllable and only limited by the resolution of the UV-lithography system. Hence, microdisks with a diameter down to 0.5 μm can easily be fabricated in an identical way. Approximately three million SERS microchips are obtained from a 2 cm2 substrate, which provides a sufficient supply for intracellular experiments. A dried cluster containing a few thousand of these chips is shown in Fig. 1(c). While ideally all these microchips are identical, in reality the reproducibility of the gold nanodome pattern is limited by the uniformity of the layer of spin coated polystyrene beads. Next to a HCP monolayer, there are also areas with multi-layers and packing defects. We currently achieve a 85% HCP-monolayer coverage (Fig. S2†). To achieve a 100% reproducibility, the use of self-assembling monolayers has to be avoided and techniques like e-beam-, deep-UV- or nano-imprint lithography can be used for patterning gold nanostructures.
 |
| | Fig. 1 (a1) A nanodome pattern is created starting from a spin coated monolayer of 450 nm polystyrene beads on a Si3N4/Si stack. The polystyrene beads are etched in the underlying Si3N4 layer in a two step RIE-process (a2–a3), followed by removal of the beads, patterning of individual disks (a4) and gold deposition (a5). Finally the microdisks are underetched and released from the Si substrate. (a6). (b) Tilted SEM view showing a 3 μm diameter nanodome-patterned microdisk and (c) a close up of the metal surface. (d) Up to three million microchips are obtained from one chip, of which a few thousand can be seen in this cluster. | |
 |
| | Fig. 2 The properties of the nanodome substrates are strongly dependent on the nanometer-sized gap (|d|) in between nanodomes. (a) The UV-Vis reflection blueshifts with decreasing gap-size. In water (a, bottom), UV-Vis reflection spectra indicate that the plasmon resonance for a 5–15 nm gap size is ideally positioned for exciting Raman spectra at 785 nm, as can be seen from the grey-shaded pump and Stokes wavelengths. (b) SEM images of the corresponding substrates show a variation from touching nanodomes to a 30–40 nm gap in top and tilted views. (c) The 5–15 nm gap substrate also shows the strongest enhancement for a monolayer of 4-nitrothiophenol molecules bound to the gold surface. (d) Top- and tilted SEM views of the nanotriangle-, nanodome- and AuFON-substrates used for a comparison of the enhancement of the different substrates. (e) SERS spectra from a monolayer of 4-NTP molecules show that the nanodome substrates have a 70-fold higher enhancement as compared to nanotriangle substrates when integrating the 1373 cm−1 peak. 95% of the data lies within the shaded regions. | |
2.2 Characterisation of SERS microchips
In order to work in the wavelength window that induces minimal photo-damage to biological samples, the geometry of the SERS substrates is tuned for an optimal enhancement when exciting at a wavelength of 785 nm. The spectral position of the plasmon resonance is characterized through UV-Vis reflection spectroscopy. Fig. 2(a) shows the reflectance spectra of nanodome substrates characterized both in air (top) and water (bottom). The reflectance spectra clearly become red-shifted with an increasing gap size (|d|, Fig. 2(b)) in between the nanodomes. As expected, the reflectance minima experience a strong red-shift (150–200 nm) in water, due to the higher refractive index of the surrounding medium. These findings correspond well with the characterisation by Wu et al.45 of nano-imprinted nanodomes. The spectral position of the pump and Stokes light, shaded region in Fig. 2(a), shows an ideal overlap with the reflectance minimum for the substrates with a 5–15 nm gap size in water. The water-environment (n = 1.33) quite accurately represents the plasmonic properties inside cells (n = 1.35–1.38![[thin space (1/6-em)]](https://www.rsc.org/images/entities/char_2009.gif) 46). In order to compare the SERS enhancement amongst the different gap sizes, the substrates were coated with a 4-nitrothiophenol (4-NTP) monolayer.37Fig. 2(c) shows the average spectra obtained from the monolayer-coated nanodome substrates with varying gap sizes. As expected, the substrates with a 5–15 nm gap show the strongest enhancement. A smaller gap size results in touching nanodomes while larger gap sizes reduce the coupling of the structures, both effects resulting in a reduced enhancement. Fig. 2(d and e) benchmarks the enhancement from the nanodome-patterned substrates against the ‘traditional’ nanotriangle34 and AuFON36 substrates. When integrating the intensity of the 1343 cm−1, the nanodomes show a 70-fold increased enhancement as compared to nanotriangular patterns, and have a comparable performance to AuFON substrates. The relative standard deviation of the signal on the nanodome surface is 8% (shaded region in Fig. 2(e)), which is comparable to other top-down fabricated substrates.33 More details on the fabrication and characterisation of these substrates is provided in the ESI (Fig. S3 and S4†). The strong enhancement is the main motivation for developing nanodome- instead of nanotriangle-patterned microchips. Conversely, nanotriangle substrates may offer more accessible hot spots and an optically transparent substrate. Because of these different properties, the choice of a particular gold nanopattern can be application-inspired. Apart from the gap-size, there are a number of parameters which can be used to further fine-tune the spectral position of the resonance. These include the size of the polystyrene beads in the HCP template, the etch depth of the nanodomes, the thickness of the gold layer and the refractive index of the substrate (e.g. nSi3N4 = 1.98 vs. nSiO2 = 1.45). Obviously these parameters also influence the quality factor of the plasmonic resonance, and have an influence on the enhancement factor. Although we design our SERS substrates to have their plasmonic resonance in the desired spectral region, a further optimisation of nanodome substrates is possible by tuning the parameters described above. This could lead to further increased enhancements, more transparent microchips and more easily accessible hot spots.
46). In order to compare the SERS enhancement amongst the different gap sizes, the substrates were coated with a 4-nitrothiophenol (4-NTP) monolayer.37Fig. 2(c) shows the average spectra obtained from the monolayer-coated nanodome substrates with varying gap sizes. As expected, the substrates with a 5–15 nm gap show the strongest enhancement. A smaller gap size results in touching nanodomes while larger gap sizes reduce the coupling of the structures, both effects resulting in a reduced enhancement. Fig. 2(d and e) benchmarks the enhancement from the nanodome-patterned substrates against the ‘traditional’ nanotriangle34 and AuFON36 substrates. When integrating the intensity of the 1343 cm−1, the nanodomes show a 70-fold increased enhancement as compared to nanotriangular patterns, and have a comparable performance to AuFON substrates. The relative standard deviation of the signal on the nanodome surface is 8% (shaded region in Fig. 2(e)), which is comparable to other top-down fabricated substrates.33 More details on the fabrication and characterisation of these substrates is provided in the ESI (Fig. S3 and S4†). The strong enhancement is the main motivation for developing nanodome- instead of nanotriangle-patterned microchips. Conversely, nanotriangle substrates may offer more accessible hot spots and an optically transparent substrate. Because of these different properties, the choice of a particular gold nanopattern can be application-inspired. Apart from the gap-size, there are a number of parameters which can be used to further fine-tune the spectral position of the resonance. These include the size of the polystyrene beads in the HCP template, the etch depth of the nanodomes, the thickness of the gold layer and the refractive index of the substrate (e.g. nSi3N4 = 1.98 vs. nSiO2 = 1.45). Obviously these parameters also influence the quality factor of the plasmonic resonance, and have an influence on the enhancement factor. Although we design our SERS substrates to have their plasmonic resonance in the desired spectral region, a further optimisation of nanodome substrates is possible by tuning the parameters described above. This could lead to further increased enhancements, more transparent microchips and more easily accessible hot spots.
2.3 Cellular uptake of microchips and cell viability
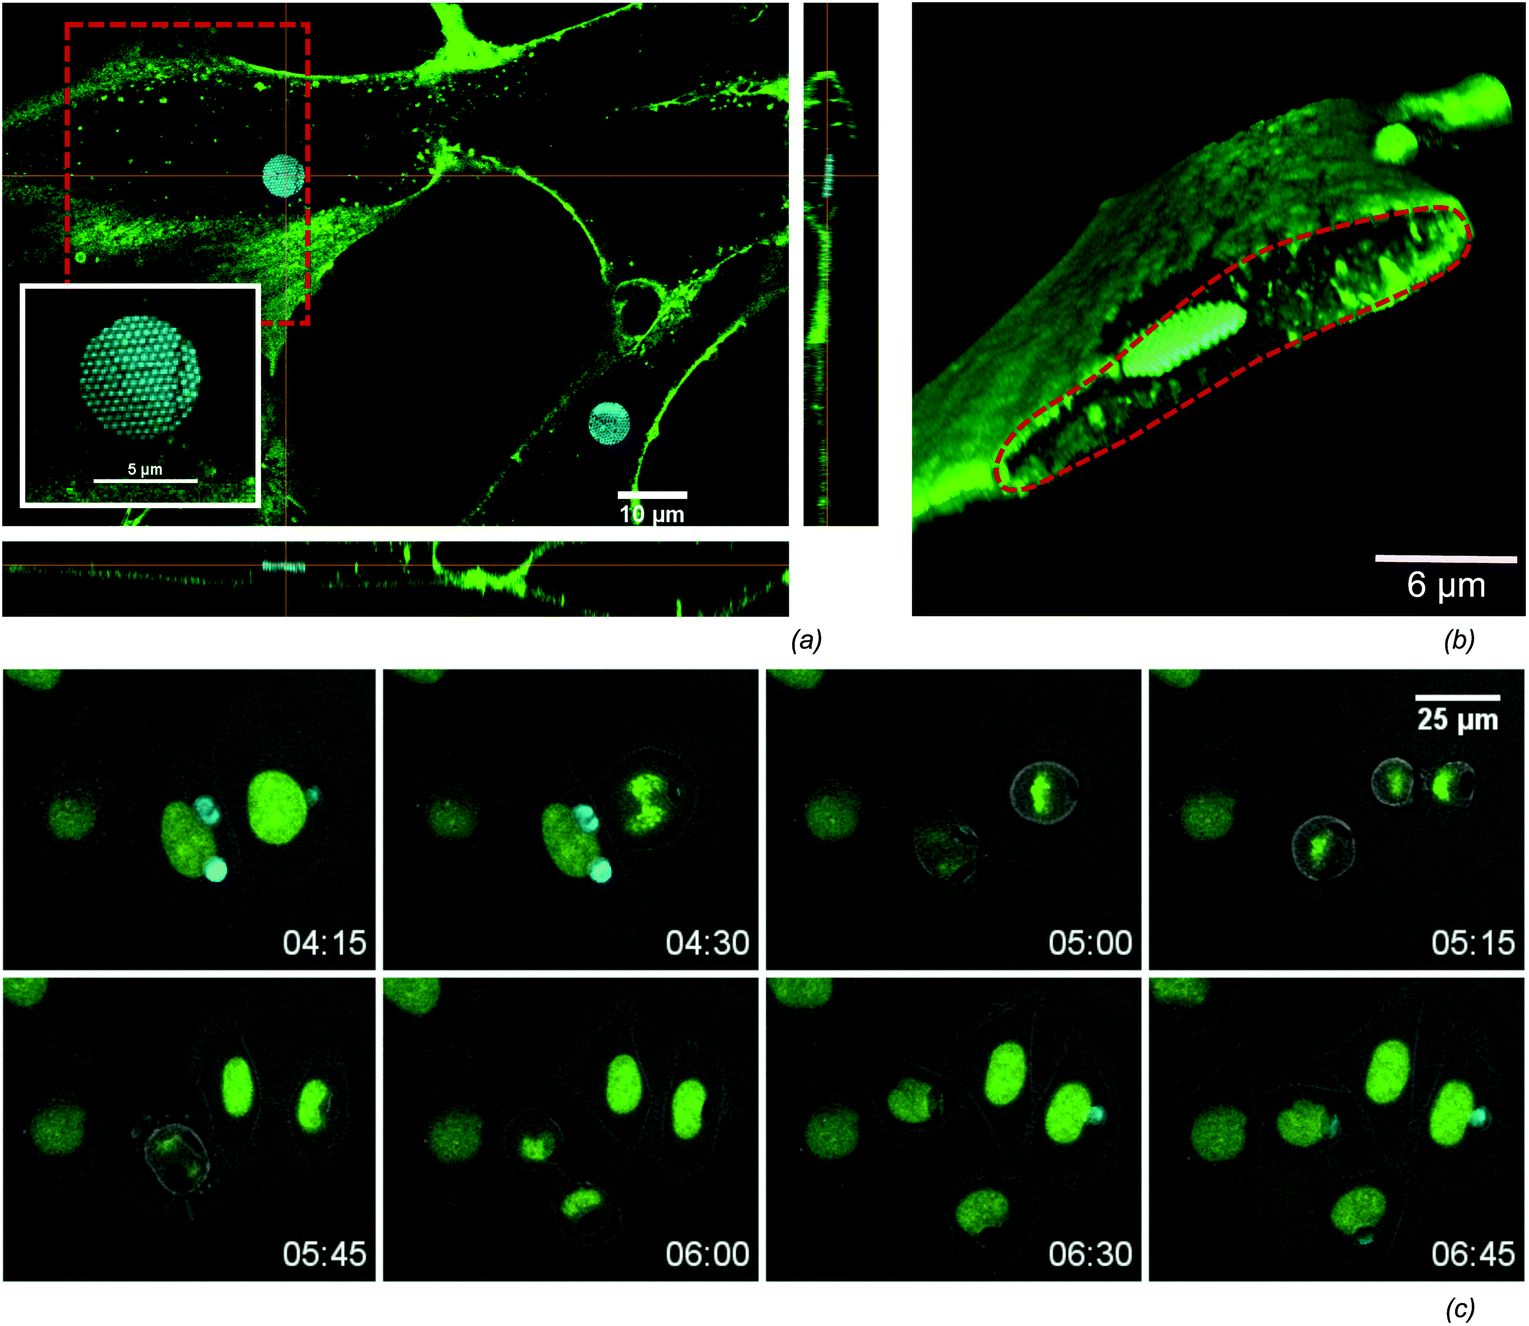
An efficient uptake by cells is crucial when using microchips for intracellular sensing. Several routes for the intracellular delivery of micron-sized objects have been shown in the field of microcapsule-based drug delivery,47 like micro-injection and electroporation.28,48 In contrast to these ‘forced’ uptake methods, it has also been shown that cells can spontaneously engulf micron-sized objects.41 We frequently observed the spontaneous uptake of the microchips by Normal Human Dermal Fibroblasts (NHDF) as well as HeLa cells. Seeding cells and microchips in equal concentrations 24 hours prior to Raman measurements typically results in roughly 40% of cells with incorporated microchips (Table 1). The intracellular localisation of the microchips is verified by confocal microscopy (Fig. 3) of NHDF cells labelled with the fluorescenlty tagged lectin, WGA-AF488, that selectively binds glycans at the extracellular side of the plasma membrane. Orthogonal views (Fig. 3(a)) as well as 3D renderings (Fig. 3(b)), prove that the microchips are indeed within the cytoplasm of the cell. In order to assess cell viability, the microchips were incubated with a cell culture of HeLa-H2B cells and monitored overnight by confocal time-lapse microscopy. The montage in Fig. 3(c) shows two cells, one with a single microchip and another with multiple microchips incorporated, undergoing mitosis. Note the redistribution of microchips among daughter cells. Cell division was frequently observed, while there were no significant differences in the fraction of divided cells and mitotic time span when comparing cells with and without microchips (Table 1) over a population of respectively 51 and 121 cells. This data indicates the low impact of the microchips on cell viability. An important characteristic of our planar microchips is that they consume only a small portion of the cell-volume when compared to nanoparticle-coated microbeads,27,28 while maximizing the surface/volume ratio available for SER-detection. For example, a 5 μm × 200 nm disk consumes roughly 0.15% of the volume of a typical HeLa cell,49 while a 5 μm bead would occupy a volume of 2.5%.
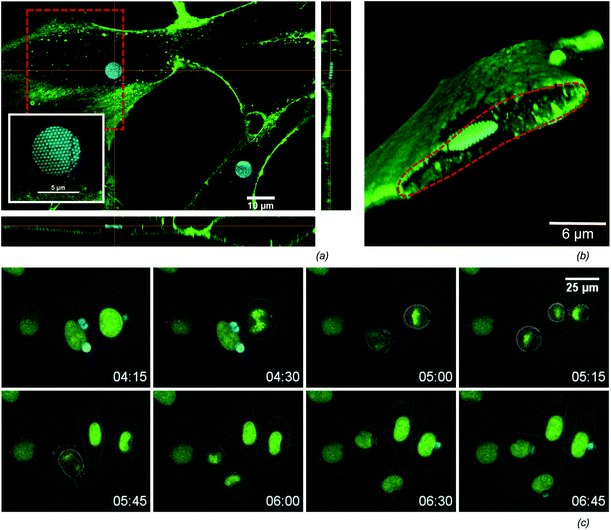 |
| | Fig. 3 (a) The intracellular uptake in NHDF cells is confirmed by confocal fluorescence microscopy. A cross section view shows a highly reflective microchip surrounded by the green labelled membrane. The 450 nm-periodic nanodome pattern on the chip can be seen from the high-resolution picture in the inset. (b) A 3D volume rendering (using alpha blending) from the confocal slices makes the intracellular localisation more clear. The volume rendering was sliced along the red dashed area in (a). (c) HeLa cells with a fluorescent labelled nucleus were followed in time to visualize mitosis of cells containing microchips (see also Table 1), where the nucleus is green labelled and the cell boundary is visible on the overlayed transmission image. | |
Table 1 Mitosis of HeLa-H2B cells, starting 24 h after seeding cells with microchips. No significant difference is found between mitosis of cells with and without microchips
| |
Cells with chip |
Cells without chip |
| Number of cells |
51 |
121 |
| Fraction of divided cells (8 h) |
0.37 |
0.36 |
| Mitotic time span |
64 ± 18 min |
61 ± 17 min |
2.4 Intracellular SERS
A promising application of intracellular SERS is the detection of extraneously delivered molecules.17,18,50 As a proof-of-concept experiment, we use the nanodome-patterned microchips for an intracellular detection of the model-molecule rhodamine 6G (R6G). The microchips are added to the cell culture 24 hours prior to the experiment, after which a large fraction of them was internalized by NHDF cells. The microchip-containing cells are imaged on an inverted confocal Raman microscope. Subsequently, a 2 μM solution of R6G was added to the cell culture and detected in the cell. Both the intracellular localisation of the microchips as the R6G molecules is confirmed through respectively confocal reflection and confocal fluorescence microscopy (Fig. 4(a)). On this same cell, SERS spectra are acquired from the area highlighted by the red box in Fig. 4(b). The integrated intensity of the Stokes scattered light shows that, as expected, only Raman signals are observed on top of the microchips (inset of Fig. 4(b)). On several positions on the microchips the SERS spectrum of R6G is detected, highlighted by integrating the 1365 cm−1 R6G-peak (green dots in inset in Fig. 4(b)). Single spectra from this area are plotted in Fig. 4(c), showing a good correspondence of the R6G SERS spectrum with a reference SERS spectrum. This undoubtedly demonstrates the label-free intracellular detection of these molecules. Furthermore an exemplary spectrum from a different position is shown, containing peaks from other molecules present on the gold surface. This is probably originating from adsorbed proteins during or after uptake of the microchip.
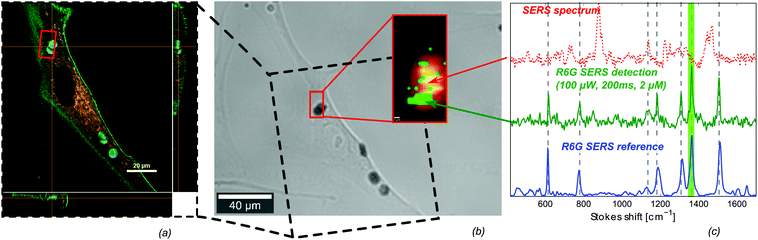 |
| | Fig. 4 Label-free intracellular detection of Rhodamine-6G. (a) Confocal fluorescence scan of a single cell with several nanodome-patterned microchips show the intracellular localisation of the microchips, as well as the uptake and inhomogeneous distribution of R6G in the cell. (b) Transmission image of the same cell, where SERS spectra are mapped over the region marked with a red square. The inset shows the integrated number of counts in the 400–1700 cm−1 region (graded red-yellow), on top of which the presence of the 1365 cm−1 R6G-peak is highlighted in green, which corresponds to the green shaded area in (c). (c) SERS spectra on different positions of the microchip show the intracellular SERS detection of R6G (middle, green) and the R6G reference SERS spectrum (bottom, blue), while other positions show the presence of peaks related to other molecules adsorbed on the microchip (dotted red, top). Spectra are normalized and offset for clarity. | |
Identical nanostructured chips with a predefined enhancement, such as used in these experiments, should in principle enable quantitative SERS experiments. However, there are a number of additional complications related to intracellular sensing with nano- or microparticles. Apart from the uptake itself, the location of the microchip in the cell is of importance for the applicability of the chip for intracellular sensing. Although a few papers report on the free localisation of micro-particles in the cytosol,3,51,52 most research on the uptake and localisation of micro-particles indicates that these structures are located in phagosomes, or lysosomes in a later stage.41,53 As a consequence, a lipid bilayer possibly isolates the particles from the cytosol. This lipid membrane may complicate a sensitive detection of processes and molecules in the cytosol. In order to investigate whether the microchips are freely available in the cytosol or surrounded by a lipid membrane, we checked for colocalization of the microchips with the fluorescent dyes Lysotracker Red DND-99, which selectively accumulates in acidic cellular compartments, and Vybrant DiI, a lipophilic membrane stain which labels all intracellular lipid vesicles. We did not observe colocalization of the microchips with these dyes under confocal fluorescence microscopy (ESI Fig. S5 and S6†). Although this indicates that the microchips are neither in lysosomes nor in other lipid vesicles, further experiments are needed to determine the exact intracellular location of the microchips. An additional problem lies in the adsorption of a protein corona on nano- and microparticles before, during and after their cellular uptake.40 This protein corona forms an extra barrier for molecules to reach the plasmonic hot spots from the SERS substrates. Further research is needed to identify potential solutions to the aforementioned problems. Although the intracellular detection of R6G may be of limited importance from a biological point of view, this result indicates the potential of the microchips in applications such as a label-free monitoring of intracellular drug delivery.17,18,54 Also, binding reporter molecules to the chips can allow indirect probing of cellular parameters like pH27 or reactive oxygen.21 Finally, functionalizing the surface with a peptide substrate may enable stable, single-cell, label-free monitoring of enzymatic activity.55 The focus of this work is on intracellular sensing, but reproducible and traceable SERS microchips can also be promising for the detection of biomolecules in other environments such as tissues or fluids.
3 Conclusions
Gold nanopatterned microchips allow to bring the world of uniform, reproducible SERS substrates to intracellular applications. We optimized a fabrication scheme for microchips inspired by nanosphere lithography to demonstrate the power of this approach. These microchips were characterized in the near and far field and successfully benchmarked to the traditional NSL-substrates. Furthermore we demonstrated the intracellular uptake of these microchips and indicated their low cytotoxicity by demonstrating normal mitosis statistics of cells with incorporated microchips. In a proof-of-concept application, extraneously added molecules were detected by their SERS spectrum in the cell. This was verified by confocal fluorescence microscopy. In contrast to existing approaches like colloidal gold nanoparticles, our chips offer a controllable SERS enhancement as they are not subject to aggregation and offer a predefined gold nanopattern. Furthermore the planar shape leads to a reduced volume in the cell as compared to nanoparticle-coated microbeads, while retaining the traceability of a micron-sized structure. Although the experiments presented in this paper do not yet surpass results that have been achieved using colloidal gold nanoparticles, our new approach of using top-down fabricated nanopatterns for intracellular sensing does offer opportunities for a wide variety of SERS substrates to be used for this purpose. These may further improve the enhancement, uniformity and reproducibility of the intracellular microchips.
Acknowledgements
The authors thank L. Van Landschoot for her help with the scanning-electron microscope, S. Verstuyft for his help with cleanroom processing, P. Geiregat for the UV-Vis absorption experiments and T. Sieprath and T. Corne (all Ghent University) for advice on handling cell cultures. P. C. W. acknowledges the Research Foundation Flanders (FWO) for a predoctoral grant. A. G. S. acknowledges the Bijzonder Onderzoeksfonds (BOF) of Ghent University and FWO for funding, R. B acknowledges the ERC grant InSpectra. This research was also supported by the Hercules Foundation (AUGE013).
References
- S. Durán, S. Novo, M. Duch, R. Gómez-Martínez, M. Fernández-Regúlez, A. S. Paulo, C. Nogués, J. Esteve, E. Ibañez and J. A. Plaza, Lab Chip, 2015, 15, 1508–1514 RSC.
- M. Schubert, A. Steude, P. Liehm, N. M. Kronenberg, M. Karl, E. C. Campbell, S. J. Powis and M. Gather, Nano Lett., 2015, 15(8), 5647–5652 CrossRef CAS PubMed.
- R. Gómez-Martínez, A. M. Hernández-Pinto, M. Duch, P. Vázquez, K. Zinoviev, E. J. de la Rosa, J. Esteve, T. Suárez and J. A. Plaza, Nat. Nanotechnol., 2013, 8, 517–521 CrossRef PubMed.
- G. Shambat, S.-R. Kothapalli, J. Provine, T. Sarmiento, J. Harris, S. S. Gambhir and J. Vučković, Nano Lett., 2013, 13, 4999–5005 CrossRef CAS PubMed.
- R. Weissleder, Nat. Biotechnol., 2001, 19, 316–317 CrossRef CAS PubMed.
-
E. C. Le Ru and P. G. Etchegoin, Principles of Surface-Enhanced Raman Spectroscopy and related plasmonic effects, Elsevier, 2009 Search PubMed.
- K. A. Willets, Anal. Bioanal. Chem., 2009, 394, 85–94 CrossRef CAS PubMed.
- E. a. Vitol, Z. Orynbayeva, G. Friedman and Y. Gogotsi, J. Raman Spectrosc., 2012, 43, 817–827 CrossRef CAS.
- I. Nabiev, H. Morjani and M. Manfait, Eur. Biophys. J., 1991, 19, 311–316 CrossRef CAS PubMed.
- K. Kneipp, A. S. Haka, H. Kneipp, K. Badizadegan, N. Yoshizawa, C. Boone, K. E. Shafer-Peltier, J. T. Motz, R. R. Dasari and M. S. Feld, Appl. Spectrosc., 2002, 56, 150–154 CrossRef CAS.
- S. Pal, L. E. Depero and I. Alessandri, Nanotechnology, 2010, 21, 425701 CrossRef PubMed.
- J. Kneipp, H. Kneipp, B. Wittig and K. Kneipp, Nanomedicine, 2010, 6, 214–226 CrossRef CAS PubMed.
- A. Huefner, W. Kuan, R. Barker and S. Mahajan, Nano Lett., 2013, 13, 2463–2470 CrossRef CAS PubMed.
- S. Cinta Pinzaru, L. M. Andronie, I. Domsa, O. Cozar and S. Astilean, J. Raman Spectrosc., 2008, 39, 331–332 CrossRef CAS.
- A. Huefner, D. Septiadi, B. D. Wilts, I. I. Patel, W.-L. Kuan, A. Fragniere, R. A. Barker and S. Mahajan, Methods, 2014, 68, 354–363 CrossRef CAS PubMed.
- L. A. Austin, B. Kang and M. A. El-Sayed, J. Am. Chem. Soc., 2013, 135, 4688–4691 CrossRef CAS PubMed.
- K.-S. Ock, E. O. Ganbold, J. Park, K. Cho, S.-W. Joo and S. Y. Lee, Analyst, 2012, 137, 2852–2859 RSC.
- J. Huang, C. Zong, H. Shen, Y. Cao, B. Ren and Z. Zhang, Nanoscale, 2013, 5, 10591–10598 RSC.
- S. Bálint, S. Rao, M. M. Sánchez, P. Miskovský and D. Petrov, J. Raman Spectrosc., 2011, 2011, 1215–1221 CrossRef.
- S. W. Bishnoi, C. J. Rozell, C. S. Levin, M. K. Gheith, B. R. Johnson, D. H. Johnson and N. J. Halas, Nano Lett., 2006, 6, 1687–1692 CrossRef CAS PubMed.
- C. A. R. Auchinvole, P. Richardson, C. McGuinnes, V. Mallikarjun, K. Donaldson, H. McNab and C. J. Campbell, ACS Nano, 2012, 6, 888–896 CrossRef CAS PubMed.
- S. J. Soenen, B. Manshian, T. Thiron, M. Cornelissen, F. Vanhaecke, S. Doak, W. J. Parak, S. D. Smedt and K. Braeckmans, ACS Nano, 2012, 6, 5767–5783 CrossRef CAS PubMed.
- Y. Pan, S. Neuss, A. Leifert, M. Fischler, F. Wen, U. Simon, G. Schmid, W. Brandau and W. Jahnen-Dechent, Small, 2007, 3, 1941–1949 CrossRef CAS PubMed.
- J. P. Scaffidi, M. K. Gregas, V. Seewaldt and T. Vo-Dinh, Anal. Bioanal. Chem., 2009, 393, 1135–1141 CrossRef CAS PubMed.
- J. J. Niu, M. G. Schrlau, G. Friedman and Y. Gogotsi, Small, 2011, 7, 540–545 CrossRef CAS PubMed.
- G. Lu, H. De Keersmaecker, L. Su, B. Kenens, S. Rocha, E. Fron, C. Chen, P. Van Dorpe, H. Mizuno, J. Hofkens, J. a. Hutchison and H. Uji-i, Adv. Mater., 2014, 5124–5128 CrossRef CAS PubMed.
- S. Bálint, S. Rao, M. M. Sánchez, V. Huntosová, P. Miskovský and D. Petrov, J. Biomed. Opt., 2010, 15, 027005 CrossRef PubMed.
- A. Yashchenok, A. Masic, D. Gorin, B. S. Shim, N. A. Kotov, P. Fratzl, H. Möhwald and A. Skirtach, Small, 2013, 9, 351–356 CrossRef CAS PubMed.
-
P. C. Wuytens, A. M. Yashchenok, A. Z. Subramanian, A. G. Skirtach and R. Baets, CLEO, 2014.
- J. J. Giner-Casares and L. M. Liz-Marzán, Nano Today, 2014, 9, 365–377 CrossRef CAS.
- U. Huebner, K. Weber, D. Cialla, R. Haehle, H. Schneidewind, M. Zeisberger, R. Mattheis, H.-G. Meyer and J. Popp, Microelectron. Eng., 2012, 98, 444–447 CrossRef CAS.
- F. Peyskens, A. Z. Subramanian, P. Neutens, A. Dhakal, P. Van Dorpe, N. Le Thomas and R. Baets, Opt. Express, 2015, 23, 3088–3101 CrossRef PubMed.
- J. Li, C. Chen, H. Jans, X. Xu, N. Verellen, I. Vos, Y. Okumura, V. V. Moshchalkov, L. Lagae and P. Van Dorpe, Nanoscale, 2014, 6, 12391–12396 RSC.
- J. C. Hulteen and R. P. Van Duyne, J. Vac. Sci. Technol., A, 1995, 13, 1553–1558 Search PubMed.
- D. a. Stuart, C. R. Yonzon, X. Zhang, O. Lyandres, N. C. Shah, M. R. Glucksberg, J. T. Walsh and R. P. Van Duyne, Anal. Chem., 2005, 77, 4013–4019 CrossRef CAS PubMed.
- C. Farcau and S. Astilean, J. Phys. Chem. C, 2010, 114, 11717–11722 CAS.
- M. Tabatabaei, A. Sangar, N. Kazemi-Sanjani, P. Torchio, A. Merlen and F. Lagugné-Labarthet, J. Phys. Chem. C, 2013, 117, 14778–14786 CAS.
- J. McPhillips, C. McClatchey, T. Kelly, A. Murphy, M. P. Jonsson, G. A. Wurtz, R. J. Winfield and R. J. Pollard, J. Phys. Chem. C, 2011, 115, 15234–15239 CAS.
- M. Wang, L. Fu, L. Gan, C. Zhang, M. Rümmeli, A. Bachmatiuk, K. Huang, Y. Fang and Z. Liu, Sci. Rep., 2013, 3, 1238 Search PubMed.
- M. P. Monopoli, C. Aberg, A. Salvati and K. a. Dawson, Nat. Nanotechnol., 2012, 7, 779–786 CrossRef CAS PubMed.
- A. Muñoz Javier, O. Kreft, M. Semmling, S. Kempter, A. G. Skirtach, O. T. Bruns, P. del Pino, M. F. Bedard, J. Rädler, J. Käs, C. Plank, G. B. Sukhorukov and W. J. Parak, Adv. Mater., 2008, 20, 4281–4287 CrossRef.
- P. Colson, R. Cloots and C. Henrist, Langmuir, 2011, 27, 12800–12806 CrossRef CAS PubMed.
- M. J. K. Klein, F. Montagne, N. Blondiaux, O. Vazquez-Mena, H. Heinzelmann, R. Pugin, J. Brugger and V. Savu, J. Vac. Sci. Technol., B, 2011, 29, 021012 Search PubMed.
- W. Xie, Y. Zhu, T. Aubert, S. Verstuyft, Z. Hens and D. Van Thourhout, Opt. Express, 2015, 23, 12152 CrossRef PubMed.
- H.-Y. Wu, C. J. Choi and B. T. Cunningham, Small, 2012, 8, 2878–2885 CrossRef CAS PubMed.
- J. Beuthan, O. Minet, J. Helfmann, M. Herrig and G. Müller, Phys. Med. Biol., 1996, 41, 369–382 CrossRef CAS PubMed.
- P. Wuytens, B. Parakhonskiy, A. Yashchenok, M. Winterhalter and A. Skirtach, Curr. Opin. Pharmacol., 2014, 18, 129–140 CrossRef CAS PubMed.
- R. Palankar, A. G. Skirtach, O. Kreft, M. Bédard, M. Garstka, K. Gould, H. Möhwald, G. B. Sukhorukov, M. Winterhalter and S. Springer, Small, 2009, 5, 2168–2176 CrossRef CAS PubMed.
- L. Zhao, C. Kroenke, J. Song, D. Piwnica-Worms, J. Ackerman and J. J. Neil, NMR Biomed., 2008, 21, 159–164 CrossRef CAS PubMed.
- E. A. Vitol, Z. Orynbayeva, M. J. Bouchard, J. Azizkhan-clifford, G. Friedman and Y. Gogotsi, ACS Nano, 2009, 3, 3529–3536 CrossRef CAS PubMed.
- U. Reibetanz, C. Claus, E. Typlt, J. Hofmann and E. Donath, Macromol. Biosci., 2006, 6, 153–160 CrossRef CAS PubMed.
- D. Studer, R. Palankar, M. Bédard, M. Winterhalter and S. Springer, Small, 2010, 6, 2412–2419 CrossRef CAS PubMed.
- S. De Koker, R. Hoogenboom and B. G. De Geest, Chem. Soc. Rev., 2012, 41, 2867 RSC.
- J. Yang, Y. Cui, S. Zong, R. Zhang, C. Song and Z. Wang, Mol. Pharm., 2012, 9, 842–849 CrossRef CAS.
- G. L. Liu, Y. T. Rosa-Bauza, C. M. Salisbury, C. Craik, J. A. Ellman, F. F. Chen and L. P. Lee, J. Nanosci. Nanotechnol., 2007, 7, 2323–2330 CrossRef CAS PubMed.
Footnote |
| † Electronic supplementary information (ESI) available: Methods, characterisation of nanosphere lithography-fabricated surface and confocal fluorescence data on intracellular microchip localisation. See DOI: 10.1039/C5AN01782C |
|
| This journal is © The Royal Society of Chemistry 2015 |
Click here to see how this site uses Cookies. View our privacy policy here. 
 Open Access Article
 This Open Access Article is licensed under a Creative Commons Attribution-Non Commercial 3.0 Unported Licence