
 Open Access Article
 This Open Access Article is licensed under a
 Creative Commons Attribution 3.0 Unported Licence
Label-free microfluidic free-flow isoelectric focusing, pH gradient sensing and near real-time isoelectric point determination of biomolecules and blood plasma fractions†
Elisabeth
Poehler
a,
Christin
Herzog
a,
Carsten
Lotter
a,
Simon A.
Pfeiffer
a,
Daniel
Aigner
b,
Torsten
Mayr
b and
Stefan
Nagl
 *a
*a
aInstitut für Analytische Chemie, Universität Leipzig, Johannisallee 29, 04103 Leipzig, Germany. E-mail: nagl@chemie.uni-leipzig.de
bInstitut für Analytische Chemie und Lebensmittelchemie, Technische Universität Graz, Stremayrgasse 9/III, 8010 Graz, Österreich, Austria
First published on 2nd October 2015
Abstract
We demonstrate the fabrication, characterization and application of microfluidic chips capable of continuous electrophoretic separation via free flow isoelectric focussing (FFIEF). By integration of a near-infrared (NIR) fluorescent pH sensor layer under the whole separation bed, on-line observation of the pH gradient and determination of biomolecular isoelectric points (pI) was achieved within a few seconds. Using an optical setup for imaging of the intrinsic fluorescence of biomolecules at 266 nm excitation, labelling steps could be avoided and the native biomolecules could be separated, collected and analysed for their pI. The fabricated microchip was successfully used for the monitoring of the separation and simultaneous observation of the pH gradient during the isoelectric focussing of the proteins α-lactalbumin and β-lactoglobulin, blood plasma proteins and the antibiotics ampicillin and ofloxacin. The obtained pIs are in good agreement with literature data, demonstrating the applicability of the system. Mass spectra from the separated antibiotics taken after 15 minutes of continuous separation from different fractions at the end of the microchip validated the separation via microfluidic isoelectric focussing and indicate the possibility of further on- or off-chip processing steps.
Introduction
Protein analysis has evolved into proteomics and become one of the most investigated areas of biological research.1,2 Owing to the complexity of biological matrices, separation techniques are very important for the pretreatment of proteomic samples.3 2D gel electrophoresis is often used for proteomic analysis and also enables preparative protein purification.4,5 Free-flow electrophoresis (FFE) has been miniaturized on microfluidic chips6,7 and is often used for preseparation of biological mixtures prior to gel electrophoresis or other analysis methods because it is a mild preparative technique that is able to keep biomolecules in their native conformation and enable continuous separations.8–10 In the last few years various microfluidic-chip based FFE platforms were presented offering very little sample consumption, short analysis times and moderately high resolution separations.11,12 A variant of miniaturized FFE is the microfluidic free-flow isoelectric focussing (μFFIEF).13–16 Here the molecules are separated according to their isoelectric point (pI) in a pH gradient, which is established by ampholyte mixtures or switchable pH actuators.17 Determination of the pI distribution allows the assignment and may be used for identification of biological material18 but so far this is mostly performed by off-line methods and therefore needs additional time consuming steps.19,20Optical fluorescent and luminescent chemical sensors allow fast, sensitive and selective analysis of different parameters.21,22 Fluorescent and luminescent pH sensors are widely applied in the monitoring of bioprocesses.23
Aigner et al. invented optical pH sensors based on a perylene bisimide chromophore (PBI).24 These complexes are known for their high molar absorption coefficient, good fluorescence quantum yields and extraordinary photostability.25–27 A PBI-based pH sensor matrix which shows pH-sensitive fluorescence emission in the near-infrared (NIR) wavelength was described recently.28 This material is also favorable for integration into a microfluidic structure because the backbone polymer contains acrylate groups that may be photopolymerized. pH probes which show fluorescence in the NIR have some major strengths in the reduced biological scattering and fluorescence background of other components compared to those in the visible range.
Luminescent pH sensors were incorporated into microfluidic devices using various methods such as photolithography, inkjet printing, dip and blade spin coating.29–36 Earlier we presented a photopolymerization method for the integration of a pH sensor layer within an FFE separation bed for the spatially resolved determination of isoelectric points of proteins and other biomolecules37 and described the fabrication and application of microfluidic isoelectric focusing chips with integrated pH sensitive sensor spots or arrays.38,39 These approaches allowed for the observation of the pH gradient with an integrated fluorescent pH sensor and on-line pI determination of proteins but still needed an off-line labeling step.
One major challenge in microfluidic separation techniques is the detection and spatially resolved monitoring of the separation process. Absorbance detection is a widely utilized method, but limited in sensitivity when using microfluidic platforms with short optical path lengths.40 In this regard, fluorescence detection is mostly used because of the superior sensitivity as well as selectivity and is therefore commonly applied in microfluidics. Labelling steps are usually necessary to enable fluorescence detection.41
This can change the chemical properties of the analyte like its charge and size and may have an adverse effect on their separation. Label-free Raman spectroscopy offers molecular information but suffers from poor sensitivity.42 A suitable way to avoid elaborate labeling steps is to use the deep UV spectral range (<300 nm) for excitation of the native fluorescence of many biomolecules.43 The advantage compared to UV absorbance detection is the higher sensitivity for natively fluorescent compounds. This approach has been realized frequently in capillary electrophoresis (CE)44–47 and microchip capillary electrophoresis (MCE)48,49 but also in gel electrophoresis (GE)50 and in micro free-flow electrophoresis (μFFE).51
In this work, we apply label-free detection via deep UV fluorescence excitation in μFFIEF and combine it with the online observation of the pH gradient in the isoelectric focusing of proteins, antibiotics and blood plasma. To achieve this we fabricated a microfluidic quartz FFIEF chip with an integrated near infrared (NIR) fluorescent pH sensor layer. This allowed the label-free observation of the separation and the simultaneous identification via pI determination within a few seconds residence time. The preparative separation of antibiotics was verified by mass spectra of collected fractions at the outlets.
Experimental
Microchip fabrication
For the online observation of the pH gradient during the isoelectric focusing of native bioanalytes we used an indicator based on a perylene bisimide (PBI). For the microchip fabrication we used the covalent linking of this indicator on a hydrogel matrix according to ref. 28 and two individual photopolymerization steps for the preparation of the microchip in a modified procedure based on ref. 37. The fabrication process and the materials for the fabrication of the microchips are schematically illustrated in Fig. 1.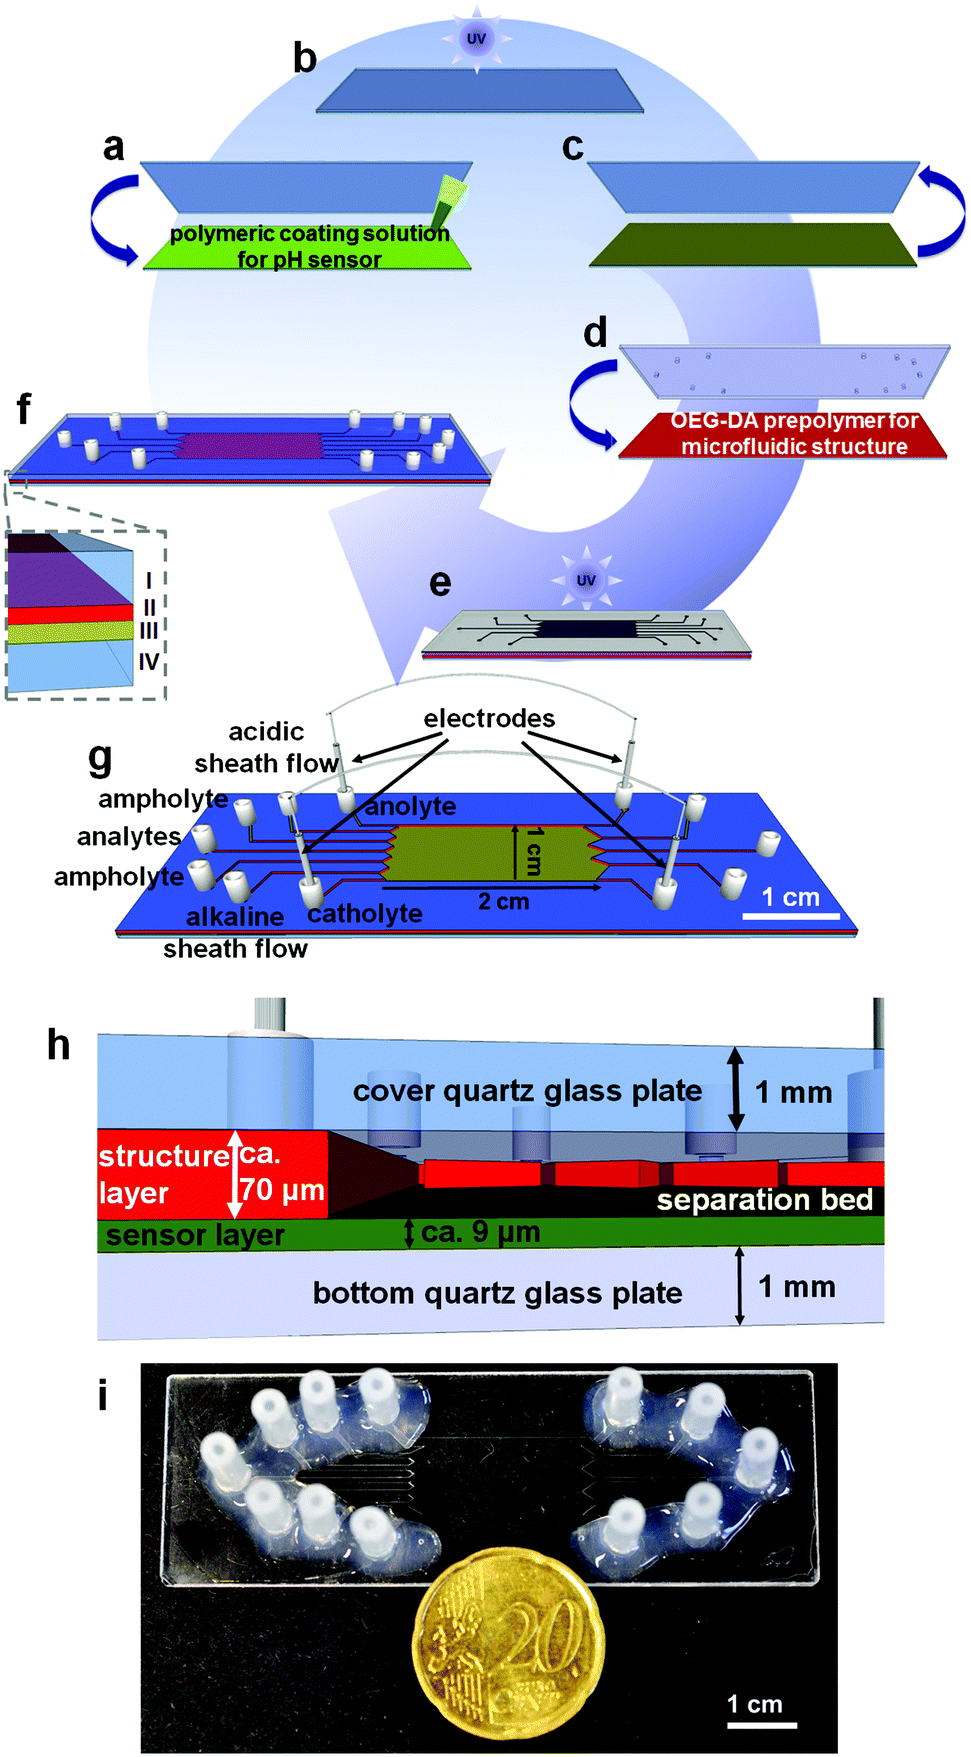 | ||
| Fig. 1 Schematic illustration of the fabrication process of μFFIEF chips with an integrated polymeric pH sensor layer: (a) coating of the prepolymer on a silanized quartz glass slide, (b) photopolymerization via UV excitation for 15 s, (c) removal of the untreated glass slide, (d) deposition of the polymer for the microfluidic structure (OEG-DA), (e) application of a photomask and UV exposure for 1.3 s and (f) final microchip after removal of uncured polymer: (I) cover quartz glass with access holes, (II) microfluidic structure layer, (III) covalently linked sensor layer and (IV) bottom glass plate, (g) schematic image of the microfluidic chip with the corresponding channel layout, (h) cross section of the microchip with heights of the layers (not to scale) and (i) a macroscopic image of the whole microchip and size comparison with a 20 eurocent coin. | ||
The first step was the polymerization of the pH sensor structure. The sensor layer consists of 85.0% (w/w) acrylomorpholine, 14.8% (w/w) OEG-DA700, 0.2% (w/w) 2-hydroxy-4′-(2-hydroxy)-2-methylpropiophenone which serves as the photoinitiator and 0.02% (w/w) of the NIR fluorescent pH probe (1-aminoperylene bisimide, PBI). 60 μL of this solution was placed between a silanized quartz glass slide and an untreated borosilicate glass slide (Fig. 1a).
The polymeric solution was exposed to UV light for 15 s (Fig. 1b) via a flood exposure illuminator (4′′ FE5 Flood Exposure with an Hg light source (14 mW cm−2 at 365 nm) SÜSS MicroTec AG, München, Germany). Afterwards the untreated glass slide was removed (Fig. 1c). In a second step 100 μL of the OEG-DA258 including 0.1% (w/w) of the photoinitiator DMPA was applied onto the fluorescent polymeric layer (Fig. 1d). This prepolymer forms the microfluidic structure in the next step. A silanized quartz glass slide with powder blasted holes serves as the cover plate and a photomask containing the microfluidic structure was placed on the uncured polymer solution.
The assembly was photopolymerized for 1.3 s (Fig. 1e). The remaining uncured polymer was removed under reduced pressure via the introduced access holes. The microchip was exposed to UV light for another 1.3 s. For microfluidic contacting silicone tube sections (60° shore, 1.30 × 1.25 mm, ESSKA, Hamburg, Germany) were fixed on top of the cavities in the cover plate with silicone glue (Wacker Elastosil E 43, ACE, Freilassing, Germany) (Fig. 1f).
The entire process is schematically illustrated in Fig. 1a–f, the channel designations are illustrated in Fig. 1g. The height of the sensor structure was determined to be 9.3 ± 1.6 μm with a homogeneous probe distribution. The whole system containing the sensor layer and the structure layer was measured as 79.9 ± 9.7 μm which leads to an average height of 70.6 μm for the microfluidic structure (Fig. 1h). The electrode channels are 700 μm in width and the remaining inlet and outlet channels are 400 μm in width. The separation bed was 10 mm wide and 20 mm long (Fig. 1i). To remove unbound polymer which could precipitate inside the microchannels by contact with water, the chip was flushed with iso-propanol.
Optical setup
We used an inverted fluorescence microscope (IX-71, Olympus, Tokyo, Japan) which was equipped with a 660 nm LED (M660L3, Thorlabs, Dachau, Germany) as the light source for the integrated pH sensor, controlled via a high power LED driver (DC2100, Thorlabs, Dachau, Germany), a Fluar 2.5×/0.12 objective (Zeiss, Jena, Germany) and a PRO EM 512 EMCCD camera system (Princeton Instruments, Warstein, Germany) for the optical observation of the pH gradient and the separated analytes. For 266 nm excitation of the intrinsic fluorescence of the biomolecules we employed a 140 mW, 20 MHz picosecond Nd:YVO4 laser (Cougar, Time-Bandwidth Products, Zurich, Switzerland).Results and discussion
Measurement setup
A microscopic setup was built for deep UV fluorescence detection of the electrophoretic separation and simultaneous observation of the pH gradient in the NIR and is described below. The setup was implemented for the combination of two imaging excitation light sources, one for the sensor layer and the other for the intrinsic fluorescence of the biomolecules. The 660 nm LED was equipped on the back port of an inverted fluorescence microscope and the laser was coupled with different optics for excitation from above the microscope. The laser power was set to 95 mW for the protein and plasma separation and 40 mW for the separation of the antibiotics. For the coupling of the laser with the microscope, different filter optics were used. In Fig. 2 the schematic measurement setup is presented.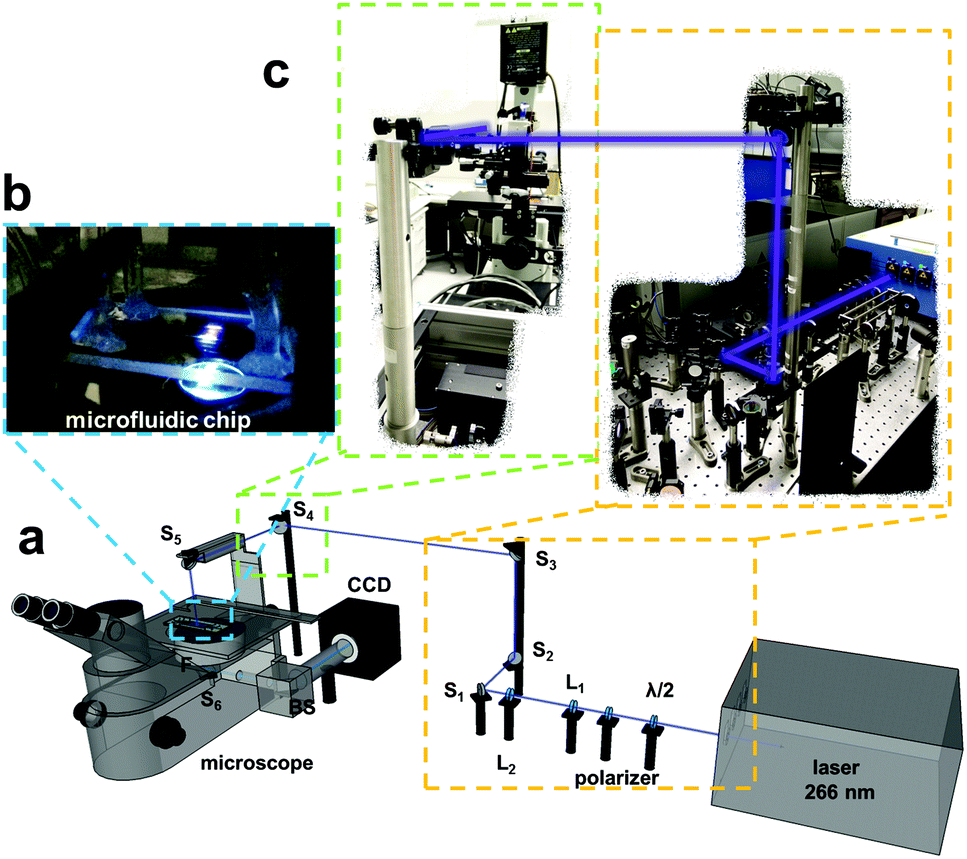 | ||
| Fig. 2 (a) Schematic illustration of the measurement setup with employed lenses L1 (fused silica, 40 mm) and L2 ((fs) 300 mm), the used mirrors M1 to M4 (NB1-K04) and M5 (Z266), the applied filter cubes (protein and plasma: λem = 330–385 nm, antibiotics: λem = 510/80 nm, pH-sensor: λexc 650/60 nm, λem 732/68 nm) and a ProEM 512 EMCCD camera. (b) Macroscopic image of the microchip placed on the microscope with laser excitation from above and (c) macroscopic image of the lensing system for the coupling of the laser with the fluorescence microscope. | ||
A half-wave plate and a polarizer were introduced into the beam at the laser output to be able to adjust the laser power easily and the beam was guided using different lenses (Fig. 2 L1 and L2) and mirrors (Fig. 2 M1 to M5) to excite the separation area in the microchip from the top. The laser light illuminates the microchip and the emission is collected with an objective. It then passes an emission filter (Fig. S2,† proteins and plasma sample: λem = 330–385 nm, antibiotics: λem = 470–550 nm) and is transferred to an EMCCD camera via a further mirror (Fig. 2 M6) and a beam splitter (Fig. 2 BS). The borosilicate glass bottom of the microfluidic chip serves as an additional emission filter rejecting 266 nm excitation light.
For the observation of the pH gradient we used the 660 nm LED to excite the sensor structure and detect the sensor emission via a filter set for red excitation and near infra-red (NIR) emission (λexc 650/60 nm, λem 732/68 nm). For all measurements the LED input power was set to 1000 mA. To prevent photobleaching of the sensor structure caused by the laser, a pinhole was placed in the laser beam on top of the microscope to reduce the illuminated region. This leads to an illumination area of around 12 mm2 for the microchip (Fig. 2b). In Fig. 2c a macroscopic image of the lensing and mirror system for the coupling of the laser with the fluorescence microscope is shown.
Characterization of the integrated fluorescent pH sensor
Results from the characterization of the pH sensor are shown in the ESI section 2.2† and have been partially reported before in ref. 52. Briefly, the pH response of the sensor was recorded with 10 mM Britton–Robinson buffers and we obtained a sigmoidal response curve for the fluorescence intensity with pH with a pKa value of 5.91 ± 0.09 and a working range from approximately pH 4.9 to pH 7.2. The calibration curve was very reproducible over the long storage period of the microchips and the fabrication charge.The microchips as well as the sensor matrix showed no significant ageing effect over several weeks of storage in the dark. The response times t95 of the sensor, which were determined for fast changes from pH 3 and pH 10, were determined as 5.9 s from acidic to alkaline and 7.1 s from alkaline to acidic. Furthermore the fluorescent pH sensor showed a high flow stability at a linear flow rate of 25 μL min−1 with an intensity loss of only 3.7 ppm s−1, due to the covalent linking of the fluorophore and the polymeric matrix and a good photostability investigated via constant LED illumination over 30 minutes where the fluorescence intensity decreases with a rate of around 27 ppm s−1.
Label-free detection and real-time observation of the pH gradient during the FFIEF of biomolecules
The prepared microfluidic chips with an integrated NIR-fluorescent pH sensor were applied for the label-free observation of the on-chip separation of the proteins β-lactoglobulin B and α-lactalbumin, the separation of blood plasma proteins into albumin and globulin fractions and of the antibiotics ampicillin and ofloxacin. A common problem in free-flow electrophoresis is the formation of gas bubbles formed by electrolysis of water. However, in this work only relatively moderate electric field strengths were employed so that bubbles formed at the electrodes could be transported away mostly by the fluid flow in the electrode channel. Especially the IEF separation of the antibiotics was very stable over many minutes whereas the protein and plasma separations occasionally showed instabilities in the flow presumably caused mostly by gas formation.All separations could be established within less than 20 seconds (see also ESI video 1†). Optical pH monitoring in FFIEF via the integrated sensor layer enabled the determination of pIs of the focused analytes. Fig. 3 shows the results of the separations and the detected pH gradient. The distribution of the polymeric pH sensor layer was homogeneous and enabled the pH monitoring in every part of the separation bed. Furthermore, via the integration of a hydrophilic layer inside the separation channel a permanent coating of the glass surface could be achieved which enabled a good suppression of detrimental electroosmotic flow.
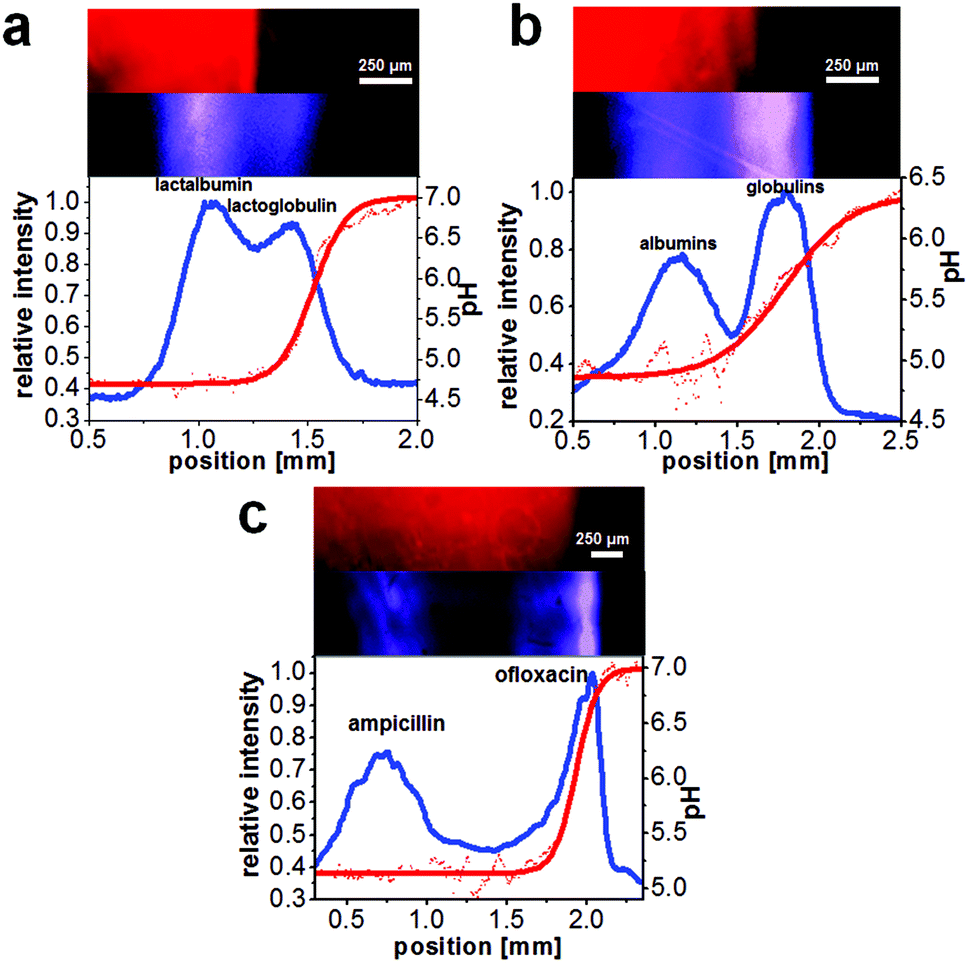 | ||
| Fig. 3 Label-free free-flow IEF of biomolecules with on-line observation of the separation via deep UV excited fluorescence and pH monitoring via an NIR fluorescent pH sensor. On top: false-colored fluorescence images of the sensor and the analyte channel, bottom: electropherograms (blue line) and the corresponding pH readout (red line, background corrected) for shown measurement. (a) Separation of the proteins α-lactalbumin and β-lactoglobulin B (conc. 300 μmol L−1 each, linear analyte velocity: 0.36 mm s−1, applied electric field: 90 V cm−1). (b) Separation of blood plasma (linear analyte velocity: 0.25 mm s−1, electric field: 152 V cm−1). (c) Separation of the antibiotics ampicillin (conc. 859 μmol L−1) and ofloxacin (conc. 251 μmol L−1, linear analyte velocity: 0.26 mm s−1, electric field: 20 V cm−1). | ||
With a lateral fit of the sensor readout through the separation bed the local pH could be calculated and the focused analyte bands could be assigned to distinct pI values (Table 1). All presented results for pI determination were calculated from three different experimental procedures respectively, allowing the calculation of standard deviations.
The pH gradient was generated via a 0.1% (w/w) ampholyte pH 4–7 solution. This polyionic compound mixture was introduced into the chip via two flanking inlets to the analyte solution (see Fig. 1g). Upon application of an electric field perpendicular to the flow regime they orient gradually on this axis according to their differing isoelectric points thereby establishing a pH gradient in the separation chamber. This relatively low ampholyte concentration was chosen as a compromise between separation capability and background caused by these ampholytes that were present both in UV fluorescence imaging and the mass spectra of the freshly separated compounds that we wanted to investigate (Fig. 4c and d).
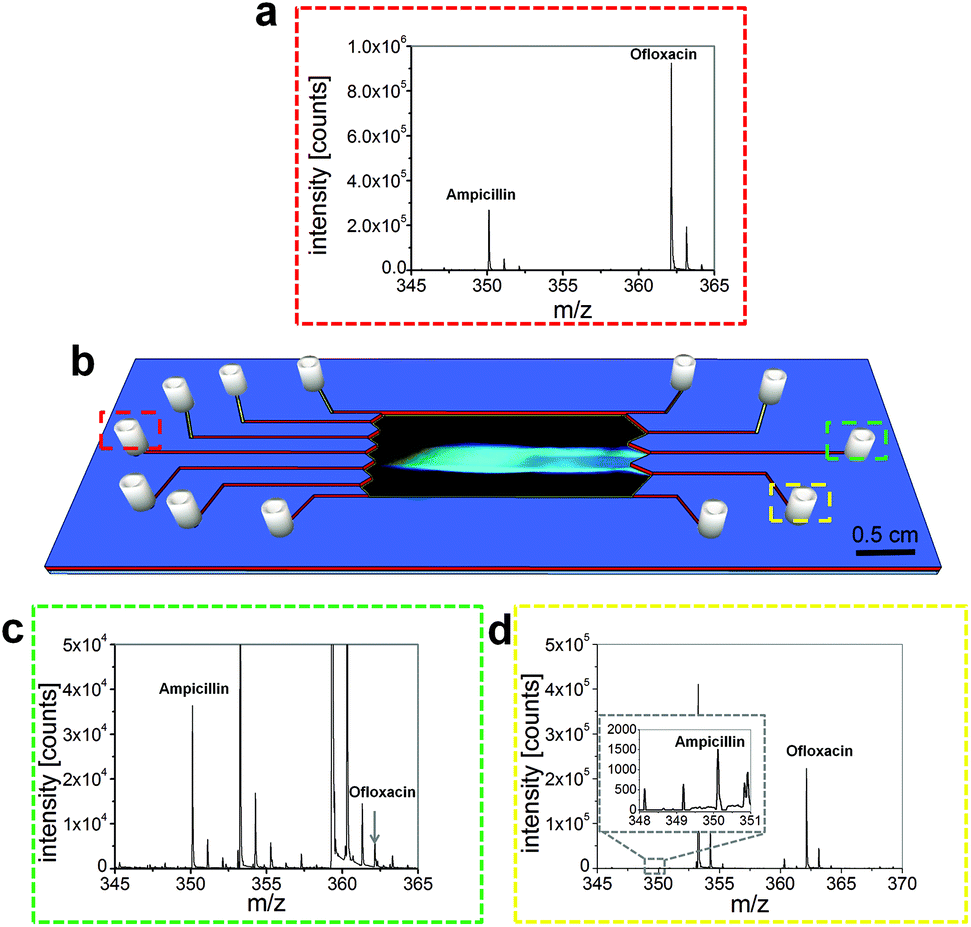 | ||
| Fig. 4 (a) Mass spectra of the mixture before separation, injected into the analyte inlet (red square on the left), (b) schematic illustration of the microfluidic chip with an overlaid image of the separation of two antibiotics, Mass spectra of (c) the fraction with separated ampicillin (green square on the right in the middle) and (d) the fraction with separated ofloxacin (yellow square on the right in the lower half). | ||
The two proteins α-lactalbumin and β-lactoglobulin B had a concentration of 300 μmol L−1 each and the parameters for the separation were 0.36 mm s−1 linear velocity and 90 V resulting in 270 μA electrical current. The calculated pIs were in good agreement with literature values (Table 1). The chromatographic resolution was calculated to be 0.6 (Fig. 3a).
In Fig. 3b the separation of bovine blood plasma into albumin and globulin fractions is shown. The plasma was diluted (1![[thin space (1/6-em)]](https://www.rsc.org/images/entities/char_2009.gif) :1, v/v) with a buffer solution (carbonate and PBS buffer 9:1) as recommended by the manufacturer to prevent precipitation of the blood plasma proteins. Ampholyte pH 4–7 was added to a final concentration of 0.1% and this solution was introduced via the analyte inlet. The parameters for the separation were 0.25 mm s−1 linear velocity and 152 V resulting in 900 μA electrical current. The chromatographic resolution for the separation was determined as 0.8 (Fig. 3b). The calculated pIs for the blood plasma fractions are also in good agreement with literature values (Table 1).
:1, v/v) with a buffer solution (carbonate and PBS buffer 9:1) as recommended by the manufacturer to prevent precipitation of the blood plasma proteins. Ampholyte pH 4–7 was added to a final concentration of 0.1% and this solution was introduced via the analyte inlet. The parameters for the separation were 0.25 mm s−1 linear velocity and 152 V resulting in 900 μA electrical current. The chromatographic resolution for the separation was determined as 0.8 (Fig. 3b). The calculated pIs for the blood plasma fractions are also in good agreement with literature values (Table 1).
Fig. 3c shows the result for the separation of the antibiotics ampicillin with a concentration of 859 μmol L−1 and ofloxacin with a concentration of 251 μmol L−1. The parameters for the separation were 0.26 mm s−1 linear velocity and 20 V resulting in 48 μA electrical current. The chromatographic resolution was 1.3, therefore the antibiotics were almost baseline separated (Fig. 3c). The determined pIs were in agreement with literature values (Table 1).
It should be noted that the determined isoelectric point of analytes with a pI at or below 5 should be viewed with some caution as the sensitivity of the integrated pH sensor is only high between approximately pH 4.9 and 7.2 (see Fig. S3a in the ESI†). As a result, the determined pIs below 5.0 should be viewed mostly as an upper limit for the actual pI. In the future this limitation could be overcome by integration of a sensor matrix with a different pH working range. Nevertheless, all analytes in the mixtures investigated herein could be clearly differentiated from another based on their determined pIs.
In summary, these multifunctional microfluidic chips showed good results for the on-line observation as well as the pI determination of different bioanalytes. The obtained chromatographic resolutions are comparable to those of other μFFIEF platforms.13–17,20 The lower resolution of the proteins compared to the antibiotics is caused by their more similar isoelectric points. The difference between the pIs of the proteins amounted to about 0.7 while the difference between the pIs of the antibiotics is about 1.8.
In the future the resolution of the separations could potentially be improved by further optimization of the separation bed design, applied fluid flows and electric fields and the resulting focused analyte concentrations or utilization of a preseparated ampholyte mixture.53 Another method would be the combination of several μFFIEF systems into a 2D system.54
Since many pIs of biomolecules are in range covered by this integrated sensor layer, the developed μFFIEF platform is expected to be very useful for the separation of many biomolecules. The integration of the sensor as layer allows the observation of the pH gradient in the whole separation bed. The use of an NIR fluorescent pH sensor guaranteed full spectral separation of the fluorescence of the biomolecules and the sensor layer.
Collection of fractions and mass spectrometric analysis
To investigate the quality of the separation, we took fractions of the focused antibiotics and analyzed them via mass spectrometry (see also ESI S3†). This separation could be performed stably over at least 15 minutes, enabling the extraction of the separated fractions. Fig. 4 shows the resulting mass spectra and an illustration of the microchip with the separation. The calculated masses were 350.117 m/z for ampicillin and 362.151 m/z for ofloxacin, which is in good agreement with the detected values (Table S1†).The molecular peaks for both analytes were obtained in good intensity in the mixture (Fig. 4a). It can be seen that the peak for ofloxacin is three times higher than that of ampicillin, which is caused by the fact that ofloxacin is ionized more efficiently than ampicillin. The antibiotics could be separated far enough to introduce them into different outlets (Fig. 4b). Before the electric field was applied, the corresponding outlet was purged and briefly flushed with distilled water to remove contaminants. Then the outlets were allowed to fill. We took fractions of about 15 μL from each outlet and diluted these solutions 1:20 (v/v) with an 80% aqueous methanol solution containing 0.1% formic acid. Fig. 4c shows the MS spectrum taken from the outlet placed in the middle of the chip (Fig. 4b, green) while Fig. 4d displays the spectrum for the fraction which was taken from the outlet placed in the lower half of the chip (Fig. 4b, yellow).
Besides some background peaks caused by the ampholytes, the specific mass peaks for ampicillin and a small peak for ofloxacin were obtained. The signal at 353.269 m/z was identified as the detergent Triton N-101, while other background signals, presumably originating from the ampholyte mixture could not be assigned to specific components. The ofloxacin peak was partially overlaid by the third isotope peak of a background mass peak.
These measurements show that the antibiotics can be separated and extracted from the microchip with an acceptable although not yet perfect purity. Better purity could be achieved e.g. by introducing more outlet channels into the chip design. Overall the results nicely demonstrate the possibility that the system is capable of the separation of biomolecules with integrated monitoring of their properties such as pI and further on- or off-chip processing steps.
Conclusions
The continuous microscale separation of biomolecules via FFIEF combined with label-free detection via deep UV excitation of their intrinsic fluorescence and simultaneous pH gradient observation and determination of their isoelectric points with an incorporated NIR fluorescent sensor layer was presented. The separated analytes may be collected micropreparatively which makes further downstream processing steps possible. In the future this platform could also be combined with further separation steps, sensors, actuators or reactors for multiparameter determination in proteomics, metabolomics and in other fields.Acknowledgements
Financial support of this work by the German Research Foundation (DFG, NA 947/1-2) and the German Ministry of Education and Research (BMBF, V4KMU10/126) is gratefully acknowledged.References
- O. N. Jensen, Nat. Rev. Mol. Cell Biol., 2006, 7, 391–403 CrossRef CAS PubMed.
- Y. Shen and R. D. Smith, Electrophoresis, 2002, 23, 3106–3124 CrossRef CAS.
- X. Zhang, A. Fang, C. P. Riley, M. Wang, F. E. Regnier and C. Buck, Anal. Chim. Acta, 2010, 664, 101–113 CrossRef CAS PubMed.
- A. Rogowska Wrzesinska, M. C. Le Bihan, M. Thaysen Andersen and P. Roepstorff, J. Proteomics, 2013, 88, 4–13 CrossRef CAS PubMed.
- K. Gevaert and J. Vandekerckhove, Electrophoresis, 2000, 21, 1145–1154 CrossRef CAS.
- D. Kohlheyer, J. C. T. Eijkel, A. van den Berg and R. B. M. Schasfoort, Electrophoresis, 2008, 29, 977–993 CrossRef CAS PubMed.
- R. T. Turgeon and M. T. Bowser, Anal. Bioanal. Chem., 2009, 394, 187–198 CrossRef CAS PubMed.
- A. Rizzi, C. Gerner, M. Islinger, C. Eckerskorn and A. Völkl, Electrophoresis, 2010, 31, 1754–1763 CrossRef PubMed.
- S. Podszun, P. Vulto, H. Heinz, S. Hakenberg, C. Hermann, T. Hankemeier and G. A. Urban, Lab Chip, 2012, 12, 451–457 RSC.
- F. J. Agostino, L. T. Cherney, V. Galievsky and S. N. Krylov, Angew. Chem., Int. Ed., 2013, 52, 7256–7260 CrossRef CAS PubMed.
- N. Pamme, Lab Chip, 2007, 7, 1644–1659 RSC.
- A. Bhagat, H. Bow, H. W. Hou, S. J. Tan, J. Han and C. T. Lim, Med. Biol. Eng. Comput., 2010, 48, 999–1014 Search PubMed.
- Y. Xu, C. X. Zhang, D. Janasek and A. Manz, Lab Chip, 2003, 3, 224–227 RSC.
- D. Kohlheyer, G. A. J. Besselink, S. Schlautmann and R. B. M. Schasfoort, Lab Chip, 2006, 6, 374–380 RSC.
- Y. A. Song, M. Chan, C. Celio, S. R. Tannenbaum, J. S. Wishnok and J. Han, Anal. Chem., 2010, 82, 2317–2325 CrossRef CAS PubMed.
- B. Walowski, W. Hüttner and H. Wackerbarth, Anal. Bioanal. Chem., 2011, 401, 2465–2471 CrossRef CAS PubMed.
- L. J. Cheng and H. C. Chang, Lab Chip, 2014, 14, 979–987 RSC.
- J. Kiraga, P. Mackiewicz, D. Mackiewicz, M. Kowalczuk, P. Biecek, N. Polak, K. Smolarczyk, M. R. Dudek and S. Cebrat, BMC Genomics, 2007, 8, 163 CrossRef PubMed.
- P. G. Righetti, J. Chromatogr., A, 2004, 1037, 491–499 CrossRef CAS PubMed.
- J. Wen, E. W. Wilker, M. B. Yaffe and K. F. Jensen, Anal. Chem., 2010, 82, 1253–1260 CrossRef CAS PubMed.
- C. McDonagh, C. S. Burke and B. D. MacCraith, Chem. Rev., 2008, 108, 400–422 CrossRef CAS PubMed.
- M. Stich, L. H. Fischer and O. S. Wolfbeis, Chem. Soc. Rev., 2010, 39, 3102–3114 RSC.
- D. Wencel, T. Abel and C. McDonagh, Anal. Chem., 2014, 86, 15–29 CrossRef CAS PubMed.
- D. Aigner, S. M. Borisov and I. Klimant, Anal. Bioanal. Chem., 2011, 400, 2475–2485 CrossRef CAS PubMed.
- A. Rademacher, S. Märkle and H. Langhals, Chem. Ber., 1982, 115, 2927–2934 CrossRef CAS PubMed.
- H. Langhals, R. Ismael and O. Yürük, Tetrahedron, 2000, 56, 5435–5441 CrossRef CAS.
- C. Kohl, T. Weil, J. Qu and K. Müllen, Chem. – Eur. J., 2004, 10, 5297–5310 CrossRef CAS PubMed.
- D. Aigner, S. M. Borisov, P. Petritsch and I. Klimant, Chem. Commun., 2013, 49, 2139 RSC.
- W. Zhan, G. H. Seong and R. M. Crooks, Anal. Chem., 2002, 74, 4647–4652 CrossRef CAS.
- W. G. Koh and M. Pishko, Sens. Actuators, B, 2005, 106, 335–342 CrossRef CAS PubMed.
- P. Mela, S. Onclin, M. H. Goedbloed, S. Levi, M. F. Garcia Parajo, N. F. van Hulst, B. J. Ravoo, D. N. Reinhoudt and A. van den Berg, Lab Chip, 2005, 5, 163–170 RSC.
- N. Klauke, P. Monaghan, G. Sinclair, M. Padgett and J. Cooper, Lab Chip, 2006, 6, 788–793 RSC.
- A. R. Thete, G. A. Gross, T. Henkel and J. M. Koehler, Chem. Eng. J., 2008, 135, 327–332 CrossRef PubMed.
- A. Funfak, J. Cao, O. S. Wolfbeis, K. Martin and J. M. Köhler, Microchim. Acta, 2009, 164, 279–286 CrossRef CAS.
- L. Florea, C. Fay, E. Lahiff, T. Phelan, N. E. O'Connor, B. Corcoran, D. Diamond and F. Benito Lopez, Lab Chip, 2013, 13, 1079–1085 RSC.
- S. G. d. Pedro, A. Salinas Castillo, M. Ariza Avidad, A. Lapresta Fernández, C. Sánchez González, C. S. Martínez Cisneros, M. Puyol, L. F. Capitan Vallvey and J. Alonso Chamarro, Nanoscale, 2014, 6, 6018–6024 RSC.
- S. Jezierski, D. Belder and S. Nagl, Chem. Commun., 2013, 49, 904–906 RSC.
- C. Herzog, E. Beckert and S. Nagl, Anal. Chem., 2014, 86, 9533–9539 CrossRef CAS PubMed.
- E. Poehler, C. Herzog, M. Suendermann, S. A. Pfeiffer and S. Nagl, Eng. Life Sci., 2015, 15, 276–285 CrossRef CAS PubMed.
- B. Kuswandi, Nuriman, J. Huskens and W. Verboom, Anal. Chim. Acta, 2007, 601, 141–155 CrossRef CAS PubMed.
- T. Sameiro and M. Gonçalves, Chem. Rev., 2009, 109, 190–212 CrossRef PubMed.
- M. Becker, C. Budich, V. Deckert and D. Janasek, Analyst, 2008, 134, 38–40 RSC.
- P. Schulze and D. Belder, Anal. Bioanal. Chem., 2009, 393, 515–525 CrossRef CAS PubMed.
- X. Zhang and J. V. Sweedler, Anal. Chem., 2001, 73, 5620–5624 CrossRef CAS.
- M. E. Johnson and J. P. Landers, Electrophoresis, 2004, 25, 3513–3527 CrossRef CAS PubMed.
- M. Lacroix, V. Poinsot, C. Fournier and F. Couderc, Electrophoresis, 2005, 26, 2608–2621 CrossRef CAS PubMed.
- A. M. García Campaña, M. Taverna and H. Fabre, Electrophoresis, 2007, 28, 208–232 CrossRef PubMed.
- G. K. Belin and S. Seeger, Electrophoresis, 2009, 30, 2565–2571 CrossRef CAS PubMed.
- E. R. Castro and A. Manz, J. Chromatogr., A, 2015, 1382, 66–85 CrossRef CAS PubMed.
- R. Kottler, M. Mank, R. Hennig, B. Müller Werner, B. Stahl, U. Reichl and E. Rapp, Electrophoresis, 2013, 34, 2323–2336 CrossRef CAS PubMed.
- S. Köhler, S. Nagl, S. Fritzsche and D. Belder, Lab Chip, 2012, 12, 458–463 RSC.
- C. Herzog, A. Peretzki, D. Aigner, T. Mayr and S. Nagl, Proc. MicroTAS, 2014, 2155–2157 Search PubMed.
- D. Kohlheyer, J. C. T. Eijkel, A. van den Berg and R. B. M. Schasfoort, Electrophoresis, 2008, 29, 977–993 CrossRef CAS PubMed.
- J. W. Albrecht, J. El Ali and K. F. Jensen, Anal. Chem., 2007, 79, 9364–9371 CrossRef CAS PubMed.
- G. O. Phillips and P. A. Williams, Handbook of hydrocolloids, Woodhead Pub., Cambridge, 2nd edn, 2009 Search PubMed.
- M. Ottens and S. Chilamkurthi, Advances in process chromatography and applications in the food, beverage and nutraceutical industries: Separation, extraction and concentration processes in the food, beverage and nutraceutical industries, Woodhead Pub., Oxford, 2010, vol. 202 Search PubMed.
- Q. A. Acton, Acetates-Advances in Research and Application, Scholarly Editions, Atlanta, 2013 Search PubMed.
- M. Cohn, H. Deutsch and L. R. Wetter, J. Immunol., 1950, 381–395 CAS.
- J. Hou and J. W. Poole, J. Pharm. Sci., 1969, 64, 1510–1515 CrossRef PubMed.
- K. Takács Novák, M. Józan, I. Hermecz and G. Szász, Int. J. Pharm., 1992, 79, 89–96 CrossRef.
- C. Rao, Y. Sun, J. C. Liu and J. Wang, Drug Delivery, 1997, 4, 81–86 CrossRef CAS.
Footnote |
| † Electronic supplementary information (ESI) available. See DOI: 10.1039/c5an01345c |
| This journal is © The Royal Society of Chemistry 2015 |