
 Open Access Article
 This Open Access Article is licensed under a
 Creative Commons Attribution 3.0 Unported Licence
Gold nanoparticle-catalyzed uranine reduction for signal amplification in fluorescent assays for melamine and aflatoxin B1†
Xu
Wang
a,
Jutta
Pauli
b,
Reinhard
Niessner
a,
Ute
Resch-Genger
b and
Dietmar
Knopp
*a
aInstitute of Hydrochemistry, Chair for Analytical Chemistry, Technische Universität München, Marchioninistr. 17, D-81377 München, Germany. E-mail: dietmar.knopp@ch.tum.de; Fax: +49-89-2180-78255; Tel: +49-89-2180-78252
bBAM Bundesanstalt für Materialforschung und -prüfung, Richard-Willstätter-Str. 11, 12489 Berlin, Germany
First published on 3rd September 2015
Abstract
A multifunctional fluorescence platform has been constructed based on gold nanoparticle (AuNP)-catalyzed uranine reduction. The catalytic reduction of uranine was conducted in aqueous solution using AuNPs as nanocatalyst and sodium borohydride as reducing reagent, which was monitored by fluorescence and UV-vis spectroscopy. The reaction rate was highly dependent on the concentration, size and dispersion state of AuNPs. When AuNPs aggregated, their catalytic ability decreased, and thereby a label-free fluorescent assay was developed for the detection of melamine, which can be used for melamine determination in milk. In addition, a fluorescent immunoassay for aflatoxin B1 (AFB1) was established using the catalytic reaction for signal amplification based on target-induced concentration change of AuNPs, where AFB1-BSA-coated magnetic beads and anti-AFB1 antibody-conjugated AuNPs were employed as capture and signal probe, respectively. The detection can be accomplished in 1 h and acceptable recoveries in spiked maize samples were achieved. The developed fluorescence system is simple, sensitive and specific, which could be used for the detection of a wide range of analytes.
Introduction
The development of nanotechnology endows nanoscale materials as excellent candidates for the fabrication of chemical and biological sensors.1–3 Gold nanoparticles (AuNPs) have drawn particular interest due to their distinct physical and chemical properties, such as easy preparation and modification, superior compatibility, excellent optical properties and unique catalytic activity.4 They are frequently modified with different molecules, like fluorescent dyes,5,6 proteins7,8 and DNA9,10 to construct specific nanoprobes, which are utilized for the detection of various analytes.1,11Different amplification strategies are used for AuNPs-based assays to achieve high sensitivity.12 For example, AuNPs act as carrier for the immobilization of biologically active molecules such as enzymes,7,13 enzyme-conjugated antibodies14,15 and DNA reporters,10,16 thereby achieving the enzymatic or DNA-based signal amplification. However, the preparation and detection procedures are usually complicated, which limits the application of this strategy.17,18 In addition, the catalytic properties of AuNPs themselves can be also utilized for signal amplification. For instance, AuNPs can serve as nanocatalysts for the deposition of Ag or Au.19–21 The signal is amplified significantly after metal enlargement. But this technique is mostly used on solid substrates, so strict control of the reaction conditions is required to obtain acceptable reproducibility.19,22 As another example, AuNPs can catalyze the reduction of organic compounds like 4-nitrophenol,23 which has been used for the detection of different proteins.24,25 But this catalytic reduction is only limited to several colored substances, including methyl orange,26 4-nitrophenol27 and methylene blue.18 Thus, the development of additional simple and rapid analytical methods with extraordinary sensitivity is highly desirable.
Compared with other analytical techniques, fluorometry is generally simple, highly specific and sensitive, and therefore, is used for a variety of environmental, industrial, and biotechnology applications.28,29 A number of fluorescence biosensors and optical probes have been developed based on energy transfer between fluorophores (donor) and AuNPs (acceptor), where AuNPs can effectively quench the fluorescence of nearby fluorophores.30–32 But such systems require to be elaborately constructed because the quenching efficiency highly depends on the distance between the donor and acceptor. In addition, several fluorescent assays have been developed by utilizing the catalytic activity of Au–M (M = Hg, Pb, Ag) bimetallic nanoparticles.33–35 The formation of M–Au alloys on the AuNPs surfaces endows the generated bimetallic nanoparticles strong peroxidase-like activity towards the oxidation of Amplex UltraRed (AUR) reagent. In contrast, the activity of unmodified AuNPs towards AUR oxidation is very low. Here, we developed a more straightforward fluorescence system which directly used the intrinsic catalytic activity of AuNPs towards the reduction of uranine. Specifically, in the presence of NaBH4, AuNPs can catalyze the reduction of uranine, producing a significant fluorescence change (Fig. 1). The effects of NaBH4 and AuNPs were studied in detail. The reaction rate highly depends on the concentration, size and dispersion state of AuNPs. The catalytic reaction was then utilized in signal amplification for detection of two harmful chemicals melamine and aflatoxin B1 (AFB1) in food products based on different principles.
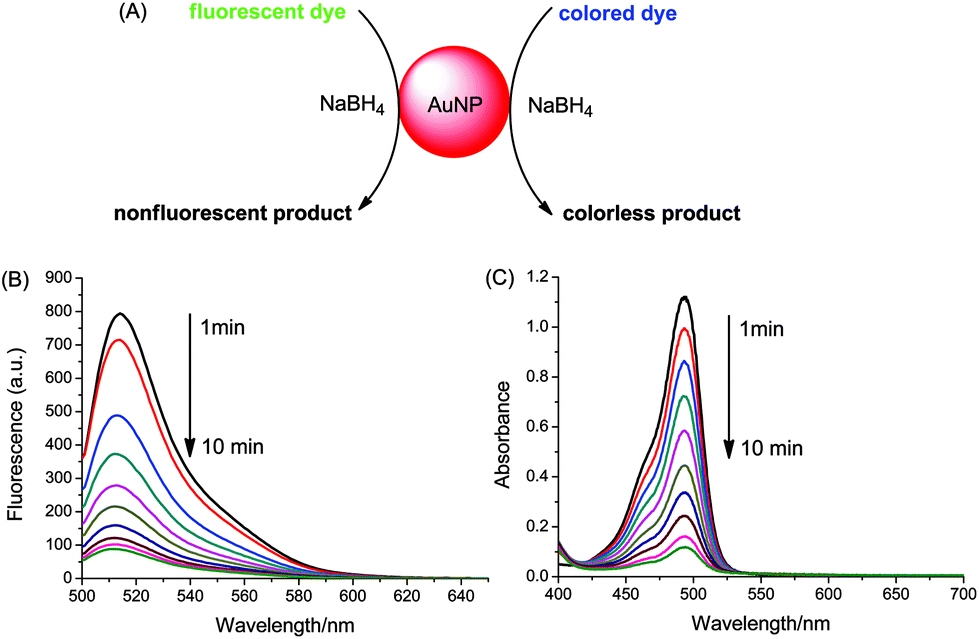 | ||
| Fig. 1 (A) Schematic representation of AuNP-catalyzed reduction of dye by NaBH4. (B) Time-dependent fluorescence spectra of uranine/NaBH4 (8 μM/10 mM) after addition of AuNPs. (C) Time-dependent UV-vis absorption spectra of uranine/NaBH4 (20 μM/10 mM) after addition of AuNPs. | ||
Melamine was selected because it has been illegally used as non-protein nitrogen additive in milk.36 Because of available amino groups, melamine can serve as linker to cause the aggregation of AuNPs.37 In the present investigation it was shown that the catalytic activity towards uranine reduction of aggregated AuNPs decreased gradually, resulting in different fluorescence intensity after catalysis. Thereby a label-free fluorescent assay was established for the detection of melamine. In addition, a magnetic bead-based fluorescent immunoassay was developed using the catalytic uranine reduction for signal amplification. The mycotoxin AFB1 was selected as the model analyte because of its extremely high toxicity and carcinogenicity and its possible presence in natural food samples.38,39 AFB1-BSA-coated magnetic beads (AFB1-BSA-MBs) and anti-AFB antibody-conjugated AuNPs (Ab-AuNPs) were employed as capture and signal probe, respectively. AFB1 samples were incubated with AFB1-BSA-MBs and Ab-AuNPs. After magnetic separation of the formed MBs-AuNPs immune-complexes, the supernatant containing unbound immunogold nanoparticles was utilized for catalysis. The reaction rate was dependent on the amount of immunogold which was proportional to the AFB1 concentration of the sample. To the best of knowledge, this is the first time that the intrinsic catalytic activity of AuNPs was harnessed in fluorescence detection.
Experimental
Materials and instrumentation
Chloroauric acid (HAuCl4), trisodium citrate, sodium borohydride (NaBH4), fluorescein sodium salt (uranine), melamine, ammonia, tryptophan, 4-nitroaniline, ochratoxin A (OTA), T-2 toxin (T-2), fumonisin B1 (FB1), aflatoxin B1 (AFB1), bovine serum albumin (BSA), and AFB1-BSA conjugates were purchased from Sigma Aldrich (Taufkirchen, Germany). 4-Dimethylaminopyridine (DMAP), glycine, disodium hydrogen phosphate (Na2HPO4) and sodium dihydrogen phosphate (NaH2PO4) were purchased from Fluka (Buchs, Switzerland). Ethanolamine and pH buffers were purchased from Carl Roth (Karlsruhe, Germany). Phosphate buffer solution (PBS) was prepared by using 0.2 M NaH2PO4 and 0.2 M Na2HPO4 and then diluted to the corresponding concentration. The mouse monoclonal anti-aflatoxin antibody 1F2 was from our group.40 Ultrapure water was produced using reverse osmosis with UV treatment (Milli-RO 5 Plus, Milli-Q185 Plus, Millipore, Eschborn, Germany). UV-vis absorption spectra were measured on a Specord 250 Plus UV-vis spectrophotometer (Analytik Jena, Jena, Germany). Fluorescence spectra were collected on a RF-5301 PC spectrofluorometer (Shimadzu Europe GmbH, Duisburg, Germany). The excitation wavelength was 493 nm with slit widths of both excitation and emission light kept at 3 nm and sensitivity set to low. The microtiter plate (Ref. 655201, Greiner, Frickenhausen, Germany) was read out with a Synergy HT plate reader (Bio-Tek, Bad Friedrichshall, Germany).Synthesis of AuNPs
AuNPs of different size were prepared according to the Frens method.41 Before proceeding with the reaction, all glassware and the stirrer were cleaned with aqua regia (HNO3–HCl, 1![[thin space (1/6-em)]](https://www.rsc.org/images/entities/char_2009.gif) :3, v/v) and washed thoroughly with deionized water in order to avoid unwanted nucleation and aggregation during synthesis. Briefly, 50 mL of deionized water was heated to boiling while stirred vigorously. Then 120 μL of HAuCl4 solution (0.1 M in water) was added. After 1 min, an aqueous solution of trisodium citrate (1 wt%) was added. A change of color occurred from yellow over black to red. The solution was kept boiling and stirred for further 15 min. Then the colloid solution was cooled to room temperature and stored at 4 °C in the refrigerator. The gold content was about 47.3 mg L−1. The particle size can be tuned by changing the amount of trisodium citrate, which was estimated by dynamic light scattering (DLS) measurements (NANO-flex, Particle Metrix GmbH, Diessen, Germany) (Fig. S1†).
:3, v/v) and washed thoroughly with deionized water in order to avoid unwanted nucleation and aggregation during synthesis. Briefly, 50 mL of deionized water was heated to boiling while stirred vigorously. Then 120 μL of HAuCl4 solution (0.1 M in water) was added. After 1 min, an aqueous solution of trisodium citrate (1 wt%) was added. A change of color occurred from yellow over black to red. The solution was kept boiling and stirred for further 15 min. Then the colloid solution was cooled to room temperature and stored at 4 °C in the refrigerator. The gold content was about 47.3 mg L−1. The particle size can be tuned by changing the amount of trisodium citrate, which was estimated by dynamic light scattering (DLS) measurements (NANO-flex, Particle Metrix GmbH, Diessen, Germany) (Fig. S1†).
Catalytic reduction of uranine
The sodium borohydride solution (100 mM) was always freshly prepared by dissolving 37.8 mg of NaBH4 in 10 mL water and then used immediately. Uranine (200 μM) was prepared newly every day from a stock solution (2 mM in water) by 10-fold dilution with water.For the AuNP-catalyzed reduction of uranine, a mixture containing 2.58 mL of ultrapure water, 120 μL of uranine (200 μM) and 300 μL of NaBH4 (100 mM) was first prepared in a 4 mL PMMA cuvette (Ref. 67.755, Sarstedt, Nümbrecht, Germany). Then 20 μL of citrate-AuNPs was rapidly added to the uranine solution. The fluorescence spectrum was measured at 1 min intervals for 15 min on the RF-5301 PC spectrofluorometer.
To study the influence of nanoparticle size on the catalytic reaction, AuNPs of different size (16, 25, 34 nm) were used. To test the effect of AuNP concentration, 0/10/20/50 μL of 16 nm AuNPs were added. To investigate the effect of NaBH4, solutions were tested with different final concentrations (0, 5, 10, 15 mM). Aggregated AuNPs were prepared by adding 100 μL of 1 M NaCl to 1 mL of 16 nm AuNPs. Then 50/55 μL of dispersed/aggregated AuNPs were tested. For the study of the effect of surfactants, 1.0 mL of 16 nm AuNPs were added to 100 μL of 1 wt% surfactant solution, incubated for 30 min and then 22 μL of surfactant-coated AuNPs were added to the uranine–NaBH4 solution.
For the corresponding absorption measurements, the final concentration of uranine and NaBH4 was 20 μM and 10 mM, respectively, with a total volume of 3 mL, while all the other reaction conditions were kept constant.
Detection of melamine
Initially, 5 mL of 16 nm AuNPs colloid solution was diluted with 20 mL of deionized water to give a final volume of 25 mL. Different amount of melamine (50 μL) was added into 0.5 mL of the above AuNPs suspension. After 15 min, the reaction mixture was 10-fold diluted with water to stop the reaction. 100 μL of the diluted AuNPs was transferred into the well of a microtiter plate, followed by addition of 80 μL of 100 μM uranine and 20 μL of 100 mM NaBH4. The fluorescence intensity (λex/λem = 485/528 nm) was measured every 2 min for 30 min with the microplate reader. All measurements were conducted in triplicate. Error bars represented standard deviations from three assays.Several amino compounds were measured to evaluate the selectivity, including ammonia, ethanolamine, glycine, tryptophan, 4-nitroaniline and DMAP. The concentration of melamine was 0.25 mg L−1 while that of other amino compounds was 5 mg mL−1. The catalytic reaction time was 30 min.
For the detection of melamine in milk samples, 2 mL of milk was pipetted into a 15 mL centrifuge tube, followed by addition of 0, 6, 10, 20, 50, 100 and 200 μL of 1 g L−1 melamine stock solution (in water). The concentrations of melamine in milk were 0, 3, 5, 10, 25, 50 and 100 mg L−1, respectively. Then, 2 mL of water, 1 mL of 10% (w/v) trichloroacetic acid solution and 1 mL of chloroform were added. The mixture was vortexed for 30 s, ultrasonically treated for 15 min and then centrifugated at 4500g for 10 min to separate the deposit. 3 mL of supernatant was transferred into another centrifuge tube and adjusted to pH 7.0 with 2 M of NaOH. The solution was centrifugated at 20800g for 15 min to remove the deposit and stored at 4 °C for future treatment. 100 μL of the milk extract was diluted with 900 μL of acetonitrile. White precipitation was formed immediately, which was removed by centrifugation at 20800g for 20 min. The final solution was used for detection. 100 μL of melamine–CH3CN solution was added into 1 mL of 5-fold diluted 16 nm AuNPs to induce the aggregation. The following procedure was the same as that described for the detection of melamine in water.
Detection of AFB1
Ab-AuNPs and AFB1-BSA-MBs were prepared and characterized according to a published method.42 AFB1 solutions of varying concentration were prepared in 50 mM PBS (pH 7.4). 50 μL of AFB1 standard was transferred to a 0.5 mL tube, followed by the addition of 50 μL of Ab-AuNPs and 15 μL of MBs suspension (∼3 mg mL−1, before use, the MBs were washed three times with water). The mixtures were incubated at room temperature under shaking for 30 min. After magnetic separation of the formed immune-complexes (i.e. anti-AFB1-AuNP-AFB1-BSA-MBs), 50 μL of the supernatant solution containing unbound AuNPs was transferred into the well of a microtiter plate. 50 μL of 100 μM uranine and 50 μL of 100 mM NaBH4 were added successively. The fluorescence intensity (λex/λem = 485/528 nm) was measured every 2 min for 20 min with the microplate reader. All measurements were conducted in triplicate. Error bars were standard deviations from three assays.To evaluate the selectivity of the established method, T-2 toxin, FB1, OTA and their mixtures with AFB1 were tested. The concentration of all other toxins used was 20 ng mL−1, while that of AFB1 was 1 ng mL−1. The catalytic reaction time was 10 min.
To simulate the analysis of a real sample, aflatoxin-free maize extract was used to prepare AFB1 solutions. Briefly, 5 g of pulverized maize samples and 1 g of NaCl were placed in a 50 mL centrifuge tube, followed by the addition of 20 mL of methanol–water (80:20, v/v). The sample was extracted by vortex mixing for 2 min and then centrifugated at 3645g for 15 min. 1 mL of supernatant was diluted with 19 mL of PBS (50 mM, pH 7.4) and later used as diluent solution for the preparation of AFB1 samples. Then the samples were analyzed in a similar way as described above. The only change was that the supernatant containing unbound immunogold nanoparticles was diluted (1:1, v/v) with PBS (25 mM, pH 7.4) before signal amplification. In addition, a certain amount of AFB1 was spiked into pulverized maize powders, then extracted and analyzed in accordance with the above described procedure to determine the recovery rates.
Results and discussion
AuNP-catalyzed uranine reduction
Fig. 1A illustrates the reduction of dye catalyzed by AuNPs with the aid of sodium borohydride. Uranine, a type of xanthene dye, was used as substrate owing to its high fluorescence quantum yield under alkaline conditions (0.92 in 0.1 M NaOH).43 The catalytic process was investigated by fluorescence and UV-vis absorption spectroscopy. As shown in Fig. 1B, after the addition of citrate-coated AuNPs, the fluorescence peak of uranine around 514 nm decreased significantly. The reduction was very fast and finished within 10 min. Similar results were obtained for absorption measurements (Fig. 1C). In contrast, the fluorescence intensity as well as absorbance of uranine kept almost the same in the absence of AuNPs or in the presence of only sodium citrate (Fig. S2†), which indicates that the reduction of uranine could not proceed even with a large excess of reducing reagent. These results demonstrate that AuNPs indeed act as a catalyst. Because the same trend was obtained for fluorescence and absorbance, all results for the latter were summarized in the ESI (Fig. S3, S4 and S6†).The catalytic process could be explained by an electrochemical mechanism,44 where the AuNPs serve as an electron relay system for the oxidant and reductant. As illustrated in Fig. 2A, first BH4− ions and uranine molecules are adsorbed together onto the surface of AuNPs. Then electron transfer takes place between uranine and BH4− through AuNP. After receiving the electrons, the uranine molecules are reduced. During this process, the π–π conjugated structure of xanthene ring is destroyed. So the formed products are colorless and nonfluorescent. Meanwhile, NaBH4 is converted into gaseous products B2H6 and H2, which causes the formation of air bubbles during reaction.
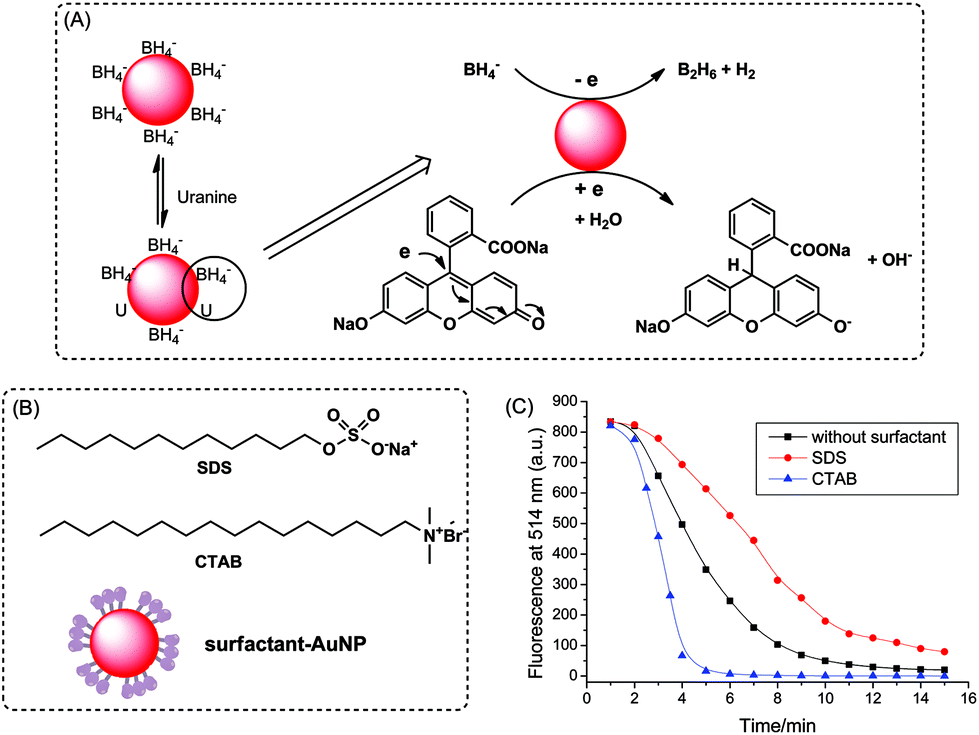 | ||
| Fig. 2 (A) Proposed mechanism of AuNP-catalyzed uranine reduction. (B) The structure of SDS, CTAB and surfactant-AuNP. (C) Time-dependent fluorescence changes of uranine/NaBH4 solution (8 μM/10 mM) at λem = 514 nm after addition of AuNPs with different surface coating. | ||
To verify the adsorption-based catalytic mechanism, the catalytic activity of AuNPs with different surface modifications was measured. Cationic surfactant hexadecyltrimethylammonium bromide (CTAB) and anionic surfactant sodium dodecyl sulfate (SDS) were utilized to coat the AuNPs (Fig. 2B) by hydrophobic interactions, most probably. Although the surfactant molecules may block some of active sites on AuNP surfaces, the modified AuNPs still showed high catalytic ability. As shown in Fig. 2C, compared with unmodified citrate-AuNPs, CTAB-AuNPs showed higher activity, while SDS-AuNPs displayed lower catalytic ability. This is because the substrates, BH4− and uranine, are both negatively charged, which tend to adsorb onto cationic CTAB-modified surface much better due to electrostatic attraction. Compared with CTAB coating, anionic SDS-modified surface inhibits the adsorption of reactants. Experimental data are in strong support of the proposed catalytic mechanism.
The role of NaBH4
The influence of NaBH4 on the catalytic reaction was investigated. As shown in Fig. 3A, in the absence of NaBH4, the fluorescence intensity of uranine kept constant after addition of AuNPs, which indicates the reaction did not proceed. With the increase of NaBH4 concentration from 5 mM to 15 mM, the reaction rate was enhanced correspondingly. Interestingly, the initial fluorescence of uranine in water was much lower than that in NaBH4 solution. We further measured the corresponding fluorescence spectra without the addition of AuNPs. As seen in Fig. 3B, NaBH4 changed the fluorescence emission of uranine. This can be ascribed to partial hydrolyzation of NaBH4, which shifted the pH from 6.5 in water to 10.4:| 2NaBH4 + 2H2O → B2H6 + 2H2 + 2NaOH |
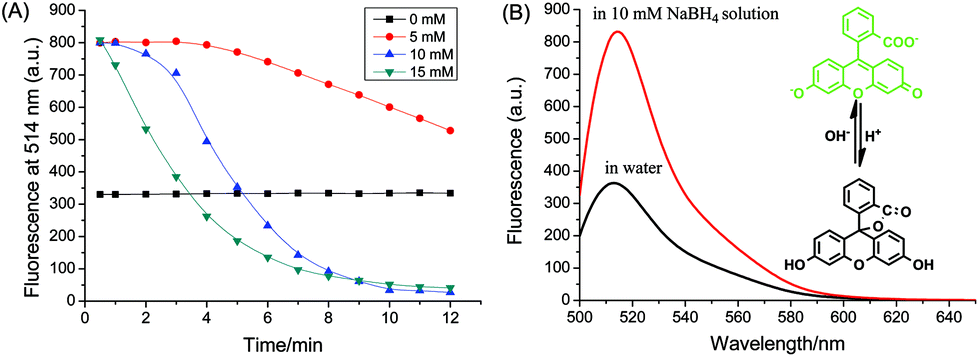 | ||
| Fig. 3 (A) Effect of NaBH4 concentration on the catalytic reaction (8 μM uranine in 3 mL water, NaBH4 with different concentrations and then 20 μL of 16 nm citrate-stabilized AuNPs was added). (B) Fluorescence spectra of uranine (8 μM) in water and NaBH4 solution. Inset: chemical structure conversion of uranine under different pH conditions. | ||
Uranine is very sensitive to pH change (Fig. S5†). With the increase of pH value, non-fluorescent fluorescein spirolactone in water converts to the dianion form which displays strong green fluorescence (inset of Fig. 3B).45 Thus, stronger fluorescence was observed in alkaline NaBH4 solution. Furthermore, due to the large excess of NaBH4, the solution pH was kept constant during the reaction process. In short, NaBH4 not only serves as reducing reagent, but also controls the solution pH.
The effect of AuNPs
The influence of AuNPs on the catalytic reaction was studied in detail. Fig. 4A shows the kinetics behavior of uranine reduction using different amounts of AuNPs. It can be clearly seen that the reaction rate was highly dependent on the initial concentration of nanocatalyst, which was speeded up at high concentration of AuNPs.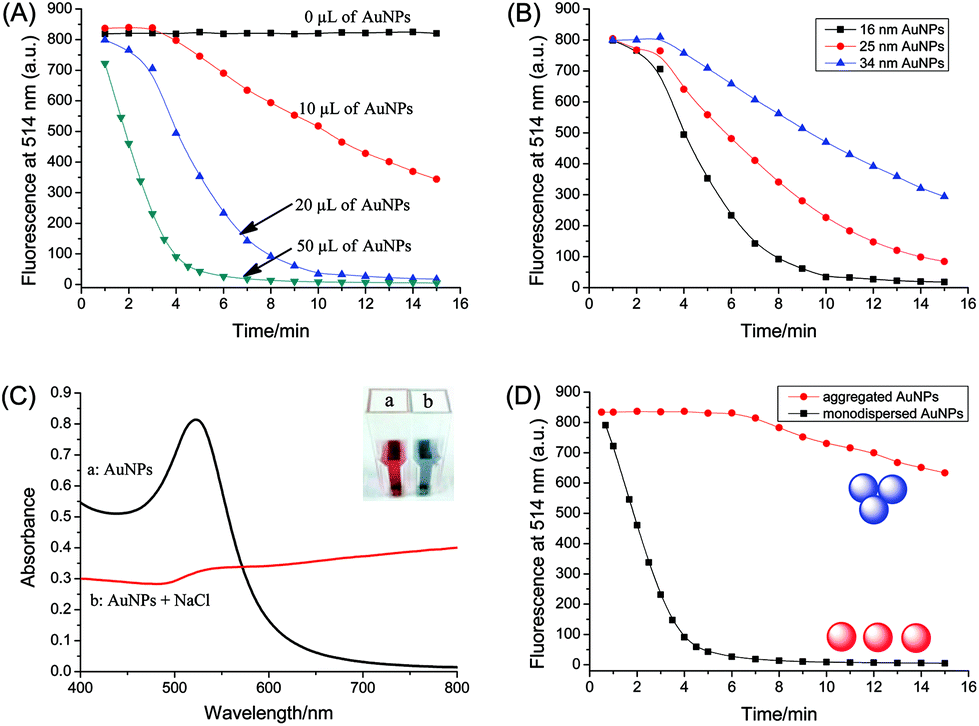 | ||
| Fig. 4 (A) Effect of AuNP concentration on the uranine fluorescence (16 nm AuNPs were used). (B) Influence of AuNP size on the uranine fluorescence. [Au] = 0.31 mg L−1. (C) UV-vis absorption spectra of dispersed and aggregated AuNPs and corresponding picture. (D) Comparison of the catalytic activity of dispersed and aggregated AuNPs. Conditions: 8 μM uranine and 10 mM NaBH4 in 3 mL water, and addition of AuNPs in different volumes, sizes and aggregation states. | ||
As the properties of inorganic nanoparticles are often dependent on size, we studied the catalytic activity of AuNPs with different size (16, 25 and 34 nm). As indicated in Fig. 4B, the AuNPs showed different levels of activity towards uranine reduction. The smaller the size, the higher is the catalytic activity. This may be because smaller AuNPs have a larger surface-to-volume ratio, which can interact more efficiently with substrates.
The dispersion state of AuNPs may also affect their catalytic activity. Hence, a comparison between aggregated and dispersed AuNPs was made. Aggregated AuNPs were obtained by adding high concentration of NaCl to AuNPs solution (100 μL of 1 M NaCl to 1 mL of AuNPs). As seen in Fig. 4C, after the addition of NaCl, the color changed from red to blue, and a broad absorption band appeared and shifted to longer wavelength, which indicates that the AuNPs did aggregate.46 Compared with dispersed AuNPs, the catalytic activity of aggregated AuNPs was much lower as shown in Fig. 4D. This may be because the total surface area decreased greatly when AuNPs aggregated, and a large number of active sites on gold surface were blocked sterically.
Aggregation-based catalytic amplification for the detection of melamine
The catalytic reaction was then utilized in fluorescence detection. An aggregation-based label-free fluorescent assay was developed for the detection of melamine, as illustrated in Fig. 5. Because of the strong interaction between electron-rich nitrogen atoms and the electron-deficient surface of AuNPs, melamine containing multiple binding sites can cause the aggregation of AuNPs (Fig. S7†). The aggregated AuNPs were utilized to catalyze the reduction of uranine by NaBH4 to induce a fluorescence change. With the increase of melamine concentration, AuNPs aggregated to a higher extent. Obviously, the fluorescence intensity is proportional to the melamine concentration.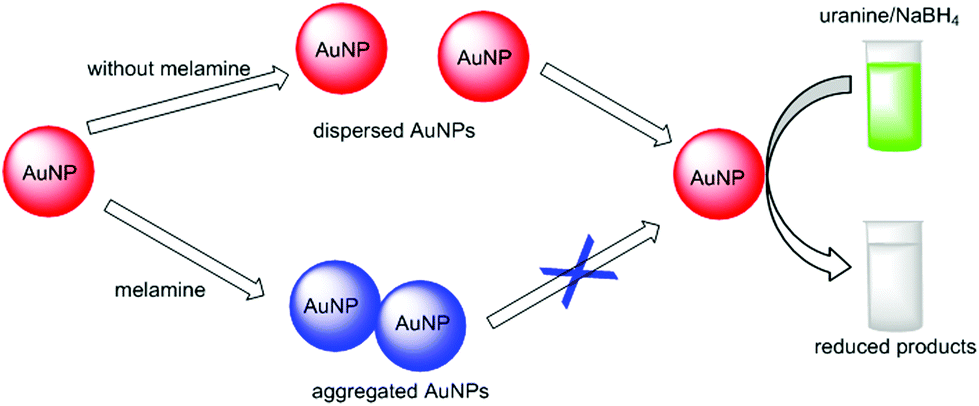 | ||
| Fig. 5 Schematic illustration of the proposed fluorescent detection of melamine based on AuNPs catalysis. | ||
The time-dependent reduction of uranine catalyzed by aggregated AuNPs, which was induced by melamine, was monitored in microplate with a plate reader. Because of continual reduction of uranine molecules, the fluorescence decreased gradually with the increase of reaction time (Fig. 6A). When the reaction time was fixed, with increasing melamine concentration, the fluorescence intensity also displayed a tendency to increase, indicating the signal was melamine concentration-dependent. Fig. 6B plotted the fluorescence intensity at 30 min as a function of melamine concentration. A good sigmoidal fitting (R2 = 0.99, n = 21) was obtained between the fluorescence (Fl.) and melamine concentration ranging from 0.4 to 2 μM:
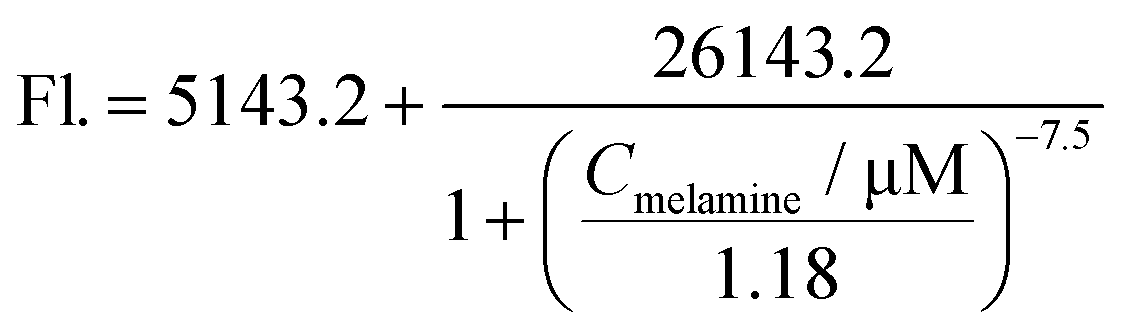
 | ||
| Fig. 6 Kinetic-based fluorescent assay for melamine using AuNP-catalyzed uranine reduction (λex/λem = 485/528 nm). (A) Time-dependent fluorescence changes corresponding to different concentrations of melamine. (B) Dependence of fluorescence intensity on melamine concentration. (C) Response of the proposed method to different amino compounds. (1) Blank, (2) ammonia, (3) ethanolamine, (4) glycine, (5) tryptophane, (6) 4-nitroaniline, (7) DMAP and (8) melamine. The concentration of melamine was 0.25 mg mL−1 (2 μM) while that of the other amino compounds was 5 mg mL−1. | ||
The reproducibility of the assay was evaluated by testing AuNPs from different batches. The variation coefficients (n = 3) were 15.7% without melamine and 5.1% for a melamine concentration of 2 μM, respectively. The limit of detection (LOD) defined at 10% of the maximum response was estimated to be 0.88 μM (0.11 mg L−1; ppm). Without any further optimization, the obtained LOD is lower than that of colorimetric assays based on aggregation of unmodified AuNPs (from 0.15 to 2.5 ppm),36 demonstrating the high sensitivity using catalytic amplification.
To better understand the signaling mechanism, several amino compounds, including ammonia, ethanolamine, glycine, tryptophane, 4-nitroaniline and 4-dimethylaminopyridine (DMAP) were tested. As shown in Fig. 6C, the uranine fluorescence was very strong in the presence of melamine, while other amino compounds had only little effects, except DMAP. This is ascribed to the two electron-rich nitrogen atoms of DMAP, which can serve as linker for neighboring AuNPs, thereby inducing AuNP aggregation (Fig. S8†). In contrast, 4-nitroaniline which also contains two nitrogen atoms cannot initiate the aggregation of AuNPs since the nitro group is electron-withdrawing.
In order to validate the practicability of the developed method, milk samples spiked with different concentration of melamine were analyzed. As is known, milk is a complex matrix containing proteins, sugars, lipids and salts, which may interfere with the detection. Thus, it is critical to extract melamine while removing interferents from milk. Trichloroacetic acid and acetonitrile were used to precipitate proteins. In addition, lipids and other organic substances were removed by chloroform.47 After sample cleanup, the extracts were detected according to the procedure described in the Experimental section. As shown in Fig. S9,† the catalytic reaction proceeded slower at higher concentrations of melamine in milk. The fluorescence at 30 min was linear to logarithmic concentration of melamine from 3 to 100 mg L−1 (Fl. = 12038.2 + 10069.4 × logC[melamine], n = 18) with a correlation coefficient of 0.99, demonstrating the proposed approach could be utilized for the detection of melamine in milk.
Combining the high-affinity binding between AuNPs and melamine with signal amplification procedure based on AuNP-catalyzed uranine reduction, the developed assay is simple and sensitive. The aggregation event is converted into fluorescence signal, which could be expanded to other aggregation-based assays using AuNPs.
Concentration-based catalytic amplification for the detection of AFB1
Further, we demonstrated that the catalytic reaction could be utilized for signal amplification in immunoassay. Fig. 7 shows the principle of the method. Specifically, AFB1-BSA-MBs competed with target AFB1 for binding with the AuNP-labeled antibodies. The amount of Ab-AuNPs bound onto MBs decreased with increasing AFB1 concentration because of competitive inhibition. After magnetic separation of the formed particle assemblies (i.e. anti-AFB1-AuNP-AFB1-BSA-MBs), the supernatant containing unbound AuNPs was utilized to promote the reduction of uranine, thereby producing a fluorescence change. The final fluorescence intensity, which depends on the concentration of Ab-AuNPs in the supernatant, is inversely proportional to the concentration of AFB1 in the sample.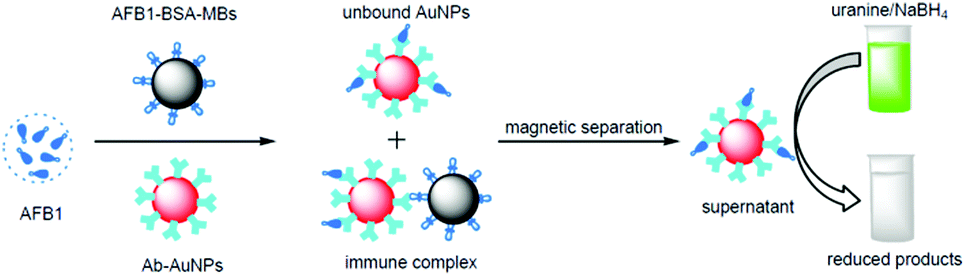 | ||
| Fig. 7 Schematic illustration of the fluorescent detection of AFB1 using AuNP-catalyzed uranine reduction. | ||
It should be noted that the AuNPs become very stable after being coated with proteins, which is ascribed to steric repulsion between proteins on different AuNPs. As shown in Fig. S10,† the absorbance of Ab-AuNPs kept almost unchanged after addition of melamine, indicating even melamine was not able to induce the aggregation of immunogold nanoparticles. Ruling out the possible interference from melamine, we tested AFB1 samples in PBS following the procedure described in the Experimental section. Fig. 8A shows the time-dependent fluorescence change of uranine catalyzed by unbound immunogold nanoparticles in the supernatant. The fluorescence decreased with increasing reaction time, which demonstrates the AuNPs kept their catalytic activity even coated by proteins. The catalytic reaction proceeded faster at higher concentration of AFB1, which reached a plateau after about 10 min. A good linear relationship was obtained between the fluorescence (Fl.) at 10 min and logarithmic concentration of AFB1 from 0.02 to 1 ng mL−1 (Fig. 8B). The regression equation could be fitted to Fl. = 2459.2 − 7294.1 × logC[AFB1] (ng mL−1, R2 = 0.99, n = 18). The variation coefficients (n = 3), obtained for AuNPs originating from different batches, were 18.1% without AFB1 and 14.6% for an AFB1 concentration of 1 ng mL−1, respectively. The LOD defined at 10% of maximum response inhibition was 17.1 pg mL−1, which was obviously lower than that of magnetic bead-based immunoassay using fluorescent nanoparticles (0.1 ng mL−1).48 Furthermore, the half maximal inhibitory concentration (IC50) was 104 pg mL−1, which was much lower than that of a similar method using gold staining for signal amplification (465 pg mL−1),22 indicating the high sensitivity of the developed fluorescent immunoassay.
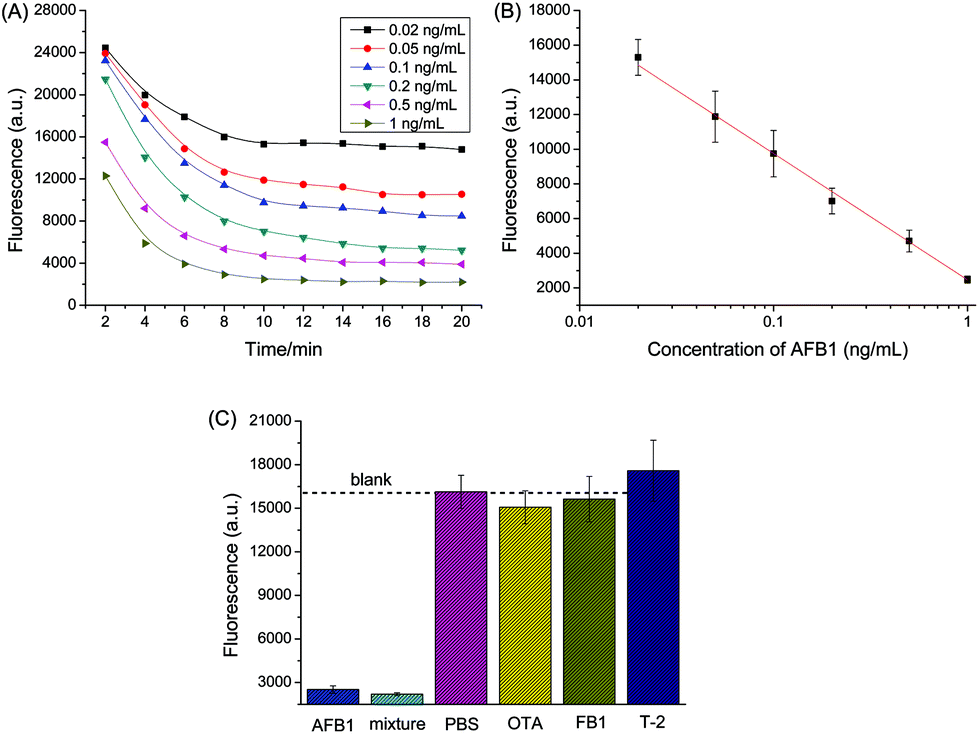 | ||
| Fig. 8 Kinetic-based fluorescent assay for AFB1 based on AuNPs catalysis (λex/λem = 485/528 nm). (A) Time-dependent fluorescence change, which corresponds to different concentrations of AFB1. (B) Relationship between fluorescence intensity and AFB1 concentration. (C) Specificity of the proposed method towards AFB1. The concentration of AFB1 was 1 ng mL−1 while that of other toxins was 20 ng mL−1. | ||
To evaluate the specificity of the established immunoassay, control experiments were conducted by selecting ochratoxin A (OTA), T-2 toxin, and fumonisin B1 (FB1) as the interfering mycotoxins. As seen in Fig. 8C, a significant decrease in fluorescence was only observed in the presence of target AFB1, while the presence of other toxins caused very small fluorescence change. Thus, the selectivity of the proposed method was acceptable.
To further evaluate the feasibility of applying the fluorescent immunoassay in complex matrices, AFB1 standards prepared in aflatoxin-free maize extract were analyzed. As seen in Fig. S11,† the signal response decreased obviously in maize extract compared with that in PBS under the same conditions, which was the result of matrix effect. The complicated food matrix could block binding sites of antibodies, resulting in a higher concentration of immunogold nanoparticles in the supernatant after magnetic separation. So we diluted the supernatant with PBS (1:1, v/v) and then used the diluted solution for signal amplification. As indicated in Fig. S12,† larger signal change was achieved. A linear dependence existed between fluorescence at 20 min and AFB1 level in the dynamic range from 0.05 to 1 ng mL−1 (Fl. = 2350.9 − 10524.1 × logC[AFB1], R2 = 0.98, n = 15). Then maize powders artificially spiked with AFB1 were analyzed and AFB1 levels were determined from the calibration curve. As listed in Table S1,† acceptable recovery rates were obtained in the range of 84.7% to 119.4%, demonstrating that the established method could be applied for AFB1 determination in real agriculture products.
The developed fluorescent immunoassay is simple, fast and highly sensitive, which could be expanded to the detection of other toxins because of the attractive features: (1) AuNPs can be easily functionalized with affinity ligands such as antibody or aptamer; (2) making full use of the catalytic activity of AuNPs as well as the high fluorescence quantum yield of uranine, the AuNP-catalyzed fluorescent assay strategy exhibits high sensitivity; (3) the usage of MBs reduces the incubation time and the formed AuNPs-MBs immune-complexes can be easily removed owing to efficient magnetic separation.
Conclusions
AuNPs can catalyze the reduction of uranine in the presence of NaBH4, which was monitored by fluorescence and UV-vis absorption spectroscopy. AuNPs may act as an electron relay system where electron transfer takes place between uranine and BH4− through the AuNP. NaBH4 not only serves as reducing reagent, but also controls the solution pH. Kinetic studies demonstrated that the concentration, size and dispersion state of AuNPs greatly affect the reaction rate. Further, multifunctional detection using this catalyzed fluorescence assay was achieved. In detail, a label-free fluorescent assay for melamine and a magnetic bead-based fluorescent immunoassay for AFB1 were established using the catalytic reaction for signal amplification. Satisfactory results were obtained for the detection of melamine in milk and AFB1 in maize. The proposed methods are rapid, sensitive and cost-effective, which offer great promise for the detection of other analytes.Acknowledgements
Financial support by the China Scholarship Council is gratefully acknowledged. We also thank Clemens Helmbrecht from Particle Metrix GmbH, Diessen, Germany, for providing the DLS instrument.Notes and references
- K. Saha, S. S. Agasti, C. Kim, X. Li and V. M. Rotello, Chem. Rev., 2012, 112, 2739–2779 CrossRef CAS PubMed
.
- D. Knopp, D. Tang and R. Niessner, Anal. Chim. Acta, 2009, 647, 14–30 CrossRef CAS PubMed
- K. E. Sapsford, W. R. Algar, L. Berti, K. B. Gemmill, B. J. Casey, E. Oh, M. H. Stewart and I. L. Medintz, Chem. Rev., 2013, 113, 1904–2074 CrossRef CAS PubMed
- H. Jans and Q. Huo, Chem. Soc. Rev., 2012, 41, 2849–2866 RSC
- D. Liu, S. Wang, M. Swierczewska, X. Huang, A. A. Bhirde, J. Sun, Z. Wang, M. Yang, X. Jiang and X. Chen, ACS Nano, 2012, 6, 10999–11008 CAS
- D. Liu, X. Huang, Z. Wang, A. Jin, X. Sun, L. Zhu, F. Wang, Y. Ma, G. Niu and A. R. Hight Walker, ACS Nano, 2013, 7, 5568–5576 CrossRef CAS PubMed
- D. Tang, B. Liu, R. Niessner, P. Li and D. Knopp, Anal. Chem., 2013, 85, 10589–10596 CrossRef CAS PubMed
- M. A. Nash, J. N. Waitumbi, A. S. Hoffman, P. Yager and P. S. Stayton, ACS Nano, 2012, 6, 6776–6785 CrossRef CAS PubMed
- P. Valentini, R. Fiammengo, S. Sabella, M. Gariboldi, G. Maiorano, R. Cingolani and P. P. Pompa, ACS Nano, 2013, 7, 5530–5538 CrossRef CAS PubMed
- D. Kato and M. Oishi, ACS Nano, 2014, 8, 9988–9997 CrossRef CAS PubMed
- L. Dykman and N. Khlebtsov, Chem. Soc. Rev., 2012, 41, 2256–2282 RSC
- X. Cao, Y. Ye and S. Liu, Anal. Biochem., 2011, 417, 1–16 CrossRef CAS PubMed
- Z. Gao, M. Xu, L. Hou, G. Chen and D. Tang, Anal. Chem., 2013, 85, 6945–6952 CrossRef CAS PubMed
- A. Ambrosi, M. T. Castañeda, A. J. Killard, M. R. Smyth, S. Alegret and A. Merkoçi, Anal. Chem., 2007, 79, 5232–5240 CrossRef CAS PubMed
- Y. Li, Y. Zhou, X. Meng, Y. Zhang, J. Liu, Y. Zhang, N. Wang, P. Hu, S. Lu and H. Ren, Biosens. Bioelectron., 2014, 61, 241–244 CrossRef CAS PubMed
- J.-M. Nam, K.-J. Jang and J. T. Groves, Nat. Protocols, 2007, 2, 1438–1444 CAS
- H. Wei and E. Wang, Anal. Chem., 2008, 80, 2250–2254 CrossRef CAS PubMed
- W. Li, W. Qiang, J. Li, H. Li, Y. Dong, Y. Zhao and D. Xu, Biosens. Bioelectron., 2014, 51, 219–224 CrossRef CAS PubMed
- R. Liu, Y. Zhang, S. Zhang, W. Qiu and Y. Gao, Appl. Spectrosc. Rev., 2014, 49, 121–138 CrossRef CAS PubMed
- D. Kim, W. L. Daniel and C. A. Mirkin, Anal. Chem., 2009, 81, 9183–9187 CrossRef CAS PubMed
- V. Pavlov, Y. Xiao, B. Shlyahovsky and I. Willner, J. Am. Chem. Soc., 2004, 126, 11768–11769 CrossRef CAS PubMed
- X. Wang, R. Niessner and D. Knopp, Analyst, 2015, 140, 1453–1458 RSC
- J. Das, M. A. Aziz and H. Yang, J. Am. Chem. Soc., 2006, 128, 16022–16023 CrossRef CAS PubMed
- J. Tang, D. Tang, B. Su, J. Huang, B. Qiu and G. Chen, Biosens. Bioelectron., 2011, 26, 3219–3226 CrossRef CAS PubMed
- C.-C. Chang, C.-P. Chen, C.-H. Lee, C.-Y. Chen and C.-W. Lin, Chem. Commun., 2014, 50, 14443–14446 RSC
- W. Li, J. Li, W. Qiang, J. Xu and D. Xu, Analyst, 2013, 138, 760–766 RSC
- X. Que, D. Tang, B. Xia, M. Lu and D. Tang, Anal. Chim. Acta, 2014, 830, 42–48 CrossRef CAS PubMed
- A. Shahzad, G. Köhler, M. Knapp, E. Gaubitzer, M. Puchinger and M. Edetsberger, J. Transl. Med., 2009, 7, 99–104 CrossRef PubMed
-
E. M. Goldys, Fluorescence applications in biotechnology and life sciences, John Wiley & Sons, 2009 Search PubMed
- G. Chen, F. Song, X. Xiong and X. Peng, Ind. Eng. Chem. Res., 2013, 52, 11228–11245 CrossRef CAS
- M. Ujihara, N. M. Dang and T. Imae, J. Nanosci. Nanotechnol., 2014, 14, 4906–4910 CrossRef CAS PubMed
- J. Chen, Y. Huang, S. Zhao, X. Lu and J. Tian, Analyst, 2012, 137, 5885–5890 RSC
- C.-I. Wang, C.-C. Huang, Y.-W. Lin, W.-T. Chen and H.-T. Chang, Anal. Chim. Acta, 2012, 745, 124–130 CrossRef CAS PubMed
- C.-I. Wang, W.-T. Chen and H.-T. Chang, Anal. Chem., 2012, 84, 9706–9712 CrossRef CAS PubMed
- Y.-S. Wu, F.-F. Huang and Y.-W. Lin, ACS Appl. Mater. Interfaces, 2013, 5, 1503–1509 CAS
- Y. Li, J. Xu and C. Sun, RSC Adv., 2015, 5, 1125–1147 RSC
- H. Chi, B. Liu, G. Guan, Z. Zhang and M.-Y. Han, Analyst, 2010, 135, 1070–1075 RSC
-
P. Li, Q. Zhang, D. Zhang, D. Guan, D. X. Liu, S. Fang, X. Wang and W. Zhang, in Aflatoxins - Detection, Measurement and Control, InTech, 2011, pp. 183–208 Search PubMed
- A. P. Wacoo, D. Wendiro, P. C. Vuzi and J. F. Hawumba, J. Appl. Chem., 2014, 2014, 1–15 CrossRef PubMed
- C. Cervino, E. Weber, D. Knopp and R. Niessner, J. Immunol. Methods, 2008, 329, 184–193 CrossRef CAS PubMed
- G. Frens, Nat. Phys. Sci., 1972, 241, 20–22 CrossRef PubMed
- X. Wang, R. Niessner and D. Knopp, Sensors, 2014, 14, 21535–21548 CrossRef CAS PubMed
- G. Weber and F. Teale, Trans. Faraday Soc., 1958, 54, 640–648 RSC
- Z.-J. Jiang, C.-Y. Liu and L.-W. Sun, J. Phys. Chem. B, 2005, 109, 1730–1735 CrossRef CAS PubMed
- M. M. Martin and L. Lindqvist, J. Lumin., 1975, 10, 381–390 CrossRef CAS
- D. Vilela, M. C. González and A. Escarpa, Anal. Chim. Acta, 2012, 751, 24–43 CrossRef CAS PubMed
- L. Guo, J. Zhong, J. Wu, F. Fu, G. Chen, X. Zheng and S. Lin, Talanta, 2010, 82, 1654–1658 CrossRef CAS PubMed
- D. Tang, Y. Yu, R. Niessner, M. Miró and D. Knopp, Analyst, 2010, 135, 2661–2667 RSC
Footnote |
| † Electronic supplementary information (ESI) available. See DOI: 10.1039/c5an01300c |
| This journal is © The Royal Society of Chemistry 2015 |