
 Open Access Article
 This Open Access Article is licensed under a
 Creative Commons Attribution 3.0 Unported Licence
Studying the distribution of deep Raman spectroscopy signals using liquid tissue phantoms with varying optical properties
Martha Z.
Vardaki
a,
Benjamin
Gardner
a,
Nicholas
Stone†
*a and
Pavel
Matousek†
*b
aSchool of Physics, University of Exeter, Exeter EX4 4QL, UK. E-mail: N.Stone@exeter.ac.uk
bCentral Laser Facility, Research Complex at Harwell, STFC Rutherford Appleton Laboratory, Harwell, Oxford, OX11 0QX, UK. E-mail: Pavel.Matousek@stfc.ac.uk
First published on 9th June 2015
Abstract
In this study we employed large volume liquid tissue phantoms, consisting of a scattering agent (Intralipid), an absorption agent (Indian ink) and a synthesized calcification powder (calcium hydroxyapatite (HAP)) similar to that found in cancerous tissues (e.g. breast and prostate), to simulate human tissues. We studied experimentally the magnitude and origin of Raman signals in a transmission Raman geometry as a function of optical properties of the medium and the location of calcifications within the phantom. The goal was to inform the development of future noninvasive cancer screening applications in vivo. The results provide insight into light propagation and Raman scattering distribution in deep Raman measurements, exploring also the effect of the variation of relative absorbance of laser and Raman photons within the phantoms. Most notably when modeling breast and prostate tissues it follows that maximum signals is obtained from the front and back faces of the tissue with the central region contributing less to the measured spectrum.
Introduction
Deep Raman spectroscopy consists of a group of emerging spectroscopic techniques being developed for biomedical, pharmaceutical and security applications based around Spatially Offset Raman Spectroscopy (SORS and Transmission Raman Spectroscopy (TRS)).1,2 In contrast to conventional Raman spectroscopy, deep Raman has been shown to be able to acquire specific molecular signals from calcifications from depths up to 2.7 cm,3 or 5 cm with the use of labelled nanoparticles (SESORS).4 The feasibility of non-labelled deep Raman approaches has been already demonstrated for potential application to breast cancer3 and bone disease5,6 diagnostics. A further demonstration of the potential for clinical SORS has been shown in a feasibility study to assess the surgical margins in excised breast tumour samples.7 Transmission mode has also been used for signal recovery in various studies, with examples of Raman and diffuse optical tomography on bone8 and breast9 tissue phantoms.However, in the studies above, the measured Raman scattering has only been explored in terms of signal intensity versus tissue thickness. A major unexplored aspect of deep Raman is the spatial distribution of the Raman scattering throughout a sample volume and its dependence on optical properties of the sample.
Related research has been conducted on pharmaceutical tablets, studying the spatial origin of measured Raman signals changes when both in spatial and time-resolved transmission Raman measurements5,10 and in respective Monte Carlo simulations.11 However, because of the great difference between biological tissue and pharmaceutical formulations (e.g. presence of absorption in tissue, different spatial scales), the medical applications warrant a specific and tissue-oriented study.
In the field of Raman fiberoptic probes, a needle fibre optic probe has been developed and tested for subcutaneous Raman measurements by being inserted beneath the surface of various ex vivo biological tissues to acquire a Raman signal.12 Even though Raman needle probes can enable significant depth probing, they are invasive and generally only sample a volume restricted to a zone local to the probe tip.
For the first time, our measurements explore experimentally the signal distributions in tissue phantoms representing prostate and breast tissue. To ensure that our measurements are comparable to real conditions, we produced liquid tissue phantoms with optical properties comparable to these types of tissue.
Prostate cancer is nowadays the third most common male cancer in UK with more than 30![[thin space (1/6-em)]](https://www.rsc.org/images/entities/char_2009.gif) 000 new cases every year. Some of the most common tests taken to detect prostate cancer (PSA, digital rectal exam, ultrasound) are not always reliable since they can only detect the gross morphological changes on the gland and often fail to determine if these changes are due to a cancerous condition.13–15 As a result, more invasive methods such as prostate biopsy and histopathology are being applied for the definite diagnosis and classification of the disease. However, if the tumor is small, it can be missed by biopsy since only a very small percentage of the entire gland is sampled.16
000 new cases every year. Some of the most common tests taken to detect prostate cancer (PSA, digital rectal exam, ultrasound) are not always reliable since they can only detect the gross morphological changes on the gland and often fail to determine if these changes are due to a cancerous condition.13–15 As a result, more invasive methods such as prostate biopsy and histopathology are being applied for the definite diagnosis and classification of the disease. However, if the tumor is small, it can be missed by biopsy since only a very small percentage of the entire gland is sampled.16
Breast cancer is also one of the most common cancer types with over 50000 women diagnosed every year in UK. With mammography being vastly affected by breast tissue density17,18 and ultrasound exhibiting a low sensitivity,19 current diagnostic means seem to be insufficient for an adequate early diagnosis. The gold standard for breast cancer is currently biopsy followed by histopathology. However, even in that case not all of the tissue can be sampled in order to be assessed as cancerous or benign.20
Conventional Raman spectroscopy has already established the feasibility of detecting prostate and breast cancer ex vivo. Studies have shown the possibility of distinguishing between normal prostate, benign prostatic hyperplasia and different grades of prostatic carcinoma.21,22 In the case of breast cancer, a number of studies have also managed to discriminate between healthy, benign and malignant breast tissue using Raman spectroscopy under the microscope.23
Deep Raman techniques have also shown potential in distinguishing between benign and malignant breast tissue, on the grounds of the detection of different types of calcifications which appear in different pathological types of breast tissue.3,24 Therefore, it is clear that methods able to probe Raman signals from the tissue volume of interest such as spatially offset Raman spectroscopy (SORS) or transmission Raman spectroscopy, have the potential to provide a minimally invasive solution for in vivo diagnosis of the disease.
This study has explored the feasibility of acquiring Raman signals from each point across a two-dimensional grid in the tissue phantom. The objectives have been to enable both an understanding of the relative signals measured from lesions buried at different depths in tissues and to help the future design of optical sampling methods to maximise the excitation and collection of these signals. In order to explore how the photon migration of the Raman signals change when the optical properties of the surrounding tissue change, we produced a selection of liquid tissue phantoms within a 30 mm × 45 mm × 45 mm quartz cell. In this way we simulated the potential in vivo measurement conditions for human prostate (transurethrally and transrectally) and breast samples and assessed the feasibility of such measurements.
Results and discussion
Intralipid maps
Raman scattering maps were recorded for tissue phantoms with different Intralipid (IL) concentrations and therefore different scattering coefficients (Fig. 1). Parameters such as power, laser wavelength, beam size and acquisition time were kept constant during the mapping.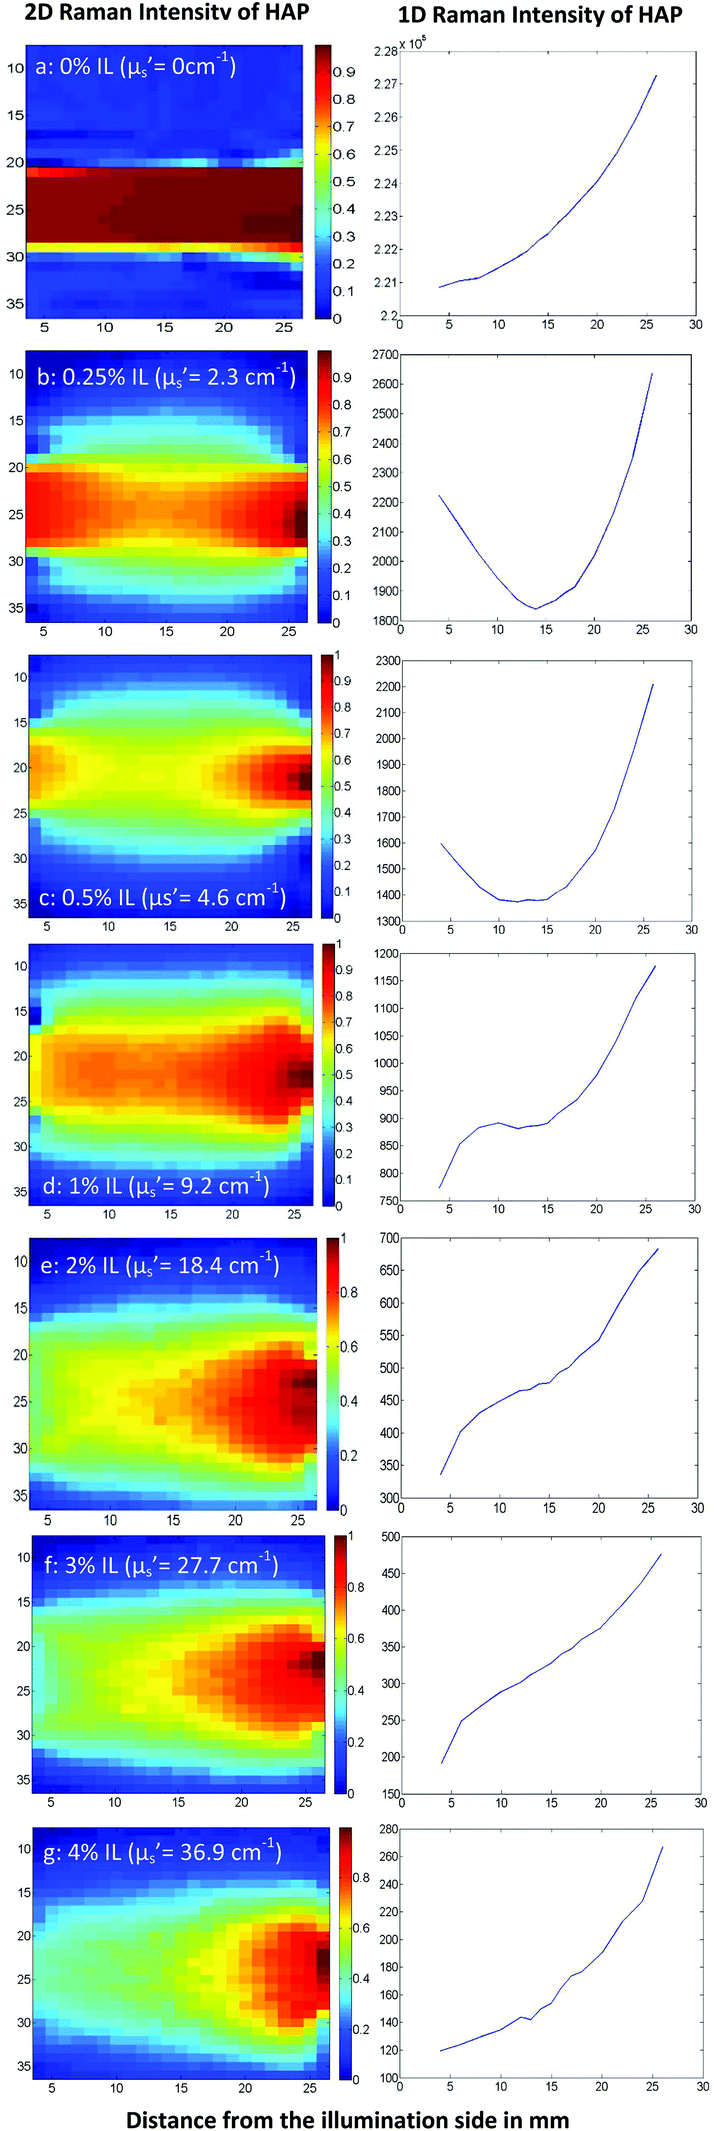 | ||
| Fig. 1 The origin of Raman signal in different Intralipid concentration tissue phantoms when no absorber is present. Laser photons are injected on the left of the image and Raman signal is collected on the right. A cuvette of the calcium hydroxyapatite (HAP), 12 mm width × 4 mm (2 mm optical path length), has been moved in steps of 1 and 2 mm across a two-dimensional grid. The 12 mm cuvette width is aligned with y-axis in the images and the 4 mm path aligned with the optical axis of the model system (x-axis in the figure). The HAP cuvette was kept immersed in the phantom at all times. The plots depict the intensity of ∼960 cm−1 phosphate Raman band of HAP. The right-hand plots represent longitudinal plots of generated Raman signal along the optical axis (‘on axis’ Raman intensity). | ||
In the plain water mapping (Fig. 1a) no diffuse scattering is present and the measured signal is limited to the boundaries of the laser beam. Once we introduce Intralipid into the system (Fig. 1b), laser photons are able to reach and interact with HAP in more distant off axis positions as they elastically scatter between suspended lipid droplets. Therefore, Raman signal can be detected outside of the boundaries of the illuminating beam with limits that depend on the scatterer (Intralipid) concentration in the tissue phantom.
As the numbers of Intralipid molecules in the phantom increase (moving from Fig. 1a–g), the scattering distribution pattern changes. In phantoms with low scattering coefficients (Fig. 1b) we observe a form of symmetry in the Raman signal between the illumination (left) and the collection (right) side. It should be considered here that the highest number of Raman photons are expected to be generated on the illumination side because this is where most of the laser photons are present in the cell, with the greatest probability of inducing Raman events. However, these photons need to propagate across the entire width of the cell through the turbid medium to the right side in order to be detected; undergoing loss due to scattering and absorption. On the other hand, when the sample cuvette is on the collection side of the phantom, the Raman photons generated there are more efficiently collected, since this is where they have the least distance to travel in order to reach and be detected by the collection optics.
The distribution of Raman scattering signals across the maps will always be a balance between these two phenomena. As Intralipid molecules in the tissue phantom increase in concentration (Fig. 1c and d), it is progressively less likely for the Raman photons generated at the illumination spot to pass through the phantom volume and be detected on the other side of the cell prior to being absorbed or scattered out of the sample (signal balance moves to the collection (right) side).
As Intralipid concentration rises further (Fig. 1e–g), the path lengths for both laser and Raman photons increase considerably and therefore the water absorption engenders more significant impact on the signal distribution pattern. As mentioned in the literature25 and also confirmed with our measurements (Fig. 2), water absorbs the Raman photons generated in our setup (at 902 nm) more than the laser photons (830 nm). This explains why the signal balance moves to the collection surface (right), as it is easier for laser photons to traverse diffusely the cell than Raman photons, when the scattering increases.
 | ||
| Fig. 2 Absorbance spectra of water in the range of 400–1100 nm. Negative absorbance values are due to the difference in refractive index between air (used as a blank in the cuvette) and water. The cuvette path length in the measurements is 1 mm. | ||
Another important feature evidenced by the maps is that the higher the Intralipid concentration is, the broader the measurable signal region becomes. This means that a lesion located off the illumination–collection axis would be more likely to be detected in tissues with higher turbidity (modelled with higher Intralipid concentrations) than a lower one. This becomes clear if we compare maps with low Intralipid concentrations (Fig. 1b and c) with the ones with increased Intralipid (Fig. 1d–g).
The maps above support our understanding of Raman scattering distribution throughout the phantom volume, in the absence of any additional absorber apart from water itself. In the next step, we explored how this distribution changes under the influence of both scattering and elevated absorption, which is the case of real tissue.
Intralipid and India ink maps
Intralipid and Indian ink were combined in liquid tissue phantoms to best simulate real human breast and prostate tissue optical properties. In the first set of experiments a cuvette of HAP (calcium hydroxyapatite, a type of calcification found in tissues) was used to explore the effect of varying the optical properties on the recovery of signals from various locations within the phantom volume (Fig. 3). | ||
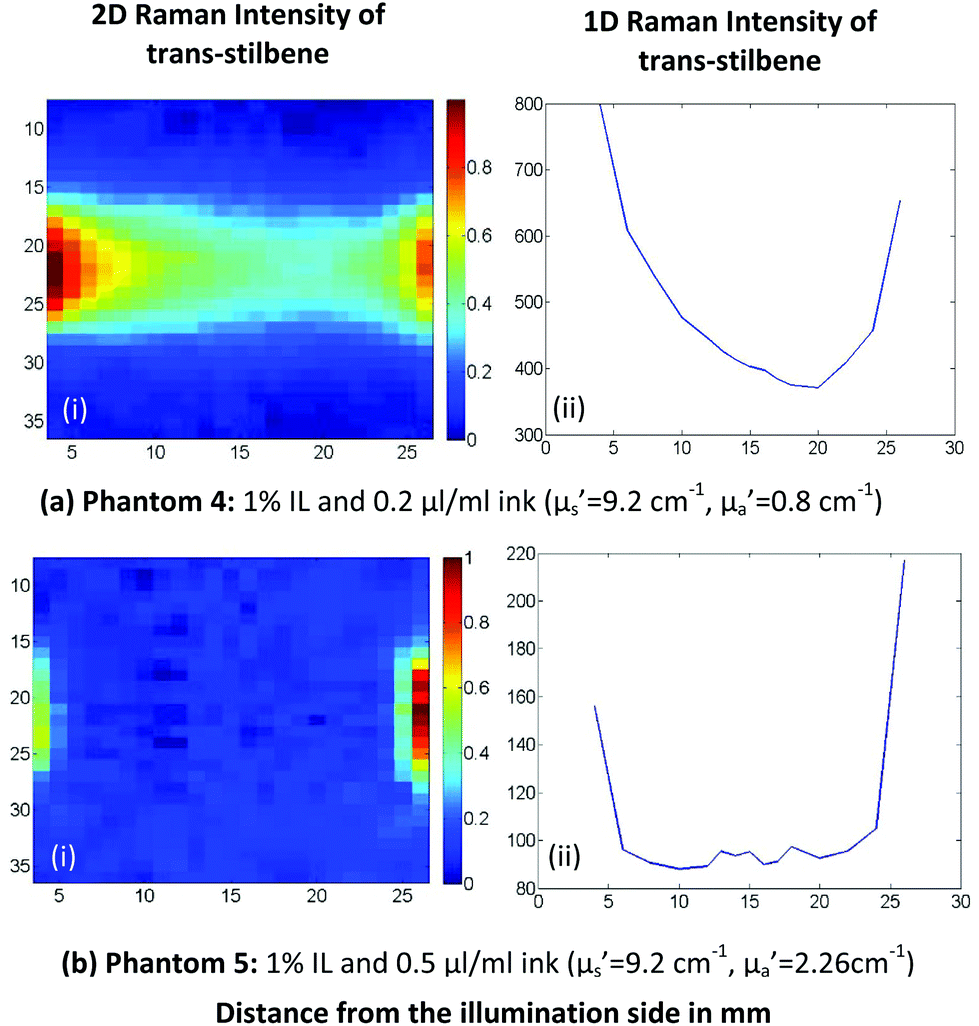
| Fig. 3 Raman scattering 2D(i) and 1D(ii) plots of different Intralipid/ink concentration HAP tissue phantoms. | ||
In these maps, when scattering and absorption agents are both present at low concentrations (Fig. 3a), we observe a strong Raman signal from both the illumination and the collection sides. If we double the density of scatterer but maintain the absorber concentration constant (Fig. 3b), the signal on the collection side is being significantly suppressed. This is due to the significant increase in the photon path length which directly increases the chances of the laser and Raman photons being absorbed by the Indian ink. For the same reason, when we increase the ink concentration, we expect a similar effect on the mapping pattern (Fig. 3c) where IL concentration was kept constant as in (a) but the concentration of the ink was increased.
Indian ink aqueous solution has been shown through UV/Vis absorbance measurements (Fig. 4) to absorb the laser photons (830 nm) more than the generated Raman ones (902 nm), i.e. the opposite net effect to that induced by water alone.
 | ||
| Fig. 4 Absorbance spectra of different Indian ink aqueous solutions concentrations (in microliters per ml) in the range of 400–1100 nm. The cuvette path length in the measurements is 1 cm. | ||
Consequently, the detected signal is much less likely to originate from the collection side of the phantom, as there are relatively less laser photons reaching it.
To characterise the system at the maximum range of prostate tissue relevant absorption and scattering conditions, which are higher than those used earlier in the paper, we had to resort to a stronger Raman scatterer, trans-stilbene. By replacing HAP with trans-stilbene it was possible to probe higher IL/ink concentration solutions with the existing Raman apparatus and while recording trans-stilbene's peak at 1192 cm−1 (921 nm). With this sample, we could still observe the same distribution pattern with the two maxima on illumination and collection side.
However, when we increase the absorption further (Fig. 5b), the collection side becomes more dominant. We should mention here that the absorption coefficient in Fig. 5b is well above the absorption range of human prostate and breast tissue and was only tested to assess the detection limits of our system. Additionally, with this level of absorber present, the Raman signal measured was of the order of the noise, which makes the data processing prone to errors.
 | ||
| Fig. 5 Raman scattering 2D(i) and 1D(ii) plots of different Intralipid/ink concentration trans-stilbene tissue phantoms. | ||
The findings from this study enable us to design optimised instrumentation for use with tissue samples. We expect that appropriate modifications in our system (increased laser power, minimized loss of laser photons from the sample using a ‘photon diode’, improved collection efficiency and opening slits and using high dispersion gratings) will increase signals by around two orders of magnitude; enabling the probing of samples with weaker signals at these depths.
Experimental
Tissue phantom optical properties
Inclusion-containing tissue phantoms with specific optical properties are a common approach to simulate tissues in deep Raman techniques.8,26,27 Intralipid (Fresenius Kabi Ltd, United Kingdom) and Indian ink (Histology Stain, American MasterTech) were used to induce diffuse scattering and absorbance in tissue phantoms respectively. Intralipid, a dilute mixture of emulsified fatty acids serves as a scattering medium whereas Indian ink, a dispersion of carbon particles, acts as a broad band absorbing agent.The Indian ink and Intralipid concentrations in phantoms were determined to match those for human prostate and breast tissue optical properties of absorbance and scattering, as found in the literature. However, there is only limited data in the literature on tissue optical properties for the laser wavelength of 830 nm.
The reduced scattering (μ′s) and absorption (μa) coefficient values, for normal and cancerous prostate glands, have been calculated through optical extinction and diffusion reflectance measurements. The values calculated for μ′s at 830 nm were 4 cm−1 for healthy and 6 cm−1 for cancerous prostate glands, whereas the values for μ′a were estimated to be 0.027 cm−1 for healthy and 0.002 cm−1 for cancerous prostate respectively.28
Svensson et al. used NIR time-resolved spectroscopy to estimate the reduced scattering coefficient between 5.5 and 9.5 cm−1 and absorption coefficient between 0.3 and 0.7 cm−1 for malignant prostate glands with untreated cancer.29
Concerning breast tissue, the reduced scattering coefficient has been calculated for 830 nm wavelength to be μ′s = 9.84 cm−1.30 Breast tissue absorption coefficients are not available in the literature for the exact wavelength of 830 nm, but a value of μa between 0.068 and 0.102 cm−1 in papillary breast cancer is estimated for the very close wavelength of 825 nm.30,31
Based on the literature values for reduced scattering and absorption coefficients of human prostate and breast tissues, we built liquid tissue phantoms using Intralipid and Indian ink concentrations which would provide equivalent values of optical properties.
Intralipid has been well characterized in terms of optical properties in the literature. Using the fitting parameters for 10%, 20% and 30% Intralipid provided by Michels et al.32 for calculating the Intralipid optical properties and converting for our wavelength, we plotted a fit line through which we extracted the Intralipid concentrations equivalent to the required reduced scattering coefficient values (Fig. 6).
 | ||
| Fig. 6 Percentage Intralipid concentration versus reduced scattering coefficient (cm−1). | ||
Using these values, liquid tissue phantoms with reduced scattering coefficients of: 2.3, 4.6, 9.2, 18.4, 27.7 and 36.9 cm−1 were produced, using Intralipid concentrations calculated based on the calibration line expression (y = 92.179x).
In terms of absorption properties, different concentrations of Indian ink were used to achieve different absorption coefficients in the phantom. Indian ink from different manufacturers has been widely employed and characterized in various studies.33 In this study we measured the absorption coefficient of our specific sample of Indian ink.
After having recorded UV/Vis absorption spectra of different ink concentrations, our data were curve fitted for the appropriate wavelength (830 nm) and the ink concentrations required for the human tissue absorption change were calculated.34 Our data were in a very good agreement with the literature, at least in the concentrations mentioned.28 Liquid phantoms were produced with absorption coefficients of: 0.37, 0.80 and 2.26 cm−1.
To simulate the optical properties of prostate and breast tissues, the scattering and absorption agents were combined in the same sample. The liquid tissue phantoms which were made to cover the range of optical properties in human prostate and breast tissues, are summarized in the Table 1.
| μ ′s (cm−1) | μ a (cm−1) | Raman signal | |
|---|---|---|---|
| Phantom a | 0 | — | HAP |
| Phantom b | 2.3 | — | HAP |
| Phantom c | 4.6 | — | HAP |
| Phantom d | 9.2 | — | HAP |
| Phantom e | 18.4 | — | HAP |
| Phantom f | 27.7 | — | HAP |
| Phantom g | 36.9 | — | HAP |
| Phantom 1 | 4.6 | 0.37 | HAP |
| Phantom 2 | 9.2 | 0.37 | HAP |
| Phantom 3 | 4.6 | 0.80 | HAP |
| Phantom 4 | 9.2 | 0.80 | trans-Stilbene |
| Phantom 5 | 9.2 | 2.26 | trans-Stilbene |
| Prostate tissue | 4–9.5 | 0.002–0.7 | — |
| Breast tissue | 9.84 | 0.068–0.102 | — |
Tissue phantom preparation
The liquid phantoms consisted of a quartz cell (45 mm width × 30 mm length (26 mm internal cell optical path length) × 45 mm height) (ramé-hart instrument co., USA) containing aqueous solutions of Intralipid and Indian ink in various concentrations.A thin cuvette (12 mm width, 4 mm length (2 mm optical path length)) containing hydroxyapatite (HAP) or trans-stilbene, was placed inside the quartz cell (see Fig. 7). The cuvette width (12 mm) was aligned with the y-axis and the 4 mm path is aligned with the optical axis of the system (x-axis). The cuvette was also attached to a motorized translation stage (Standa Ltd, Lithuania) and moved to 300 different positions in a two-dimensional grid inside the quartz cell during each mapping.
 | ||
| Fig. 7 (i) Liquid tissue phantoms components. (ii) The quartz cell and the HAP cuvette which were used in our measurements. | ||
It should be mentioned here that the large quartz cell dimensions were chosen in order to provide a first approximation to both breast volumes in mammographic screening (1.9–7.2 cm compressed breast thickness)35 and human prostate gland dimensions (4–4.5 cm length, 2–3.5 cm width, 1.7–2.5 cm thickness),36 so that the phantoms are able to approximate both in size and optical properties.
HAP was selected for these experiments to represent patho-biological material that is found in both breast and prostate tissues. Most importantly here, it has a distinct signal from surrounding soft tissues (or Intralipid here) and therefore the signals could be clearly identified. Calcifications already exhibit a crucial feature in various types of cancer such as breast cancer37 and prostate cancer.38 The HAP cuvette used in our experiments has a similar composition to that found in cancerous calcifications of the breast.39
Two different groups of liquid phantoms have been utilised.
(a) Scatterer only phantoms: cell containing an aqueous solution of Intralipid in different concentrations, ranging from 0–4%.
(b) Tissue representing phantoms: cell containing an aqueous solution of Intralipid and Indian ink in concentrations ranging from 0.5–1% for the first and 0.1–0.5 μl ml−1 for the second.
In the first place, liquid tissue phantoms containing HAP were employed to run a range of absorber and scatterer concentrations. Secondly, trans-stilbene was used to explore the system when the detection limits with HAP were reached, when using the higher scatterer and absorber concentrations in the samples.
Indian ink phantoms in different concentrations with no Intralipid, have also been used, in order to assess the individual effect of ink on light propagation in the samples (not shown here for brevity). Whenever Indian ink was used, it was first subjected to ultrasound in an ultrasonic water bath for 30 minutes. This is necessary in order to prevent suspended carbon particles from forming clusters in the aqueous solution and maintain reproducible ink optical properties.40,41
Deep Raman setup
The deep Raman system at Exeter University used a transmission Raman configuration (Fig. 8). It consisted of a spectrum stabilized laser (Innovative Photonics Solutions) with laser emission at 830 nm and an output power of ∼300 mW. The laser was coupled to a Thorlabs 400 μm multimode patch cord, collimated and filtered by passing through a pair of laser line filters (FL830-10, Thorlabs) in order to suppress the off-centre spectral emission from the laser line. The laser was directed towards the sample with a mirror and brought onto the sample with a 25 mm diameter, 70 mm focal length lens. The sample was illuminated with 280 mW of light in a 3–4 mm diameter spot. The collimated light passing through the tissue phantom is either scattered or absorbed by the molecules present. The Raman scattered photons were collected using an AR coated lens (f = 60 mm, dia. = 50 mm, INGCRYS Laser systems). The collimated scattered light was passed through a holographic super notch filter (HSPF-830.0 AR-2.0, Kaiser Optical Systems) to remove the elastically scattered light (laser photons) and imaged onto a fibre probe bundle by a second lens of the identical parameters to the collection lens (i.e. with no magnification). The fibre bundle (CeramOptec, ‘spot to slit line’ type bundle assembly, active area spot diameter approximately 2.21 mm, slit line approximately 0.25 mm × 14.95 mm) was connected to the entrance port of a Holospec VPH system spectrograph (Kaiser Optical systems Inc, HSG-917.4 custom). Maps were recorded using a deep depletion CCD camera cooled down to −75 °C (Andor Technology, DU420A-BR-DD, 1024 × 255 pixels). The overall spectral resolution of the detection system was ∼8 cm−1. | ||
| Fig. 8 Diagram of the deep Raman setup in a transmission mode used. | ||
The signal was collected using 6 accumulations of 5 seconds (apart from the water mapping where we recorded the signal for 120 × 0.25 seconds to stay below the CCD saturation levels) and the cosmic ray removal option of the detector software (Andor Solis) was applied. The system was calibrated using Raman bands of an aspirin tablet (acetylsalicylic acid).
Raman mapping
In order to explore the effect of Raman scattering and light distribution in the different tissue phantoms, the Raman spectra of the tissue phantom when the cuvette was in 300 different positions (in the x–y plane) were recorded. The movements were realized in ‘snake’ mode with the support of a motorized x–y translation stage. To make most efficient use of experimental time, steps were 1 mm in the main beam area (between 10–20 mm on x axis and 8–14 mm on y axis) and 2 mm around the edges of the large cell (the rest of the mapping area). At each step, a Raman spectrum was recorded and the stage was moved to the next position.Data analysis
All data were loaded into Matlab R2013a (MathWorks), where they were subjected to cosmic ray removal, baseline correction, principal component (PC) noise reduction and subsequent reconstruction from the first seven principal components into 1D and 2D images for better signal distribution visualization.In these presented maps, the colour of the pixel indicates the intensity above the fit baseline of the characteristic HAP peak (959 cm−1) or in the case of stilbene the peak at 1192 cm−1.
Conclusions
In this study we explored the Raman scattering distribution in the liquid tissue phantoms that mimic prostate and breast tissues in both approximate size and optical properties of the phantom. It has been clearly shown how the distribution of the collected Raman scattering signals changes under different values of absorption and scattering coefficients of the phantom. The results elucidate the distribution of Raman signals obtained from such extended tissue phantoms and demonstrate that the highest signals are likely to be obtained from nearer surface lesions than those at depth using transmission Raman. Even in this case though, we have demonstrated relative signals of around 40–60% for ‘lesions’ found in the centre of organs compared to those found towards the edges. This is contrary to observations reported earlier with pharmaceutical tablets where layered samples (of extended/infinite lateral dimensions) were investigated with minimal contributions from absorbers. These studies demonstrated a maximum signal originating from the centre of pharmaceutical tablets.10,11,42This study shows promise for future applications of transmission Raman, either in the breast or applied through fibre probes, to the prostate. It has advanced the understanding of how the distribution of collected Raman scattering signals change in relation to a range of expected optical properties of tissues. This helps the future design of instruments that we may wish to use to target disease specific signals within particular regions of the sample and pave the way towards the ultimate application of non-invasive deep Raman diagnosis of prostate and breast cancer.
Acknowledgements
We thank the STFC BioMedical Network (STFC, STMA00012) and the University of Exeter for their financial support. An EPSRC grant [EP/K020374/1] partly funded the work presented here.Notes and references
- P. Matousek, I. P. Clark, E. R. C. Draper, M. D. Morris, A. E. Goodship, N. Everall, M. Towrie, W. F. Finney and A. W. Parker, Appl. Spectrosc., 2005, 59, 393–400 CrossRef CAS.
- P. Matousek and N. Stone, J. Biomed. Opt., 2007, 12(2) CrossRef CAS PubMed , 024008.
- N. Stone and P. Matousek, Cancer Res., 2008, 68, 4424–4430 CrossRef CAS PubMed.
- N. Stone, M. Kerssens, G. R. Lloyd, K. Faulds, D. Graham and P. Matousek, Chem. Sci., 2011, 2, 776–780 RSC.
- B. R. McCreadie, M. D. Morris, T. C. Chen, D. S. Rao, W. F. Finney, E. Widjaja and S. A. Goldstein, Bone, 2006, 39, 1190–1195 CrossRef CAS PubMed.
- P. Matousek and N. Stone, J. Biophotonics, 2013, 6, 7–19 CrossRef CAS PubMed.
- M. D. Keller, E. Vargis, N. D. Granja, R. H. Wilson, M. A. Mycek, M. C. Kelley and A. Mahadevan-Jansen, J. Biomed. Opt., 2011, 16(7) CrossRef PubMed , 077006.
- J. L. H. Demers, F. W. L. Esmonde-White, K. A. Esmonde-White, M. D. Morris and B. W. Pogue, Biomed. Opt. Express, 2015, 6, 793–806 CrossRef PubMed.
- H. Dehghani, B. W. Pogue, S. P. Poplack and K. D. Paulsen, Appl. Opt., 2003, 42, 135–145 CrossRef.
- N. Everall, P. Matousek, N. MacLeod, K. L. Ronayne and I. P. Clark, Appl. Spectrosc., 2010, 64, 52–60 CrossRef CAS.
- P. Matousek and A. W. Parker, Appl. Spectrosc., 2006, 60, 1353–1357 CrossRef CAS PubMed.
- J. C. C. Day and N. Stone, Appl. Spectrosc., 2013, 67, 349–354 CrossRef CAS PubMed.
- D. B. Jim Cassidy, R. A. J. Spence and M. Payne, Oxford Handbook of Oncology, OUP, Oxford, 2nd edn, 2006 Search PubMed.
- F. H. Schroder, P. van der Maas, P. Beemsterboer, A. B. Kruger, R. Hoedemaeker, J. Rietbergen and R. Kranse, J. Natl. Cancer Inst., 1998, 90, 1817–1823 CrossRef CAS PubMed.
- A. Strazdina, G. Krumina and M. Sperga, Anticancer Res., 2011, 31, 1421–1426 Search PubMed.
- D. Shepherd, D. W. Keetch, P. A. Humphrey, D. S. Smith and D. Stahl, J. Urol., 1996, 156, 460–462 CrossRef CAS.
- E. D. Pisano, C. Gatsonis, E. Hendrick, M. Yaffe, J. K. Baum, S. Acharyya, E. F. Conant, L. L. Fajardo, L. Bassett, C. D'Orsi, R. Jong, M. Rebner and D. I. Grp, N. Engl. J. Med., 2005, 353, 1773–1783 CrossRef CAS PubMed.
- C. K. Kuhl, S. Schrading, C. C. Leutner, N. Morakkabati-Spitz, E. Wardelmann, R. Fimmers, W. Kuhn and H. H. Schild, J. Clin. Oncol., 2005, 23, 8469–8476 CrossRef PubMed.
- J. G. Elmore, K. Armstrong, C. D. Lehman and S. W. Fletcher, JAMA, J. Am. Med. Assoc., 2005, 293, 1245–1256 CrossRef CAS PubMed.
- Y. J. Zhang, L. Wei, J. Li, Y. Q. Zheng and X. R. Li, Gland Surgery, 2013, 2, 15–24 Search PubMed.
- P. Crow, N. Stone, C. A. Kendall, R. A. Persad and M. P. J. Wright, BJU Int., 2003, 92, 400–407 CrossRef CAS.
- N. Stone, M. C. H. Prieto, P. Crow, J. Uff and A. W. Ritchie, Anal. Bioanal. Chem., 2007, 387, 1657–1668 CrossRef CAS PubMed.
- A. S. Haka, K. E. Shafer-Peltier, M. Fitzmaurice, J. Crowe, R. R. Dasari and M. S. Feld, Proc. Natl. Acad. Sci. U. S. A., 2005, 102, 12371–12376 CrossRef CAS PubMed.
- N. Stone, R. Baker, K. Rogers, A. W. Parker and P. Matousek, Analyst, 2007, 132, 899–905 RSC.
- G. M. Hale and M. R. Querry, Appl. Opt., 1973, 12, 555–563 CrossRef CAS PubMed.
- I. E. I. Petterson, F. W. L. Esmonde-White, W. de Wilde, M. D. Morris and F. Ariese, Analyst, 2015, 140, 2504–2512 RSC.
- F. W. L. Esmonde-White, K. A. Esmonde-White, M. R. Kole, S. A. Goldstein, B. J. Roessler and M. D. Morris, Analyst, 2011, 136, 4437–4446 RSC.
- Y. Pu, W. B. Wang, M. AL-Rubaiee, S. K. Gayen and M. Xu, Appl. Spectrosc., 2012, 66, 828–834 CrossRef CAS PubMed.
- T. Svensson, S. Andersson-Engels, M. Einarsdottir and K. Svanberg, J. Biomed. Opt., 2007, 12(1) CrossRef PubMed , 014022.
- S. L. Jacques, Phys. Med. Biol., 2013, 58, R37–R61 CrossRef PubMed.
- S. Fantini, S. A. Walker, M. A. Franceschini, M. Kaschke, P. M. Schlag and K. T. Moesta, Appl. Opt., 1998, 37, 1982–1989 CrossRef CAS.
- R. Michels, F. Foschum and A. Kienle, Opt. Express, 2008, 16, 5907–5925 CrossRef CAS.
- S. J. Madsen, M. S. Patterson and B. C. Wilson, Phys. Med. Biol., 1992, 37, 985–993 CrossRef CAS.
- Y. L. Zhang, Y. Yin, X. H. Liu, Z. Q. Shi, L. Q. Feng, M. L. Liu, G. W. Zhu, Z. J. Gong and B. Q. Qin, Org. Geochem., 2011, 42, 510–519 CrossRef CAS PubMed.
- F. Sardanelli, F. Zandrino, A. Imperiale, E. Bonalde, M. G. Quartini and N. Cogorno, Radiology, 2000, 217, 576–580 CrossRef CAS PubMed.
- The Great Soviet Encyclopedia, ed. I. The Gale Group, 3rd (1970–1979) edn, 2010 Search PubMed.
- M. Scimeca, E. Giannini, C. Antonacci, C. A. Pistolese, L. G. Spagnoli and E. Bonanno, BMC Cancer, 2014, 14, 286 CrossRef PubMed.
- K. S. Sfanos, B. A. Wilson, A. M. De Marzo and W. B. Isaacs, J. Urol., 2009, 182, 163–163 Search PubMed.
- R. Baker, K. D. Rogers, N. Shepherd and N. Stone, Br. J. Cancer, 2010, 103, 1034–1039 CrossRef CAS PubMed.
- P. Di Ninni, F. Martelli and G. Zaccanti, Opt. Express, 2010, 18, 26854–26865 CrossRef CAS PubMed.
- L. Spinelli, M. Botwicz, N. Zolek, M. Kacprzak, D. Milej, P. Sawosz, A. Liebert, U. Weigel, T. Durduran, F. Foschum, A. Kienle, F. Baribeau, S. Leclair, J. P. Bouchard, I. Noiseux, P. Gallant, O. Mermut, A. Farina, A. Pifferi, A. Torricelli, R. Cubeddu, H. C. Ho, M. Mazurenka, H. Wabnitz, K. Klauenberg, O. Bodnar, C. Elster, M. Benazech-Lavoue, Y. Berube-Lauziere, F. Lesage, D. Khoptyar, A. A. Subash, S. Andersson-Engels, P. Di Ninni, F. Martelli and G. Zaccanti, Biomed. Opt. Express, 2014, 5, 2037–2053 CrossRef CAS PubMed.
- N. Everall, I. Priestnall, P. Dallin, J. Andrews, I. Lewis, K. Davis, H. Owen and M. W. George, Appl. Spectrosc., 2010, 64, 476–484 CrossRef CAS.
Footnote |
| † Joint senior authors. |
| This journal is © The Royal Society of Chemistry 2015 |