
 Open Access Article
 This Open Access Article is licensed under a
 Creative Commons Attribution 3.0 Unported Licence
Liquid extraction surface analysis field asymmetric waveform ion mobility spectrometry mass spectrometry for the analysis of dried blood spots†
Rian L.
Griffiths
,
Alex
Dexter
,
Andrew J.
Creese
and
Helen J.
Cooper
*
School of Biosciences, University of Birmingham, Edgbaston, Birmingham B15 2TT, UK. E-mail: h.j.cooper@bham.ac.uk
First published on 15th July 2015
Abstract
Liquid extraction surface analysis (LESA) is a surface sampling technique that allows electrospray mass spectrometry analysis of a wide range of analytes directly from biological substrates. Here, we present LESA mass spectrometry coupled with high field asymmetric waveform ion mobility spectrometry (FAIMS) for the analysis of dried blood spots on filter paper. Incorporation of FAIMS in the workflow enables gas-phase separation of lipid and protein molecular classes, enabling analysis of both haemoglobin and a range of lipids (phosphatidylcholine or phosphatidylethanolamine, and sphingomyelin species) from a single extraction sample. The work has implications for multiplexed clinical assays of multiple analytes.
Introduction
Liquid extraction surface analysis (LESA) mass spectrometry is a direct surface sampling technique originally developed by Van Berkel and co-workers.1,2 Analytes are extracted from the surface via a liquid micro-junction between a pipette tip and the sample surface. This approach enables direct sampling of a variety of biological analytes, such as drugs,3 lipids4,5 and proteins,6–8 from a range of solid surfaces prior to electrospray ionisation (ESI). Substrates analysed by LESA include thin tissue sections,3,6,9 bacterial colonies grown on agar,7 dried blood spots on card8,10,11 and polymeric surfaces.4,12 Other direct analysis approaches that have been applied to the analysis of dried blood spots include desorption electrospray ionisation (DESI),13 direct analysis in real time (DART)14,15 and paperspray.16–18Previous analyses of dried blood spots (DBS) on card have shown that peaks corresponding to the intact α-globin and β-globin sub-units can be detected via LESA MS.8,11 More recently, we have shown that intact tetrameric haemoglobin can be detected by LESA MS of dried blood spots.12 LESA MS therefore has potential applications in the analysis of haemoglobinopathies, the most commonly inherited disorders. Edwards et al. showed that LESA MS of dried blood spots was suitable for the screening of variants HbS, HbC, HbD, HbE, and β-thalassemia.8,19
Haemoglobin is highly abundant in blood samples (between 120 and 130 mg mL−1 (ref. 20)), however a range of other analytes, such as lipid species, are also present and have been implicated as biomarkers for disease profiling. Analysis of DBS samples, rather than whole blood, can be preferential in a clinical setting owing to the reduced sample volumes required,21 the relative ease of storage compared to whole blood or plasma22 and due to the reduced risk of infection from certain blood borne diseases.23
Generally lipids are prepared from DBS samples by taking a “punch” and extracting in methanolic solution before performing mass spectrometry analysis.24–27 Sandlers et al. used an LC MS/MS approach to monitor 26:0 lyso-phosphotidylcholine as a biomarker of X-linked adrenoleukodystrophy24 in samples eluted from DBS. Koulman et al. showed that the lipid profile in samples from DBS was a reliable indicator of lipid metabolism in infants.25 These researchers also reported that monitoring of lipid species from DBS samples yielded more precise results in comparison to plasma samples, owing to the prevention of degradation processes upon drying.25 Faller et al. have shown that the monitoring of phosphatidylethanolamine species extracted from DBS samples by LC MS/MS can be determined as reliably as from whole blood,26 which could be a viable method of monitoring alcohol misuse. Recently, Dénes et al. reported the detection of a wide range of metabolites, including lipids, from similarly prepared samples.27 They also showed that their methods were sufficiently robust for disease profiling.
A method which combines the benefits of direct sampling of dried blood spots (elimination of sample preparation) with the ability to separate molecule classes, e.g., lipids and proteins, would be of great benefit: such a method would overcome the challenge of interference from haemoglobin enabling direct analysis of lipids. Furthermore, separation of the different sub-units of haemoglobin could be advantageous in the diagnosis of haemoglobinopathies.
Here, we combine field asymmetric waveform ion mobility spectrometry (FAIMS) with LESA of DBS. We have recently demonstrated the benefits of coupling of FAIMS to LESA MS analysis of thin tissue sections and bacterial colonies growing on agar.28 FAIMS separates ions at atmospheric pressure on the basis of their differential ion mobilities in high and low electric fields29,30 and offers advantages including improved signal-to-noise ratios, reduced chemical noise31 and separation of isomeric analytes.32,33 In the current work, we show that LESA FAIMS mass spectrometry of DBS enables separation of the haemoglobin α- and β-sub units from lipid species. Lipids identified included phosphatidylcholine or phosphatidylethanolamine species and sphingomyelin species. The lipids could not be detected by LESA mass spectrometry in the absence of FAIMS.
Methods
Dried blood spots
The work was approved by the University of Birmingham STEM Ethical Review Committee (ERN_14-0454). Dried blood spots were acquired from healthy human adult donors via finger prick onto NHS blood spot (Guthrie) cards, Ahlstrom grade 226 filter paper ID Biological Systems, (Greenville, USA) and dried overnight prior to analysis. Reproducibility data were obtained from four technical replicates from each of two biological replicates. DBS were sampled 1 day after collection and 6 days after collection. Samples were stored in a covered dish at room temperature.Surface sampling
![[thin space (1/6-em)]](https://www.rsc.org/images/entities/char_2009.gif) :1 methanol:(HPLC grade) water (both JT Baker, Deventer, The Netherlands) with the addition of 1% formic acid (Sigma-Aldrich Company Ltd, Dorset, U.K.) was used as the extraction and ionisation solvent. In the extraction process, 10 μl of solvent was aspirated from the solvent well. The robotic arm relocated to a position above the sample and descended to a height of 1.6 mm above the surface. Four microlitres of solvent was dispensed onto the surface. After a delay of 3 seconds, 4.5 μl of sample was reaspirated into the pipette tip before samples were infused into the mass spectrometer via chip-based electrospray ionisation. Samples were infused with a gas pressure of 0.3 PSI and an ionisation voltage of 1.7 kV.
:1 methanol:(HPLC grade) water (both JT Baker, Deventer, The Netherlands) with the addition of 1% formic acid (Sigma-Aldrich Company Ltd, Dorset, U.K.) was used as the extraction and ionisation solvent. In the extraction process, 10 μl of solvent was aspirated from the solvent well. The robotic arm relocated to a position above the sample and descended to a height of 1.6 mm above the surface. Four microlitres of solvent was dispensed onto the surface. After a delay of 3 seconds, 4.5 μl of sample was reaspirated into the pipette tip before samples were infused into the mass spectrometer via chip-based electrospray ionisation. Samples were infused with a gas pressure of 0.3 PSI and an ionisation voltage of 1.7 kV.
UltraFAIMS
FAIMS was carried out in positive ion mode using a miniaturized ultraFAIMS device (Owlstone, Cambridge, UK), using a NC chip with a trench length of 78.1 mm and a gap of 101.3 μm and a thickness of 700 μm. The FAIMS device was interfaced to an Orbitrap Velos (Thermo Scientific, UK) mass spectrometer. 2D FAIMS: separation was performed at eight discrete dispersion fields (DFs) between 130 Td and 270 Td with step size 20 Td. At each DF, the compensation field (CF) was varied between −1 to +4 Td over a 180 s time period. Static FAIMS: optimal DF and CF conditions for the transmission of ions of interest were selected from the 2D FAIMS analysis. For transmission of lipids the conditions were DF = 130 Td and CF = 1.8 Td.Mass spectrometry
2D FAIMS experiments were performed on a Thermo Fisher Orbitrap Velos mass spectrometer at a resolution of 100000 at m/z 400. Static FAIMS and HCD experiments were performed on a Thermo Fisher Orbitrap Elite mass spectrometer at a resolution of 120000 at m/z 400. Full scan mass spectra were collected in the Orbitrap between m/z 600–2000. The AGC target was 1 × 10⁶ charges with a maximum injection time of 1000 ms. Each scan was composed of 1 microscan. MS/MS: precursor ions were selected for fragmentation in the linear ion trap (isolation width 2 Th). HCD experiments (NCE 18–20%) were recorded at a resolving power of 120000 at m/z 400. AGC target was 2 × 10⁴ charges with maximum injection time 1000 ms. Each scan comprised 1 microscan. MS/MS spectra shown comprise 125 co-added scans (3 minutes of data).
Data analysis
Data were converted from Thermo.raw format to mzML using msconvert as part of ProteoWizard34 and then to imzML using imzMLConverter.35 Data in the imzML format were then loaded into MATLAB (version 2013, The MathWorks Inc., Natick, Massachusetts) using imzMLConverter and in-house software. Total ion transmission maps and single ion transmission maps were generated as described in ref. 28, further implemented to allow generation of three dimensional total ion transmission maps. Software for generation of total ion transmission maps and single ion transmission maps, together with a step-by-step guide, is available for download from http://www.biosciences-labs.bham.ac.uk/cooper/software.html.Lipid assignment
Abundant lipid species detected from DBS samples were identified by a combination of higher energy collision dissociation (HCD) and accurate mass (5 ppm tolerance) via cross-referencing with the LIPID MAPS database.36,37 Lower abundance species were assigned solely on the basis of accurate mass (5 ppm tolerance) with cross referencing against the LIPID MAPS database. MS/MS spectra were analysed manually in Xcalibur version 3.0.63 (Thermo Fisher).Results and discussion
The LESA Nanomate robot was coupled to the Owlstone ultraFAIMS device, which in turn was coupled to a high mass resolution Orbitrap mass spectrometer. LESA sampling of DBS on filter paper was coupled with a 2D FAIMS analysis in which the dispersion field (DF) was varied between 130 and 270 Td and the compensation field (CF) was varied between −1 and 4 Td. Fig. 1 (Panels A–H) show the total ion transmission maps (m/z versus CF) obtained at each of the dispersion fields (DF 130 to 270 Td in increments of 20 Td). Fig. 1 (Panels I–P) show the same data plotted as three dimensional total ion transmission maps. Displaying the data in this way offers insight as to the global changes afforded by changing DF. It is evident from these maps that increasing DF results in transmission of ions across a greater range of compensation fields. Similar behaviour was observed for LESA FAIMS analysis of thin tissue sections.28 The striations apparent in the 2D total ion transmission maps correspond to the various charge states of the protein ions. These features are particularly noticeable here due to the high concentration of haemoglobin in these samples. ESI Fig. 1† shows the 2D total ion transmission map obtained at 270 Td (Panel H) together with the averaged mass spectrum acquired during this 3 minute experiment overlaid. It is clear from this figure that the high intensity strata in the total ion transmission map correlate to α-globin and β-globin ions in charge states varying from +14 to +20.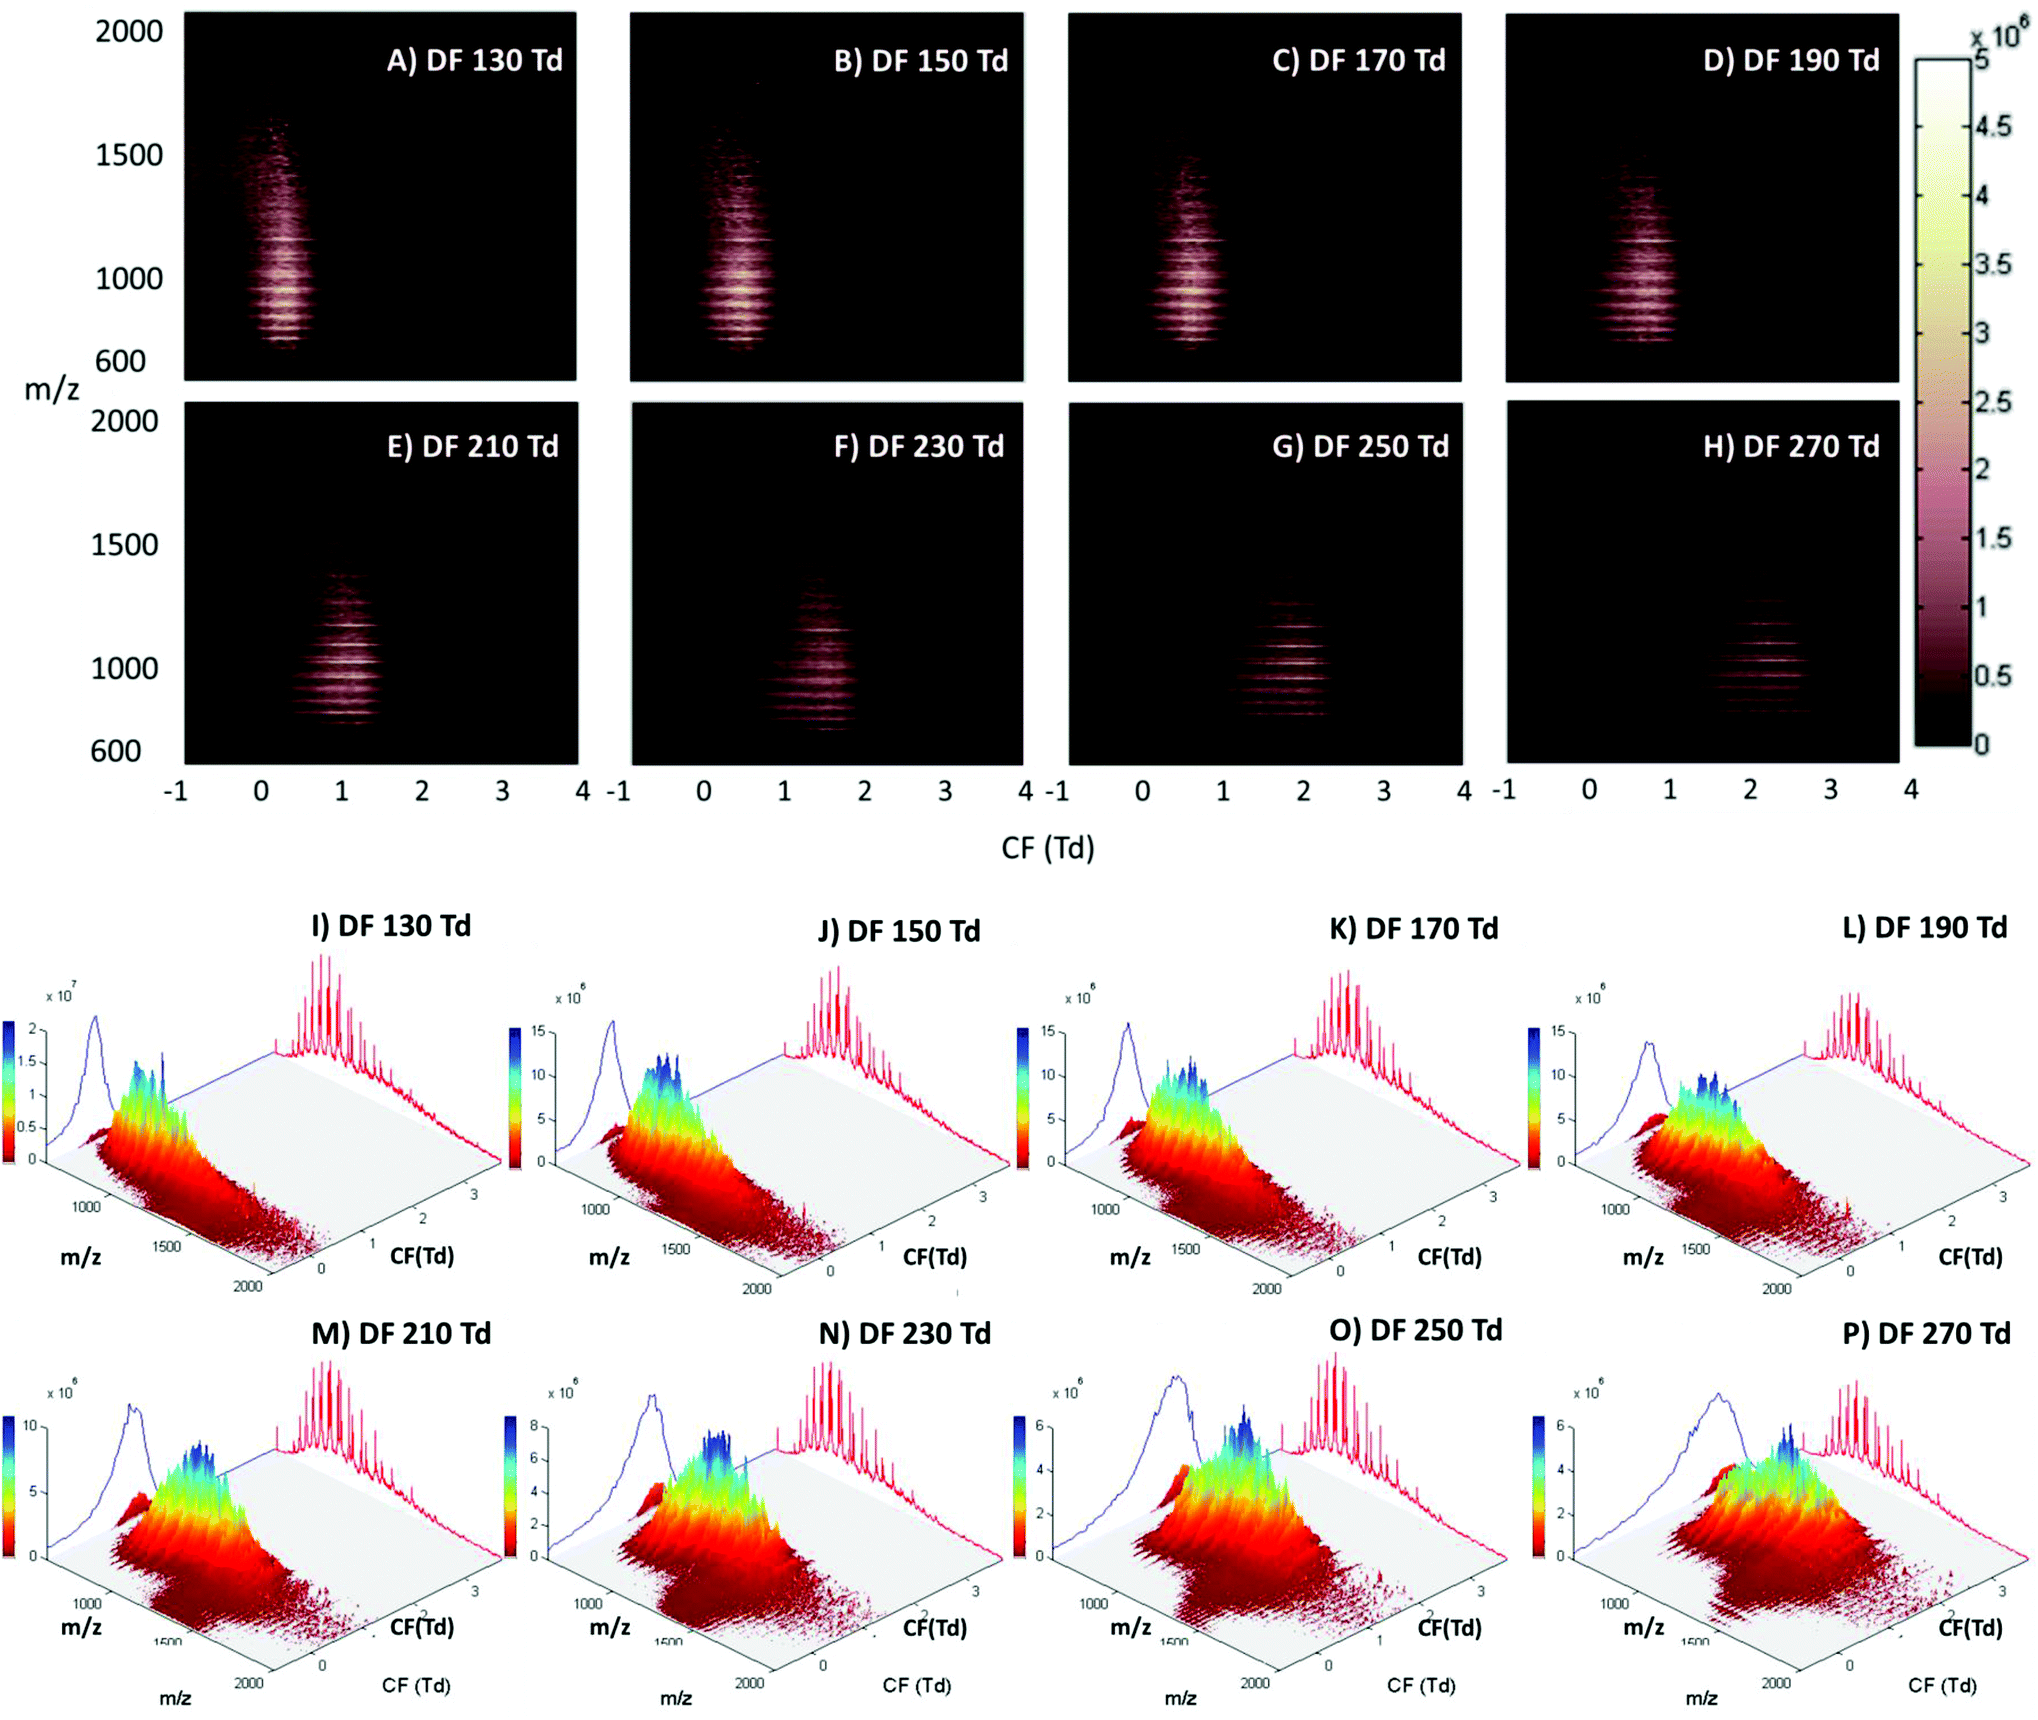 | ||
| Fig. 1 (A) to (H): 2-dimensional total ion transmission maps (m/z vs. compensation field (CF)) obtained following LESA-FAIMS mass spectrometry of dried blood spots at dispersion fields DF = 130 Td, 150 Td, 170 Td, 190 Td, 210 Td, 230 Td, 250 Td and 270 Td. (I) to (P): 3-dimensional total ion transmission plots of the same data showing signal intensity in the z axis, with a mean mass spectrum projected in red and total ion chromatogram projected in blue. | ||
Single ion transmission maps for the various charge states of α- and β-globin, in which the transmission of specific m/z values according to DF and CF, are shown in ESI Fig. 2.† It is evident from these maps that the transmission of each globin chain did not differ significantly from the other; hence the use of the FAIMS field did not enable separation of the α- and β-globin chains. Lower charge state ions were transmitted from lower CF values than higher charge state ions, and higher charge state ions were transmitted over a broader CF range as DF increased. Brown et al. have described similar results; that multiply charged peptides are transmitted at higher compensation fields when compared to lower charge state peptides.38
Blood constitutes a complex mixture of proteins, many of which have been identified from DBS samples. Martin et al. reported identification of 120 different proteins in a single dried blood spot10 following LESA sampling coupled with automated tryptic digestion. Nevertheless, no proteins other than the globins were observed following LESA FAIMS. That is, the inclusion of FAIMS could not mitigate the issue of dynamic range for the analysis of proteins in DBS.
The main benefit in coupling FAIMS with LESA analysis of dried blood spots arises from the ability to separate molecular classes, i.e., lipids and proteins. Fig. 2A shows the LESA mass spectrum obtained from DBS in the absence of FAIMS. Clearly, the most abundant species are the α- and β-globin protein ions. Peaks observed at m/z 757, 797, 841, 890, 946, 1009 and 1081 correspond to the +20 to +14 charge states of α-globin, and those at m/z 882, 934, 992, 1058 and 1134 correspond to the +18 to +14 charge states of β-globin. By introducing FAIMS into the workflow, it is possible to focus the protein ions. The total ion transmission map obtained at DF = 130 Td (Fig. 1A) shows the region of FAIMS DF/CF space populated by globin ions is more confined than when compared with that obtained at DF = 270 Td. This focusing of haemoglobin protein ions at DF = 130 Td enables the separation of lipid species. Fig. 2B shows the averaged mass spectrum obtained in the CF range 0.18 to 1.54 Td at DF = 130 Td. The peaks observed correspond to the α-globin and β-globin ions in various charge states. Fig. 2C shows the averaged mass spectrum obtained in the CF range 1.78 to 3.86 Td at DF = 130 Td. The mass spectrum is dominated by peaks corresponding to singly-charged lipid species (which were not observed in the absence of FAIMS) and peaks corresponding to haemoglobin are observed in the +20 and +19 charge states only.
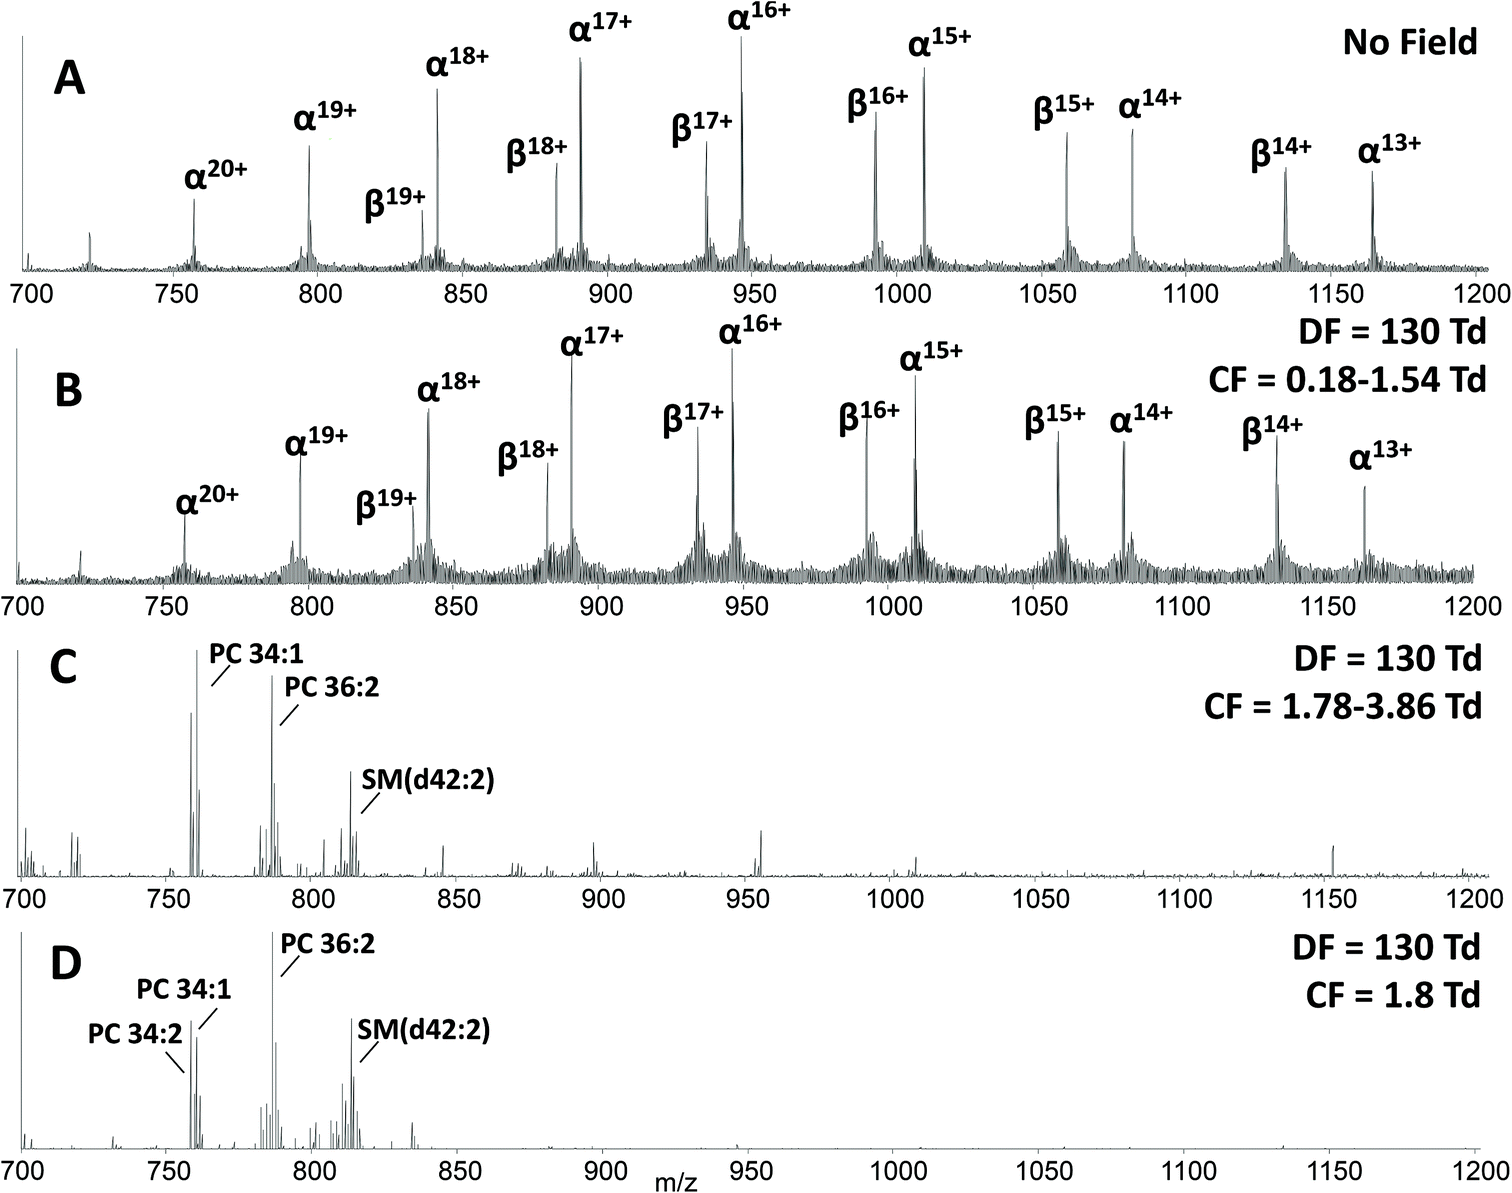 | ||
| Fig. 2 (A) LESA mass spectrum obtained from a DBS in the absence of FAIMS; (B) LESA FAIMS mass spectrum obtained from a DBS (2D FAIMS: DF 130 Td, CF = 0.18–1.54 Td); (C) LESA FAIMS mass spectrum obtained from a DBS (2D FAIMS: DF = 130 Td, CF = 1.78–3.86 Td); (D) LESA FAIMS mass spectrum obtained from a DBS (static FAIMS: DF = 130 Td, CF = 1.8 Td). | ||
A two dimensional FAIMS analysis (in which DF and CF are varied) enables identification of optimum FAIMS conditions for transmission of a particular (set of) ions.28 A static FAIMS analysis (in which DF and CF are constant) can subsequently be performed. In the present case, lipid species from DBS were optimally transmitted under the following conditions: DF 130 Td and CF 1.8 Td. Fig. 2D shows an example mass spectrum acquired under these experimental conditions. (Mass spectrum comprises 1 minute of data (42 scans)). Lipid species were assigned by a combination of MS/MS and accurate mass cross-referencing against the LIPID MAPS database.36,37 Higher-energy collision dissociation (HCD) of the abundant precursor ions with m/z 758.6, 760.6, 782.6 and 786.6 resulted in detection of one predominant product ion at m/z 184.1, see ESI Fig. 3,† which corresponds to the protonated phosphatidylcholine (PC) headgroup.39 A number of further species, with insufficient abundance to acquire MS/MS data, were assigned by accurate mass as protonated phospholipid species, either phosphatidylcholine (PC) or phosphatidylethanolamine (PE) species, and sphingomyelin species (SM). Lipid assignments are summarised in Table 1.
| Measured, m/z | Calculated, m/z | Δ, ppm | Assignment |
|---|---|---|---|
| 758.5673 | 758.5694 | 2.8 | *PC 34:2 [M + H]+ |
| 760.5833 | 760.5851 | 2.4 | *PC 34:1 [M + H]+ |
| 782.5668 | 782.5694 | 3.3 | *PC 36:4 [M + H]+ |
| 784.5828 | 784.5851 | 2.9 | PC 36:3 or PE 39:3 [M + H]+ |
| 786.5984 | 786.6007 | 2.9 | *PC 36:2 [M + H]+ |
| 787.6670 | 787.6687 | 2.2 | SM(d40:1) [M + H]+ |
| 788.6132 | 788.6164 | 4.1 | PC 36:1 or PE 39:1 [M + H]+ |
| 810.5987 | 810.6007 | 2.5 | PC 38:4 or PE 41:4 [M + H]+ |
| 811.6661 | 811.6687 | 3.2 | SM(d42:3) [M + H]+ |
| 813.6824 | 813.6844 | 2.5 | SM(d42:2) [M + H]+ |
| 815.6990 | 815.7000 | 1.2 | SM(d42:1) [M + H]+ |
In order to probe the reproducibility of the LESA FAIMS approach for analysis of lipids from DBS, static FAIMS experiments were performed. Two biological replicates were each analysed at four separate locations at two time points (1 day after sample collection and 6 days after sample collection). The results are shown in Fig. 3. For each set of technical replicates (for each lipid m/z, at each time point from each biological sample), the reproducibility was good. (Error bars indicate one standard deviation). The variation between biological replicates was greater on day 1 than on day 6, although the variation was only significant (p < 0.05 as given by a Student's t-test) for m/z 813.7 (SMd42:2) on day 1, and for m/z 786.6 (PC 36:2) on day 6. For biological replicate 1, the variation between time points was significant (p < 0.05) for m/z 758.6 (PC 34:2) and very significant (p < 0.01) for m/z 760.6 (PC 34:1) and m/z 810.6 (PC 38:4 or PE 41:4). For biological replicate 2, the variation in relative abundance was significant (p < 0.05) for m/z 786.6 (PC 36:2) and very significant (p < 0.01) for m/z 810.6 (PC 38:4 or PE 41:4). These results suggest that (a) reproducibility between technical replicates is high, (b) the (expected) variation between biological replicates is clearer in samples that are 1 day old, (c) some lipid degradation occurs after 6 days. Further work to characterise the latter is warranted.
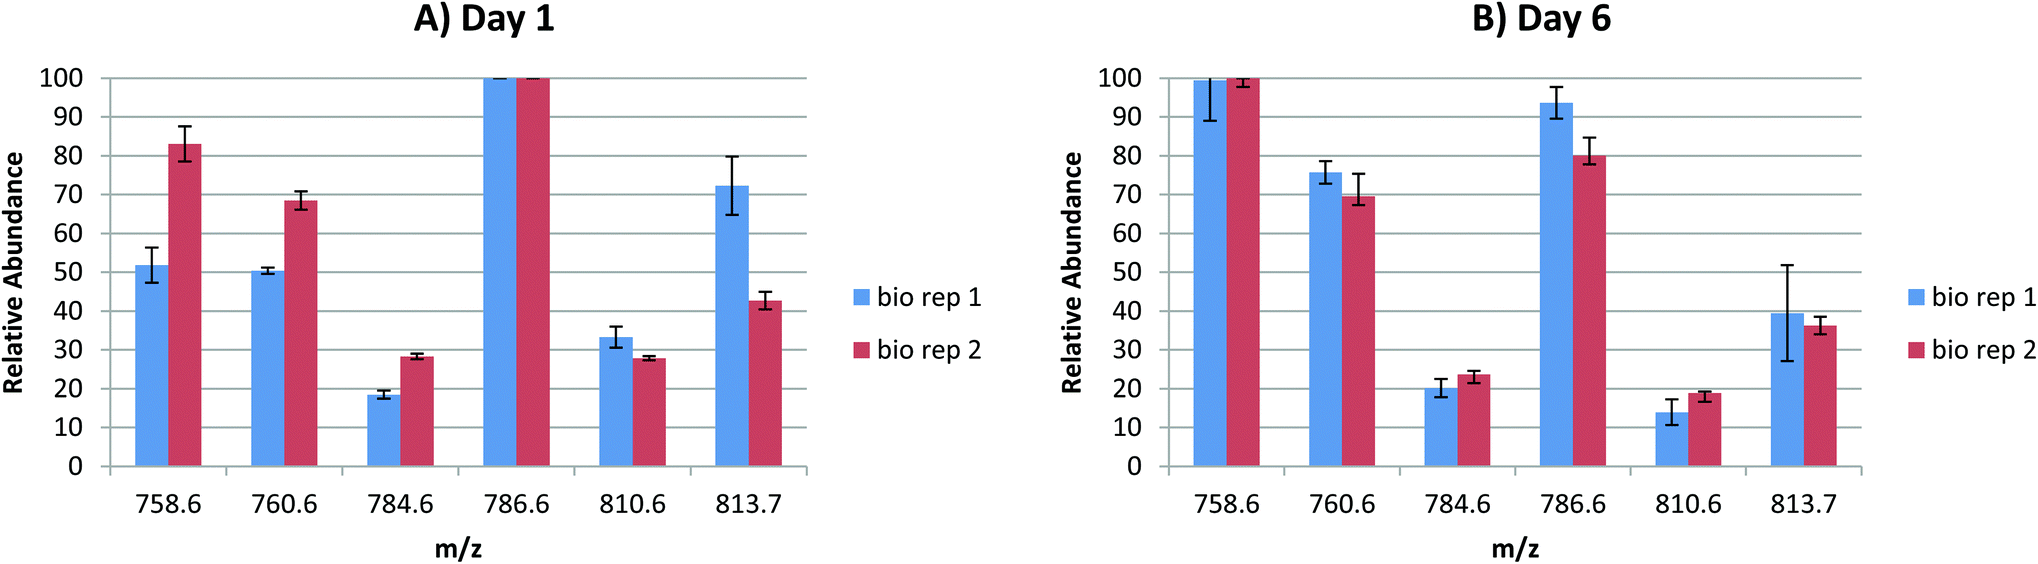 | ||
| Fig. 3 Relative abundances of the 6 most abundant lipid species detected during LESA FAIMS mass spectrometry analysis of DBS (DF = 130 Td; CF = 1.8 Td) at (A) 1 day and (B) 6 days after sample collection. Each biological replicate and time point is represented by 4 technical replicates. Error bars show one standard deviation. | ||
The lipid species identified are major components of cell membranes and therefore play an important structural role. The phosphatidylcholine lipids PC 34:2, 36:2, and 38:4 observed here were also detected directly from dried blood spot samples via paperspray ionisation coupled with a triple quadrupole mass spectrometer by Espy et al.40 The results here show a wider range of lipid species can be detected directly from dried blood spots via LESA FAIMS mass spectrometry. As described above, a number of researchers have used the DBS sample format as a platform for studying phospholipids. In each case, the researchers employed lengthy extraction procedures in order to extract the reported lipid species from the dried blood spot samples. For example, Denes et al. extracted samples in methanol for 30 minutes and then mixed the sample as a 1:1 mixture with water before ESI mass spectrometry using the Triversa Nanomate robot.27 Our results show direct surface sampling (LESA) coupled with FAIMS leads to the detection of an increased number of different phospholipid species in a much shorter analysis time and using more straightforward experimental methods.
Although a wider range of lipid species have been reported in other investigations (Koulman et al. describe the detection of a range of PCs, PEs, SMs, TAGs and CEs in the mass range m/z 640–1000 from infant samples25), the initial results described in this study are promising. Inclusion of the FAIMS device in the mass spectrometry workflow reduces the requirement for lengthy extraction procedures to monitor phospholipid and sphingomyelin species from these samples. Optimisation of the extraction solvent used for LESA-FAIMS experiments could increase the number of lipid classes detected from dried blood spot samples and work in this area is ongoing.
As described above, Edwards et al. have shown it is possible unambiguously assign a number of haemoglobin variants via LESA sampling of newborn DBS.8,11,19 Furthermore, Koulman et al. showed that monitoring of lipid species in newborn DBS is a suitable approach for determining lipid metabolism.25 The method presented here could be tailored for the targeted analysis of a range of analytes, such as proteins and lipid species, in a single analysis. This finding has implications for the clinic: it is feasible that metabolites, for instance phospholipids, could be monitored alongside haemoglobin variants, directly from a single extraction from a dried blood spot sample simply by varying the FAIMS parameters. Moreover, the analysis time is short: the protein mass spectrum shown in Fig. 2B was recorded in <20 seconds and the lipid mass spectrum in Fig. 2C in <60 seconds. Hence it would be possible to acquire both protein and lipid data within 90 seconds of analysis time.
Conclusions
LESA FAIMS mass spectrometry is presented as a tool for the analysis of dried blood spots. The approach allows the separation of highly abundant haemoglobin ions from lower abundance lipid ions which could not be detected in the absence of FAIMS. It was not possible to separate the individual globin units (α and β) by use of the ultraFAIMS, nor were any additional proteins identified. A range of lipids were identified including phosphatidylcholine or phosphatidylethanolamine and sphingomyelin species. These species are biologically relevant and have previously been shown to be potential targets in the screening of diseases in newborns. LESA FAIMS mass spectrometry of DBS could find application in the clinic for multiplexed screening assays, i.e., monitoring of haemoglobin variants and lipids in a single analysis.Acknowledgements
HJC, RLG and AJC are funded by EPSRC (EP/L023490/1). AD is in receipt of an EPSRC studentship via the PSIBS doctoral training centre (EP/F50053X/1), in collaboration with Astra Zeneca and the National Physical Laboratory. The Advion Triversa Nanomate and Thermo Fisher Orbitrap Velos mass spectrometer used in this research were funded through Birmingham Science City Translational Medicine, Experimental Medicine Network of Excellence Project with support from Advantage West Midlands. Supplementary data supporting this research is openly available from the University of Birmingham data archive at http://findit.bham.ac.uk/.References
- V. Kertesz, M. J. Ford and G. J. Van Berkel, Anal. Chem., 2005, 77, 7183–7189 CrossRef CAS PubMed.
- V. Kertesz and G. J. Van Berkel, J. Mass Spectrom., 2010, 45, 252–260 CrossRef CAS PubMed.
- D. Eikel, M. Vavrek, S. Smith, C. Bason, S. Yeh, W. A. Korfmacher and J. D. Henion, Rapid Commun. Mass Spectrom., 2011, 25, 3587–3596 CrossRef CAS PubMed.
- S. H. Brown, L. H. Huxtable, M. D. Willcox, S. J. Blanksby and T. W. Mitchell, Analyst, 2013, 138, 1316–1320 RSC.
- R. L. Griffiths, J. Sarsby, E. J. Guggenheim, A. M. Race, R. T. Steven, J. Fear, P. F. Lalor and J. Bunch, Anal. Chem., 2013, 85, 7146–7153 CrossRef CAS PubMed.
- J. Sarsby, N. Martin, P. Lalor, J. Bunch and H. Cooper, J. Am. Soc. Mass Spectrom., 2014, 25, 1953–1961 CrossRef CAS PubMed.
- E. C. Randall, J. Bunch and H. J. Cooper, Anal. Chem., 2014, 86, 10504–10510 CrossRef CAS PubMed.
- R. L. Edwards, A. J. Creese, M. Baumert, P. Griffiths, J. Bunch and H. J. Cooper, Anal. Chem., 2011, 83, 2265–2270 CrossRef CAS PubMed.
- C. Stegemann, I. Drozdov, J. Shalhoub, J. Humphries, C. Ladroue, A. Didangelos, M. Baumert, M. Allen, A. H. Davies and C. Monaco, Circulation, 2011, 4, 232–242 CAS.
- N. J. Martin, J. Bunch and H. J. Cooper, J. Am. Soc. Mass Spectrom., 2013, 24, 1242–1249 CrossRef CAS PubMed.
- R. Edwards, P. Griffiths, J. Bunch and H. Cooper, J. Am. Soc. Mass Spectrom., 2012, 23, 1921–1930 CrossRef CAS PubMed.
- N. J. Martin, R. L. Griffiths, R. L. Edwards and H. J. Cooper, J. Am. Soc. Mass Spectrom., 2015, 26(8), 1320–1327 CrossRef CAS PubMed.
- J. M. Wiseman, C. A. Evans, C. L. Bowen and J. H. Kennedy, Analyst, 2010, 135, 720–725 RSC.
- E. Crawford, J. Gordon, J. T. Wu, B. Musselman, R. Liu and S. X. Yu, Bioanalysis, 2011, 3, 1217–1226 CrossRef CAS PubMed.
- C. Y. Wang, H. B. Zhu, Z. W. Cai, F. R. Song, Z. Q. Liu and S. Y. Liu, Anal. Bioanal. Chem., 2013, 405, 3159–3164 CrossRef CAS PubMed.
- N. E. Manicke, Q. A. Yang, H. Wang, S. Oradu, Z. Ouyang and R. G. Cooks, Int. J. Mass Spectrom., 2011, 300, 123–129 CrossRef CAS.
- N. E. Manicke, P. Abu-Rabie, N. Spooner, Z. Ouyang and R. G. Cooks, J. Am. Soc. Mass Spectrom., 2011, 22, 1501–1507 CrossRef CAS PubMed.
- Q. A. Yang, N. E. Manicke, H. Wang, C. Petucci, R. G. Cooks and Z. Ouyang, Anal. Bioanal. Chem., 2012, 404, 1389–1397 CrossRef CAS PubMed.
- R. L. Edwards, P. Griffiths, J. Bunch and H. J. Cooper, Proteomics, 2014, 14, 1232–1238 CrossRef CAS PubMed.
- W. H. Organization, WHO/NMH/NHD/MNM/11.1, 2014.
- J. Déglon, E. Lauer, A. Thomas, P. Mangin and C. Staub, Anal. Bioanal. Chem., 2010, 396, 2523–2532 CrossRef PubMed.
- B. L. Therrell, W. H. Hannon, K. A. Pass, F. Lorey, C. Brokopp, J. Eckman, M. Glass, R. Heidenreich, S. Kinney and S. Kling, Biochem. Mol. Med., 1996, 57, 116–124 CrossRef CAS PubMed.
- S. P. Parker and W. D. Cubitt, J. Clin. Pathol., 1999, 52, 633–639 CrossRef CAS PubMed.
- Y. Sandlers, A. B. Moser, W. C. Hubbard, L. E. Kratz, R. O. Jones and G. V. Raymond, Mol. Genet. Metab., 2012, 105, 416–420 CrossRef CAS PubMed.
- A. Koulman, P. Prentice, M. Y. Wong, L. Matthews, N. Bond, M. Eiden, J. Griffin and D. Dunger, Metabolomics, 2014, 10, 1018–1025 CrossRef CAS PubMed.
- A. Faller, B. Richter, M. Kluge, P. Koenig, H. Seitz, A. Thierauf, H. Gnann, M. Winkler, R. Mattern and G. Skopp, Anal. Bioanal. Chem., 2011, 401, 1163–1166 CrossRef CAS PubMed.
- J. Dénes, E. Szabó, S. L. Robinette, I. Szatmári, L. Szőnyi, J. G. Kreuder, E. W. Rauterberg and Z. Takáts, Anal. Chem., 2012, 84, 10113–10120 CrossRef PubMed.
- J. Sarsby, R. L. Griffiths, A. M. Race, J. Bunch, E. C. Randall, A. J. Creese and H. J. Cooper, Anal. Chem., 2015, 87(13), 6794–6800 CrossRef CAS PubMed.
- R. W. Purves and R. Guevremont, Anal. Chem., 1999, 71, 2346–2357 CrossRef CAS PubMed.
- R. Guevremont, J. Chromatogr., A, 2004, 1058, 3–19 CrossRef CAS PubMed.
- D. A. Barnett, B. Ells, R. Guevremont and R. W. Purves, J. Am. Soc. Mass Spectrom., 2002, 13, 1282–1291 CrossRef CAS PubMed.
- D. A. Barnett, B. Ells, R. Guevremont and R. W. Purves, J. Am. Soc. Mass Spectrom., 1999, 10, 1279–1284 CrossRef CAS.
- Y. Xuan, A. J. Creese, J. A. Horner and H. J. Cooper, Rapid Commun. Mass Spectrom., 2009, 23, 1963–1969 CrossRef CAS PubMed.
- M. C. Chambers, B. Maclean, R. Burke, D. Amodei, D. L. Ruderman, S. Neumann, L. Gatto, B. Fischer, B. Pratt, J. Egertson and K. Hoff, et al. , Nat. Biotechnol., 2012, 30, 918–920 CrossRef CAS PubMed.
- A. M. Race, I. B. Styles and J. Bunch, J. Proteomics, 2012, 75, 5111–5112 CrossRef CAS PubMed.
- E. Fahy, M. Sud, D. Cotter and S. Subramaniam, Nucleic Acids Res., 2007, 35, W606–W612 CrossRef PubMed.
- E. Fahy, S. Subramaniam, R. C. Murphy, M. Nishijima, C. R. H. Raetz, T. Shimizu, F. Spener, G. van Meer, M. J. O. Wakelam and E. A. Dennis, J. Lipid Res., 2009, 50, S9–S14 CrossRef PubMed.
- L. J. Brown, D. E. Toutoungi, N. A. Devenport, J. C. Reynolds, G. Kaur-Atwal, P. Boyle and C. S. Creaser, Anal. Chem., 2010, 82, 9827–9834 CrossRef CAS PubMed.
- T. J. Garrett, M. Merves and R. A. Yost, Int. J. Mass Spectrom., 2011, 308, 299–306 CrossRef CAS PubMed.
- R. D. Espy, N. E. Manicke, Z. Ouyang and R. G. Cooks, Analyst, 2012, 137, 2344–2349 RSC.
Footnote |
| † Electronic supplementary information (ESI) available. See DOI: 10.1039/c5an00933b |
| This journal is © The Royal Society of Chemistry 2015 |