 Open Access Article
Creative Commons Attribution 3.0 Unported Licence
Incorporation of a FRET dye pair into mesoporous materials: a comparison of fluorescence spectra, FRET activity and dye accessibility
Susanne
Widmer
ab,
Michael J.
Reber
c,
Patrick
Müller
c,
Catherine E.
Housecroft
b,
Edwin C.
Constable
b,
René M.
Rossi
a,
Dominik
Brühwiler
c,
Lukas J.
Scherer
a and
Luciano F.
Boesel
*a
aEmpa, Swiss Federal Laboratories for Material Science and Technology, Laboratory for Protection and Physiology, Lerchenfeldstr. 5, 9014 St. Gallen, Switzerland. E-mail: luciano.boesel@empa.ch; Fax: +41 58 765 7499; Tel: +41 58 765 7393
bDepartment of Chemistry, University of Basel, Spitalstrasse 51, 4056 Basel, Switzerland
cInstitute of Chemistry and Biological Chemistry, Zurich University of Applied Sciences (ZHAW), Einsiedlerstrasse 31, 8820 Wädenswil, Switzerland
First published on 15th June 2015
Abstract
Fluorescein and rhodamine B modified mesoporous silica particles were synthesized by post-grafting and co-condensation approaches. The materials exhibited different pore size distributions, particle shapes and sizes. The materials were characterized by nitrogen sorption, scanning electron microscopy and fluorescence spectroscopy. The Förster resonance energy transfer between the selected dye pair was explored for the different materials by exposure to various concentrations of gaseous ammonia. A logarithmic increase in rhodamine B emission with increasing ammonia concentration was observed for both post-grafted and co-condensed materials. The dye accessibility by ammonia gas in the silica framework of mesoporous materials was evaluated by using a flow cell gas sensor setup built in-house. Response to ammonia gas and recovery with nitrogen gas are explained by comparing the structure properties and dye loading of the materials. The post-grafted dye modified silica showed better performance in terms of reversibility and recovery.
1 Introduction
Mesoporous silica can be functionalized with organic functional groups, allowing this versatile material to be used in many applications, in particular the separation and adsorption of gaseous species. Recently, the potential of mesoporous silica in the field of luminescence sensing has been demonstrated.1–13Mesoporous silicates can be prepared by direct co-condensation, but grafting procedures are a convenient method for their functionalization. Postsynthetic functionalization is favored over co-condensation if the groups to be integrated are not sufficiently stable under the harsh conditions of mesoporous silica synthesis, or if more regular silicates with a narrower pore size distribution (PSD) are desired.14 One drawback of grafting is that the entire surface may not be accessible, which then leads to an inhomogeneous distribution with more grafted groups on the external surface and near the pore entrances.14–17 The solvent in which the postsynthetic functionalization is performed, as well as the type of organosilane used contribute to the final functional group distribution on the mesoporous material.17–19 A preferential coupling to the pore openings during the initial stage of the grafting procedure prevents the diffusion of further organosilanes into the center of the pores and can lead to a lower degree of functionalization.14,18 In contrast, co-condensation does not have the issue of inhomogeneous functional group distribution. Since organic groups are introduced during the synthesis of the material they tend to be distributed evenly throughout the entire framework. Moreover, pore blocking is not a problem, since the organic functionalities are integral components of the silica matrix.14 However, the organic moiety to be incorporated must withstand the synthesis conditions and high concentrations of these organic groups can have negative effects on the formation of the material (mesoscopic order, PSD, particle shape and size).14–16,20–22 One study concluded that the accessibility of co-condensed functionalized SBA-15 (Santa Barbara Amorphous 15) is diminished compared to postgrafted SBA-15.23 However, by subsequent coupling of the functional groups with organic residues, desired properties such as luminescence and sensing can be achieved for both materials.
Here we report the synthesis of fluorescein and rhodamine dye-modified mesoporous silica using postsynthetic and co-condensation methods. Fluorescein and rhodamine constitute an established dye pair that exhibits Förster resonance energy transfer (FRET), a phenomenon that describes the nonradiative transfer of energy between two chromophores under appropriate conditions.24 Additionally, the influence on the FRET activity was investigated for each material by immobilizing in a xerogel film and recording fluorescence spectra in the absence and presence of gaseous ammonia. Since the fluorescence quantum yield of fluorescein is increased at higher pH, the overlap between fluorescein emission and rhodamine absorption is enhanced in the presence of ammonia. The accessibility of the dyes to NH3 is discussed on the basis of gas sensor measurements in a gas flow cell optical sensor setup.
2 Experimental details
2.1 Synthesis of fluorescein/rhodamine modified SBA-15 particles
| Sample | FITC/RBITC [μmol] | APTES [mL] | EtOH [mL] |
|---|---|---|---|
| a Sample denomination: CoCo: co-condensed; SBA: mesoporous material; F: fluorescein; R: rhodamine; HD: high dye loading; LD: low dye loading. | |||
| CoCo SBA FR HD | 19/20 | 0.01 | 1 |
| CoCo SBA FR LD | 19/20 | 1 | 10 |
P123 and KCl (Fluka) were dissolved in deionized H2O and HCl (32%; Aldrich). Then 1,3,5-trimethylbenzene (TMB; Aldrich) was added. After stirring for 2 h in ethanol, TEOS (Fluka) and the corresponding amount of APTES-dye in ethanol were added. The amounts of the different reaction components used for the syntheses are given in Table 2. The mixtures were stirred for 30 min before being transferred to a Teflon-lined autoclave and kept at 60 °C for 4 h. The products were collected by filtration, washed with deionized H2O (50 mL), and dried at 120 °C for 20 min. The structure directing agent was removed by Soxhlet extraction in ethanol and co-condensed mesoporous materials, CoCo SBA FR HD/LD, were obtained.
| Sample | P123 [g] | KCl [g] | H2O [mL] | HCl [g] | TMB [g] | TEOS [mL] | APTES-dye [μL] |
|---|---|---|---|---|---|---|---|
| CoCo SBA FR HD | 0.5 | 0.76 | 15 | 3.0 | 0.38 | 1.1 | 150 |
| CoCo SBA FR LD | 1.0 | 1.5 | 30 | 5.9 | 0.76 | 2.3 | 250 |
2.2 Thin film preparation
2.3 Characterization methods
![[thin space (1/6-em)]](https://www.rsc.org/images/entities/char_2009.gif) 000 M−1 cm−1) and RBITC (ε = 37
000 M−1 cm−1) and RBITC (ε = 37![[thin space (1/6-em)]](https://www.rsc.org/images/entities/char_2009.gif) 700 M−1 cm−1) in 0.2 M NaOH were obtained with a standard deviation of 6% from four stock solutions prepared as follows: (1) FITC and RBITC were stirred separately in 0.2 M NaOH until complete dissolution. (2) FITC and RBITC were combined in a molar ratio of 1
700 M−1 cm−1) in 0.2 M NaOH were obtained with a standard deviation of 6% from four stock solutions prepared as follows: (1) FITC and RBITC were stirred separately in 0.2 M NaOH until complete dissolution. (2) FITC and RBITC were combined in a molar ratio of 1![[thin space (1/6-em)]](https://www.rsc.org/images/entities/char_2009.gif) :
:![[thin space (1/6-em)]](https://www.rsc.org/images/entities/char_2009.gif) 1 in 0.2 M NaOH and stirred until complete dissolution. (3) FITC and RBITC were stirred separately in ethanol until complete dissolution. A corresponding amount of APTES was added and the reaction mixture was stirred for 16 h. After evaporation of the solvent, the residue was dissolved in 0.2 M NaOH. (4) FITC and RBITC were combined in a molar ratio of 1
1 in 0.2 M NaOH and stirred until complete dissolution. (3) FITC and RBITC were stirred separately in ethanol until complete dissolution. A corresponding amount of APTES was added and the reaction mixture was stirred for 16 h. After evaporation of the solvent, the residue was dissolved in 0.2 M NaOH. (4) FITC and RBITC were combined in a molar ratio of 1![[thin space (1/6-em)]](https://www.rsc.org/images/entities/char_2009.gif) :
:![[thin space (1/6-em)]](https://www.rsc.org/images/entities/char_2009.gif) 1 in ethanol until complete dissolution. Subsequent treatment was as with (3). The addition of mesoporous silica to the dilution series showed no significant effect on the extinction coefficient.
1 in ethanol until complete dissolution. Subsequent treatment was as with (3). The addition of mesoporous silica to the dilution series showed no significant effect on the extinction coefficient.
2.4 Gas sensor measurements
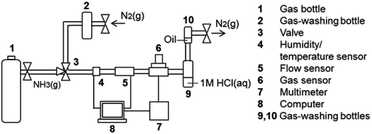 | ||
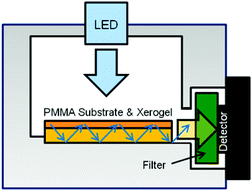
| Fig. 1 Flow cell gas sensor setup.29 | ||
3 Results and discussion
3.1 Comparison of structure properties
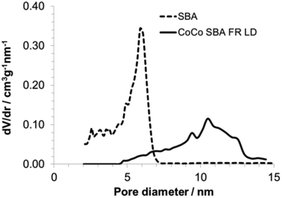
The morphology of the SBAs was examined using SEM (Fig. 3). Purely siliceous SBA particles were spherical (Fig. 3c) with a diameter in the range of 4–12 μm. The relatively narrow PSD is typical for SBA that has a small tail extending in to the microporous range (Fig. 4).35 The average pore size was 6 nm (Table 3). Labeling did not influence the morphology of the SBA (Fig. 3d). The CoCo SBA FR LD, synthesized with low APTES-dye concentrations, produced well-shaped spherical particles with similar diameters between 2 and 4 μm (Fig. 3b). However, CoCo SBA FR LD showed a broad PSD with a width at half maximum of about 9 nm and a pore size of about 10 nm (Fig. 4). The increase and broadening in pore size results from the increased concentration of organics in the mother liquid. These organic molecules dissolve in the organic phase inside of the structure-directing agent leading to an expansion of the micelles. CoCo SBA FR HD particles were irregular (Fig. 3a). The PSD is also very broad and undefined, indicative of a poor long range ordering of the material. High concentrations of organics in the synthesis mixture, in this case TMB and higher amount APTES-dye, have a large effect on the particle morphology and PSD.36 The initial material for all post-grafted materials was SBA with a pore size of around 6 nm (Table 3). The amount of grafted organic moieties increased from samples SBA-NH2 1–4 to PG SBA FR 1–4, but the pore sizes showed negligible changes, since the introduced amount of dye is in the nanomolar range per mg of silica and the distribution of the grafted APTES molecules is non-uniform.14,37 The extent of organic modification is possibly too low for an unambiguous effect on the pore size, but sufficient enough to affect the pore volumes and BET surface areas, which show a decreasing trend with increasing amount of grafted molecules (Table 3).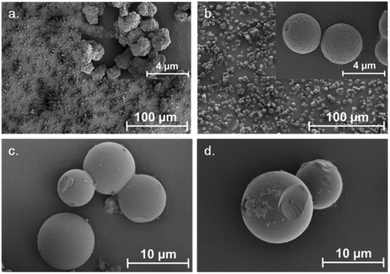 | ||
| Fig. 3 SEM illustrations of synthesized particles: (a) CoCo SBA FR HD, (b) CoCo SBA FR LD, (c) SBA, (d) PG SBA FR 1. | ||
| Sample | d NLDFT [nm] | S BET [m2 g−1] | V tot [cm3 g−1] |
|---|---|---|---|
| a Average pore diameter of the mesopores. | |||
| CoCo SBA FR HD | 7 | 228 | 0.39 |
| CoCo SBA FR LD | 10 | 215 | 0.47 |
| SBA-15 | 6 | 801 | 0.79 |
| SBA-NH2 1 | 6 | 755 | 0.79 |
| SBA-NH2 2 | 6 | 587 | 0.70 |
| SBA-NH2 3 | 6 | 505 | 0.61 |
| SBA-NH2 4 | 6 | 436 | 0.56 |
| PG SBA FR 1 | 6 | 753 | 0.77 |
| PG SBA FR 2 | 6 | 515 | 0.59 |
| PG SBA FR 3 | 6 | 329 | 0.42 |
| PG SBA FR 4 | 6 | 292 | 0.35 |
3.2 Comparison in dye content
Table 4 lists the amounts of dyes detected on the different SBA samples. The resulting dye ratios were similar in both CoCo materials, as well as in the PG materials, indicating same coupling behavior. In all cases, FITC is more likely to be integrated into the material than RBITC. A possible explanation of this is the larger steric hindrance of RBITC due to its two additional ethyl groups on each site of the xanthene structure making the entry into the pores more difficult, especially if the pores are partially blocked by already coupled dyes. Furthermore, rhodamine B dyes are reported to preferentially form dimers and trimers in concentrated ethanol solutions38 leading to an impeded diffusion of the dye aggregates into the mesopores and probably also to aggravated coupling to the amino groups because of the restricted dye mobility. A higher dye aggregation tendency can be expected in the reaction mixture for the dye labeling of PG SBA R 1, because of the high dye concentration and the fact that there is no other type of dye molecules disturbing the aggregation process. This can be the reason for the comparably lower RBITC coupling yield for PG SBA R 1. Another reason for the reduced RBITC coupling may be the ability to form hydrogen bonds with the hydroxyl-groups of the silica surface. By forming hydrogen bonds with the silica surface, FITC is relatively fixed, promoting the reaction with surface bound amino groups. The given yields of coupled dyes for CoCo SBAs are related to the initial dye amount introduced into the synthesis (Table 2). The yields for PG SBAs correspond to the dye amount coupled assuming a 100% yield in post-synthetic amino-functionalization. For fluorescein and rhodamine modified PG SBAs, the coupling to 50% of the amino groups was considered as 100% yield for each dye. With exception of the FITC yield of CoCo SBA FR HD, all yields were found to be below 20%. The low coupling yield for the CoCo material can be explained by only a fraction of APTES coupled to the dyes, resulting in less dye incorporation during the synthesis and some dye being washed out or degraded during Soxhlet extraction to remove the template.| Sample | FITC [nmol mg−1] | RBITC [nmol mg−1] | Ratio FITC/RBITC | Yield FITC [%] | Yield RBITC [%] |
|---|---|---|---|---|---|
a Values are given with 6% deviation (εFITC: 76![[thin space (1/6-em)]](https://www.rsc.org/images/entities/char_2009.gif) 000 L mol−1 cm−1, εRBITC: 37 000 L mol−1 cm−1, εRBITC: 37![[thin space (1/6-em)]](https://www.rsc.org/images/entities/char_2009.gif) 700 L mol−1 cm−1). The coupling yields are related to the initial dye amounts introduced during synthesis. 700 L mol−1 cm−1). The coupling yields are related to the initial dye amounts introduced during synthesis.
|
|||||
| CoCo SBA FR HD | 5.9 ± 0.4 | 2.2 ± 0.1 | 1![[thin space (1/6-em)]](https://www.rsc.org/images/entities/char_2009.gif) : :![[thin space (1/6-em)]](https://www.rsc.org/images/entities/char_2009.gif) 0.4 0.4 |
46 | 16 |
| CoCo SBA FR LD | 0.35 ± 0.03 | 0.17 ± 0.01 | 1![[thin space (1/6-em)]](https://www.rsc.org/images/entities/char_2009.gif) : :![[thin space (1/6-em)]](https://www.rsc.org/images/entities/char_2009.gif) 0.5 0.5 |
16 | 9 |
| PG SBA F 1 | 4.6 ± 0.3 | 5 | |||
| PG SBA R 1 | 0.35 ± 0.02 | 0.4 | |||
| PG SBA FR 1 | 2.6 ± 0.2 | 1.9 ± 0.1 | 1![[thin space (1/6-em)]](https://www.rsc.org/images/entities/char_2009.gif) : :![[thin space (1/6-em)]](https://www.rsc.org/images/entities/char_2009.gif) 0.7 0.7 |
5 | 4 |
| PG SBA FR 2 | 8.0 ± 0.5 | 5.0 ± 0.3 | 1![[thin space (1/6-em)]](https://www.rsc.org/images/entities/char_2009.gif) : :![[thin space (1/6-em)]](https://www.rsc.org/images/entities/char_2009.gif) 0.7 0.7 |
16 | 11 |
| PG SBA FR 3 | 16 ± 1 | 9.1 ± 0.6 | 1![[thin space (1/6-em)]](https://www.rsc.org/images/entities/char_2009.gif) : :![[thin space (1/6-em)]](https://www.rsc.org/images/entities/char_2009.gif) 0.6 0.6 |
16 | 10 |
| PG SBA FR 4 | 28 ± 2 | 18 ± 2 | 1![[thin space (1/6-em)]](https://www.rsc.org/images/entities/char_2009.gif) : :![[thin space (1/6-em)]](https://www.rsc.org/images/entities/char_2009.gif) 0.6 0.6 |
14 | 8 |
Comparing CoCo SBA FR HD and CoCo SBA FR LD, the dye concentration was higher in CoCo SBA FR HD which leads to a higher amount of FITC-APTES and RBITC-APTES during the SBA synthesis. Furthermore, the APTES concentration was higher in the CoCo SBA FR LD synthesis which influences the co-condensation, since more free APTES is available. The free APTES possibly competes with APTES dye during incorporation into the silica network, leading to the observed lower coupling yield in CoCo SBA FR LD.
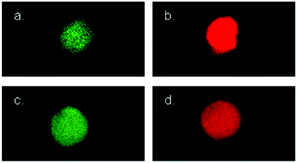
The postsynthetic amino-functionalization was most likely <100% leading to underestimated coupling yields for the PG materials. Furthermore, pore blocking from already coupled dyes or the presence of micropores can reduce the accessibility of the amino groups.39 More material was needed to synthesize the PG SBA F/R and PG SBA FR 1 samples, therefore SBA-NH2 1 was made in a large batch to ensure that enough material was present for multiple reactions. In a larger batch the grafting procedure tended to produce less amino-functionalized SBAs as can be concluded by comparing PG SBA F/R 1, PG SBA FR 1 and PG SBA FR 2. For equal batches the amount of dye labeling could be measurably tuned by varying the amount of APTES during the synthesis as seen for the samples PG SBA FR 2–4 (Table 4). Hence, the amount of dyes on the mesoporous silica can be tuned by increasing the APTES-dye concentration in the synthesis or by enhancing the postsynthetic amino-functionalization. CLSM measurements show homogenous distributions for FITC as well as RBITC dyes in all SBAs (Fig. 5).
3.3 FRET mechanism explained on the basis of NH3 response
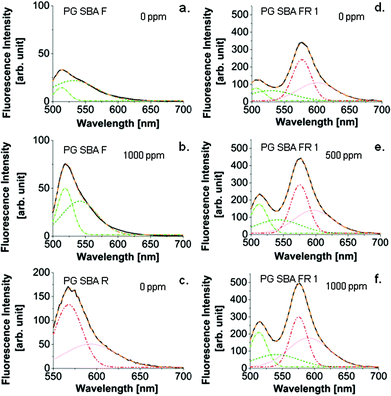
Depending on the ambient pH value, fluorescein exists in cationic, neutral, monoanionic or dianionic forms or as a mixture thereof.48 Absorption as well as emission spectra are dependent on the presence of species in different protonation states.48 The acid dissociation constants in solution reported for fluorescein are in the range of pKcationic = 2.00–2.25, pKneutral = 4.23–4.4 and pKmonoanionic = 6.31–6.7, depending on the specific conditions and measurement techniques.48–50 Rhodamine B can be present in a few different species under extreme conditions51 but only the cationic and zwitterionic forms are fluorescent. The pKa of the cationic form in solution is in the range of 3.22–4.2, depending on the specific conditions and measurement techniques.51–54 For spectral investigation of the SBAs, the particles were immobilized in a transparent organic modified xerogel film the properties of which have already been reported.29 The emission spectrum of PG SBA F 1 shows an emission band at 515 nm and a shoulder at 542 nm, indicating the presence of at least two emittive species, which are assigned to the monoanionic and dianionic forms respectively (Fig. 6). Exposure to NH3 leads to deprotonation of the monoanionic species forming more dianionic species, which results in an enhancement of its fluorescence. The higher intensity of emission scales to an increase of the quantum yield (Φ = 0.93) and the high molar absorptivity of the dianionic fluorescein form.48 The absorption spectrum of rhodamine has a peak at 553 nm and a shoulder around 535 nm, which suggests the presence of both fluorescent rhodamine species (Fig. 6). The increase in fluorescein emission upon ammonia exposure leads to a larger overlap of fluorescein emission and rhodamine absorption that results in enhanced FRET efficiency and thus increased rhodamine emission (Fig. 7 and 8).
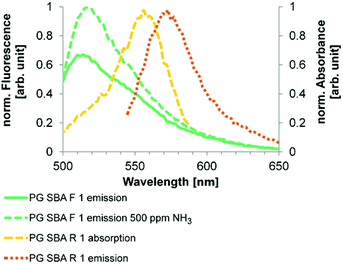 | ||
| Fig. 6 Emission and absorption spectra of investigated FRET dye pair on SBA particles immobilized in the unlabeled xerogel. The spectral overlap is increasing with increasing formation of fluorescein dianion. Excitation wavelengths: 484 nm (F) and 535 nm (R). The emission of rhodamine B (573 nm) is red-shifted when present in a FRET-system to 595 nm (see Fig. 7). | ||
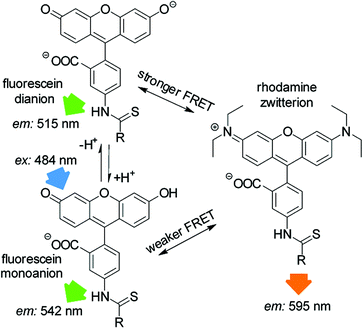 | ||
| Fig. 7 FRET mechanism between fluorescein and rhodamine. R = coupling to amino-functionalized silica. | ||
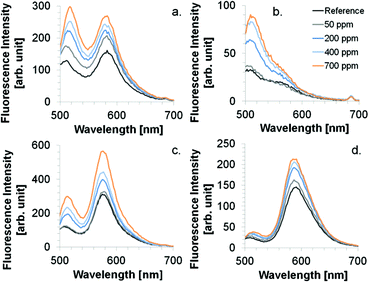 | ||
Fig. 8 Spectral behavior upon NH3 exposure. Coatings: (a) CoCo SBA FR HD, (b) CoCo SBA FR LD, (c) PG SBA FR 1, (d) FITC/RBITC (ratio 4![[thin space (1/6-em)]](https://www.rsc.org/images/entities/char_2009.gif) : :![[thin space (1/6-em)]](https://www.rsc.org/images/entities/char_2009.gif) 1) modified xerogel film. Excitation wavelength was 484 nm. 1) modified xerogel film. Excitation wavelength was 484 nm. | ||
The wavelength range of the emission bands is comparable for CoCo SBA FR HD and PG SBA FR 1 coatings (Fig. 8a and c). Although, the PG material was found to have less dye content, the fluorescein emission intensity is similar to the CoCo material and rhodamine emission intensity even higher. This observation leads to the conclusion that the high dye loading in the co-condensed material leads to fluorescence quenching. The more intense rhodamine emission in the PG material is based on the determined fluorescein/rhodamine proportion in the materials, being higher for the PG material. CoCo SBA FR LD coatings exhibit comparable low rhodamine emission intensity due to less dye incorporation and the emission band is more blue shifted in comparison to the SBA with higher dye loadings (Fig. 8b). Fig. 8d shows the emission spectra of a FITC and RBITC modified xerogel film. The fluorescence intensity (arb. unit) scale cannot be compared with a, b and c. Detector adjustments were carried out since the measurement under the identical set-up conditions resulted in an overflow of fluorescence intensity. Fig. 9 illustrates the spectral response to NH3 by the increase of rhodamine maximum fluorescence emission at ca. 580 nm which was similar for the CoCo SBA FR HD and PG SBA FR 1 coatings. The exposure to 1000 ppm of gaseous NH3 led to a ca. 1.5-fold increase of the rhodamine fluorescence intensity. PG SBA FR 2–4 did not respond to NH3 with an increase of rhodamine fluorescence emission. This observation indicates that higher dye amounts are not necessarily beneficial for this FRET system. A closer look at the fluorescence spectra of the PG SBA FR 3 coating reveals that the fluorescein emission intensity decreased and the rhodamine fluorescence emission intensity remained unchanged although the total dye amount was 5 times higher in comparison to PG SBA FR 1. The larger dye amount probably led on one hand to an enhanced FRET activity because of the higher amount of dye pairs but on the other hand to more fluorescence quenching due to the high dye density on the particles as observed for the co-condensed material. The CoCo SBA FR LD coating shows a better response towards ammonia for concentrations above 400 ppm. However, the rhodamine emission is low in comparison to the more intense fluorescein emission and in addition is close to the fluorescein emission band. Therefore, the increasing intensity of the fluorescein fluorescence emission tail may contribute to the increase of rhodamine fluorescence emission intensity and lead to overestimation of the ammonia response. The contribution of fluorescein fluorescence emission in PG SBA FR 1 was evaluated by fitting Gaussians and is discussed later in this section. The response of the xerogel films with dye ratios of 1![[thin space (1/6-em)]](https://www.rsc.org/images/entities/char_2009.gif) :
:![[thin space (1/6-em)]](https://www.rsc.org/images/entities/char_2009.gif) 1, 4
1, 4![[thin space (1/6-em)]](https://www.rsc.org/images/entities/char_2009.gif) :
:![[thin space (1/6-em)]](https://www.rsc.org/images/entities/char_2009.gif) 1 and 8
1 and 8![[thin space (1/6-em)]](https://www.rsc.org/images/entities/char_2009.gif) :
:![[thin space (1/6-em)]](https://www.rsc.org/images/entities/char_2009.gif) 1 was similar and also comparable to the particle coatings within standard deviations. This data shows that a higher ratio of donor/acceptor did not lead to a higher FRET efficiency, so that the relative response was independent of the ratio. Since higher amount of dyes can be integrated into the xerogel films, the range of ammonia concentration, that can be sensed, is extended. Fluorescence quenching for particle coatings occurred at concentrations between 1000–2500 ppm and for xerogel films between 10
1 was similar and also comparable to the particle coatings within standard deviations. This data shows that a higher ratio of donor/acceptor did not lead to a higher FRET efficiency, so that the relative response was independent of the ratio. Since higher amount of dyes can be integrated into the xerogel films, the range of ammonia concentration, that can be sensed, is extended. Fluorescence quenching for particle coatings occurred at concentrations between 1000–2500 ppm and for xerogel films between 10![[thin space (1/6-em)]](https://www.rsc.org/images/entities/char_2009.gif) 000–40
000–40![[thin space (1/6-em)]](https://www.rsc.org/images/entities/char_2009.gif) 000 ppm. All coatings show logarithmic behavior in NH3 response. Coatings with only rhodamine labeled particles (PG SBA R 1, excited at 535 nm) and RBITC modified xerogel responded to NH3 with a slight decrease in fluorescence emission intensity which can be explained by either the continuous deprotonation of the cationic species forming more zwitterionic species which results in decreased fluorescence emission intensity at 576 nm (Fig. 10c) or by reabsorption of rhodamine emission. This could also be another explanation for the decreasing intensity of rhodamine fluorescence emission for the PG SBA FR 2–4 coatings. Coatings with only FITC labeled particles (PG SBA F 1) responded logarithmically between 0–1000 ppm. A FITC modified xerogel responded linearly only from 200–1000 ppm.
000 ppm. All coatings show logarithmic behavior in NH3 response. Coatings with only rhodamine labeled particles (PG SBA R 1, excited at 535 nm) and RBITC modified xerogel responded to NH3 with a slight decrease in fluorescence emission intensity which can be explained by either the continuous deprotonation of the cationic species forming more zwitterionic species which results in decreased fluorescence emission intensity at 576 nm (Fig. 10c) or by reabsorption of rhodamine emission. This could also be another explanation for the decreasing intensity of rhodamine fluorescence emission for the PG SBA FR 2–4 coatings. Coatings with only FITC labeled particles (PG SBA F 1) responded logarithmically between 0–1000 ppm. A FITC modified xerogel responded linearly only from 200–1000 ppm.
Taking the calculated BET surface from Table 3, the amount of dye in a defined FRET sphere, with radius r = 5 nm, can be determined (Table 5). According to these results, less than one dye molecule is present in the required FRET distance of 10 nm. Since energy transfer is taking place, we suggest that the dye distribution is macroscopically homogenous as observed by CLSM. However, the dyes can be inhomogeneously distributed in a single hexagonal pore leading to irregular dye–dye distances and locally varying dye concentrations.
| Sample | FITC | RBITC |
|---|---|---|
| CoCo SBA FR HD | 1.23 | 0.46 |
| CoCo SBA FR LD | 0.08 | 0.04 |
| PG SBA F | 0.4 | |
| PG SBA R | 0.04 | |
| PG SBA FR 1 | 0.16 | 0.12 |
| PG SBA FR 2 | 0.74 | 0.46 |
| PG SBA FR 3 | 2.31 | 1.48 |
| PG SBA FR 4 | 4.56 | 2.93 |
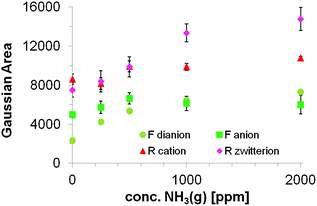
Fig. 11 illustrates the trend in peak surface area received from the Gaussian evaluation on the fluorescence spectra of PG SBA FR 1 obtained upon exposure to 0, 250, 500, 1000 and 2000 ppm NH3. With increasing NH3 concentration, more fluorescein dianions are formed from further deprotonation of the fluorescein monoanions which is reflected in the increasing area of the corresponding Gaussian band located at ca. 512 nm. The maximum peak wavelength is red shifted with higher NH3 concentrations from 507 to 514 nm. The fluorescein monoanion band increases from 0–500 ppm and starts to decrease when exposed to concentrations above 500 ppm. This observation suggests the presence of neutral species, which are deprotonated forming more monoanionic species. At the same time, deprotonation of mono- to dianonic species occurs. Above 500 ppm, every remaining neutral fluorescein species has been deprotonated and consequently no more monoanions can be formed resulting in deprotonation of only fluorescein monoanions and hence to the decrease in the peak surface area of the fluorescein monoanion. The maximum peak wavelengths show a significant red shift from 529 to 542 nm between 0 and 250 ppm NH3. Subsequent increases in the NH3 concentration do not lead to a further red shift.
Both the rhodamine cation band located at 576 nm and the rhodamine zwitterion band located at ca. 590 nm, increase with increasing NH3 concentration. Interestingly, the increase of the zwitterionic band occurs in a much higher extent (1.78 times) in comparison to the cationic band (1.15 times) and the maximum peak wavelength exhibits a blue shift of 10 nm. This indicates that the energy transfer from fluorescein to the zwitterionic form of rhodamine is preferred, assuming that no significant amount of rhodamine cation is converted to zwitterion due to the NH3 exposure. The increase of both cationic and zwitterionic emissions of the rhodamine Gaussians is consistent with the energy transfer. Furthermore, only the fluorescein monoanion fluorescence emission can contribute to the rhodamine emission intensity because of its long emission tail. The fact that the Gaussian area of the fluorescein monoanionic species is decreasing with increasing NH3 concentration supports the energy transfer model.
In order to investigate the dye accessibility of the coatings by the NH3 gas, experiments were performed using the device shown schematically in Fig. 1. The gas flow was switched between a NH3/N2 gas mixture and pure N2. When ammonia gas was introduced, it diffused into the xerogel film where deprotonation of the fluorescein dyes occurred, leading to the increase in rhodamine fluorescence emission. The dyes in the coatings were excited at 470 nm from the top of the gas sensor (Fig. 2). The PMMA substrate acted as a waveguide and the fluorescence intensity was thus monitored at the edge perpendicular to the irradiation. The long pass filter only allowed light of wavelengths from 550 nm to pass to the phototransistor. Thus, the change in fluorescence from 490 to 550 nm upon fluorescein deprotonation–protonation was not monitored. To reduce cross-sensitivity or cooling with humidified air, care was taken, that during switching the gases, the humidity did not exceed 4%. A measurement always started by purging the setup with gaseous N2, which acted simultaneously as the reference gas and carrier gas. After 10 minutes, this valve was closed and the valve for purging with NH3 gas was opened until the signal reached the maximum sensor response. The baseline was recovered by closing the NH3-line and re-opening the N2-line.
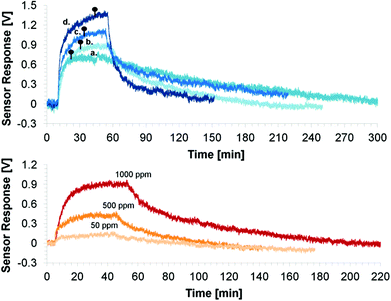
The top graph of Fig. 13 depicts the sensor response for the different coatings towards 1000 ppm NH3. A similar response and change in rhodamine fluorescence intensity due to the energy transfer was obtained for the CoCo SBA FR HD and PG SBA FR 1 (Fig. 13, top, responses a and b) coatings in accordance with the above spectral investigations (Fig. 8). Because of the larger pore size and different morphology, the response time was slightly faster for the co-condensed material, due to the faster diffusion of NH3 into the coating. However, the co-condensed SBA had a much longer recovery time than the post-grafted SBA. It is reported that co-condensed mesoporous materials have a higher number of free hydroxyl groups on the surface due to the extraction of the template rather than calcination of the post-grafted materials.58 Therefore, a possible reason for the lower recovery can be that the NH3 gas is more strongly adsorbed by the co-condensed material by forming more hydrogen bonds with the free surface hydroxyl groups. In addition, the free silanol (SiOH) groups of the silica framework can be deprotonated by the basic NH3 gas resulting in NH4+ and SiO− leading to electrostatic NH3 adsorption on the silica surface. Better responses were obtained for the 4![[thin space (1/6-em)]](https://www.rsc.org/images/entities/char_2009.gif) :
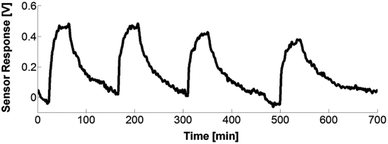
:![[thin space (1/6-em)]](https://www.rsc.org/images/entities/char_2009.gif) 1 FITC/RBITC xerogel (Fig. 13, top, response d). Since the xerogel is very smooth, the NH3 gas permeability is reduced, leading to the longer response time. The incorporation of unlabeled SBA into the xerogel coating did not lead to faster response and recovery times (Fig. 13, top, response c), as expected from the introduced porosity coming from the mesoporous particles. The exposure of the PG SBA FR 1 coating to different NH3 gas concentrations led to different sensor responses (Fig. 13, bottom). The lowest detectable amount of ammonia with this setup was 10 ppm. Cyclic measurements with the PG SBA FR 1 coating (Fig. 14) demonstrate the reversibility of this coating by exhibiting the same loss and recovery in signal intensity in each cycle. The sensor response of the CoCo SBA FR HD coating was not reproducible since the long recovery time is subjected to thermal drift (electronic). This observation shows again the significance of the NH3 adsorption on the silica surface. The signal response can be reproduced when warming the coating to 70 °C for 2 h.
1 FITC/RBITC xerogel (Fig. 13, top, response d). Since the xerogel is very smooth, the NH3 gas permeability is reduced, leading to the longer response time. The incorporation of unlabeled SBA into the xerogel coating did not lead to faster response and recovery times (Fig. 13, top, response c), as expected from the introduced porosity coming from the mesoporous particles. The exposure of the PG SBA FR 1 coating to different NH3 gas concentrations led to different sensor responses (Fig. 13, bottom). The lowest detectable amount of ammonia with this setup was 10 ppm. Cyclic measurements with the PG SBA FR 1 coating (Fig. 14) demonstrate the reversibility of this coating by exhibiting the same loss and recovery in signal intensity in each cycle. The sensor response of the CoCo SBA FR HD coating was not reproducible since the long recovery time is subjected to thermal drift (electronic). This observation shows again the significance of the NH3 adsorption on the silica surface. The signal response can be reproduced when warming the coating to 70 °C for 2 h.
4 Conclusion
The FRET activity of FITC and RBITC modified mesoporous SBAs has been studied by observing the change in RBITC fluorescence emission intensity when exposing the particles, immobilized into transparent xerogel coatings, to different NH3 gas concentrations. Large dye loadings on the SBA lead to fluorescence quenching and hence to an inoperative FRET system. The impact of the different structural properties of co-condensed and post-grafted materials was investigated with a flow cell optical gas sensor setup built in-house. The response time was dependent on the structure of the immobilized SBA material, whereas the recovery time was strongly dependent on the surface properties of the material. The ability to adsorb the NH3 molecules on the silica surface determines whether the particle coatings can be applied for reproducible and fully reversible sensor applications.Acknowledgements
The authors gratefully acknowledge the financial support of Swiss National Science Foundation (SNF 140303). Special thanks go to our workshop team, L. Missaggia and M. Schmid for the sensor design and optimization of the electronics.Notes and references
- B. Lei, H. Zhang, S. Lu, Z. Zheng, W. Li and Y. Wang, Adv. Funct. Mater., 2006, 16, 1883–1891 CrossRef CAS PubMed.
- H. Zhang, Y. Sun, K. Ye, P. Zhang and Y. Wang, J. Mater. Chem., 2005, 15, 3181–3186 RSC.
- X. Xu and H. Xiao, J. Lumin., 2012, 132, 2251–2258 CrossRef CAS PubMed.
- X. Wu, L. Song, B. Li and Y. Liu, J. Lumin., 2010, 130, 374–379 CrossRef CAS PubMed; L.-L. Li, H. Sun, C.-J. Fang, J. Xu, J.-Y. Jin and C.-H. Yan, J. Mater. Chem., 2007, 17, 4492–4498 RSC.
- R. Métivier, I. Leray, B. Lebeau and B. Valeur, J. Mater. Chem., 2005, 15, 2965–2973 RSC.
- K. Kledzik, M. Orlowska, D. Patralska, M. Gwiazda, J. Jezierska, S. Pikus, R. Ostaszewski and A. M. Klonkowski, Appl. Surf. Sci., 2007, 2, 441–451 CrossRef PubMed.
- L. Gao, Y. Wang, J. Wang, L. Huang, L. Shi, X. Fan, Z. Zou, T. Yu, M. Zhu and Z. Li, Inorg. Chem., 2006, 45, 6844–6850 CrossRef CAS PubMed.
- B. Xiao, J. Zhao, X. Liu, P. Wang and Q. Yang, Microporous Mesoporous Mater., 2014, 199, 1–6 CrossRef CAS PubMed.
- W. Jingxia, J. Lumin., 2014, 151, 41–46 CrossRef PubMed.
- B. Wang, L. Zhang, B. Li, Y. Li, Y. Shi and T. Shi, Sens. Actuators, B, 2014, 190, 93–100 CrossRef CAS PubMed.
- Z. Dong, X. Tian, Y. Chen, J. Hou and J. Ma, RSC Adv., 2013, 3, 2227–2233 RSC.
- M. H. Lee, S. J. Lee, J. H. Jung, H. Lim and J. S. Kim, Tetrahedron, 2007, 12087–12092 CrossRef CAS PubMed.
- H. Zhang, P. Zhang, K. Ye, Y. Sun, S. Jiang, Y. Wang and W. Pang, J. Lumin., 2006, 117, 68–74 CrossRef CAS PubMed.
- F. Hoffmann, M. Cornelius, J. Morell and M. Fröba, Angew. Chem., Int. Ed., 2006, 45, 3216–3251 CrossRef CAS PubMed.
- T. Yokoi, H. Yoshitake and T. Tatsumi, J. Mater. Chem., 2004, 14, 951–957 RSC.
- H. H. Lim and A. Stein, Chem. Mater., 1999, 11, 3285–3295 CrossRef.
- D. Brühwiler, Nanoscale, 2010, 2, 887–892 RSC.
- N. Gartmann and D. Brühwiler, Angew. Chem., Int. Ed., 2009, 48, 6354–6356 CrossRef CAS PubMed.
- N. Gartmann, C. Schütze, H. Ritter and D. Brühwiler, J. Phys. Chem. Lett., 2010, 1, 379–382 CrossRef CAS.
- S. Huh, J. W. Wiench, B. G. Trewyn, S. Song, M. Pruski and V. S.-Y. Lin, Chem. Commun., 2003, 2364–2365 RSC.
- K. Möller, J. Kobler and T. Bein, J. Mater. Chem., 2006, 17, 624–631 RSC.
- F. O. M. Gaslain, C. Delacôte, A. Walcarius and B. Lebeau, J. Sol-Gel Sci. Technol., 2009, 49, 112–124 CrossRef CAS PubMed.
- J. M. Rosenholm and M. Lindén, Chem. Mater., 2007, 19, 5023–5034 CrossRef CAS.
- J. R. Lakowicz, in Principles of Fluorescence Spectroscopy, Springer, New York, 3rd edn, 2010, pp. 445–453 Search PubMed.
- Y. Ma, L. Qi, J. Ma, Y. Wu, O. Liu and H. Cheng, Colloids Surf., A, 2003, 229, 1–8 CrossRef CAS PubMed.
- A. Katiyar and N. G. Pinto, Small, 2006, 2, 644–648 CrossRef CAS PubMed.
- L. Wang, T. Qi, Y. Zhang and J. Chu, Microporous Mesoporous Mater., 2006, 91, 156–160 CrossRef CAS PubMed.
- J. Lei, L. Wang and J. Zhang, Chem. Commun., 2010, 46, 8445–8447 RSC.
- S. Widmer, M. Dorrestijn, A. Camerlo, S. K. Urek, A. Lobnik, C. E. Housecroft, E. C. Constable and L. J. Scherer, Analyst, 2014, 139, 4335–4342 RSC.
- E. P. Perman, J. Chem. Soc., 1901, 79, 718–725 RSC.
- E. P. Perman, J. Chem. Soc., 1903, 83, 1168–1184 RSC.
- S. Brunauer, P. H. Emmett and E. Teller, J. Am. Chem. Soc., 1938, 60, 309–319 CrossRef CAS.
- J. Landers, G. Y. Gor and A. V. Neimark, Colloids Surf., A, 2013, 437, 3–32 CrossRef CAS PubMed.
- M. Kruk, M. Jaroniec, R. Ryoo and J. M. Kim, Microporous Mater., 1997, 12, 93–106 CrossRef CAS.
- P. I. Ravikovitch and A. V. Neimark, J. Phys. Chem. B, 2001, 105, 6817–6823 CrossRef CAS.
- Q. Huo, D. I. Margolese, U. CIesla, D. G. Demuth, P. Feng, T. E. Gier, P. Sieger, A. Firouzi and B. F. Chmelka, Chem. Mater., 1994, 6, 1176–1191 CrossRef CAS.
- N. Gartmann and D. Brühwiler, Materials, 2011, 4, 1096–1103 CrossRef CAS PubMed.
- F. López Arbeloa, P. Ruiz Ojeda and I. López Arbeloa, J. Lumin., 1989, 44, 105–112 CrossRef.
- H. Ritter and D. Brühwiler, J. Phys. Chem. C, 2009, 113, 10667–10674 CAS.
- L. Peng, X. Yang, L. Yuan, L. Wang, E. Zhao, F. Tian and Y. Liu, Opt. Commun., 2011, 284, 4810–4814 CrossRef CAS PubMed.
- A. Persad, K.-F. Chow, W. Wang, E. Wang, A. Okafor, N. Jespersen, J. Mann and A. Bocarsly, Sens. Actuators, B, 2008, 129, 359–363 CrossRef CAS PubMed.
- Y. Takagai, Y. Nojiri, T. Takase, W. L. Hinze, M. Butsugan and S. Igarashi, Analyst, 2010, 135, 1417–1425 RSC.
- T. Abel, B. Ungerbock, I. Klimant and T. Mayr, Chem. Cent. J., 2012, 6, 124 CrossRef CAS PubMed.
- C. Preininger, M. Ludwig and G. J. Mohr, J. Fluoresc., 1998, 8, 199–205 CrossRef CAS.
- Q. Chang, J. Sipior, J. R. Lokowicz and G. Rao, Anal. Biochem., 1995, 232, 92–97 CrossRef CAS PubMed.
- K. Waich, S. Borisov, T. Mayr and I. Klimant, Sens. Actuators, B, 2009, 139, 132–138 CrossRef CAS PubMed.
- J. Lei, L. Wang and J. Zhang, Chem. Commun., 2010, 46, 8445–8447 RSC.
- R. Sjöback, J. Nygren and M. Kubista, Spectrochim. Acta, Part A, 1995, 51, L7–L21 CrossRef.
- M. M. Martin and L. Lindqvist, J. Lumin., 1975, 10, 381–390 CrossRef CAS.
- H. Leonhardt, L. Gordon and R. Livingston, J. Phys. Chem., 1971, 75, 245–249 CrossRef CAS.
- R. W. Ramette and E. B. Sandell, J. Am. Chem. Soc., 1956, 78, 4872–4878 CrossRef CAS.
- S. Woislawski, J. Am. Chem. Soc., 1953, 75, 5201–5203 CrossRef CAS.
- S.-L. Hii, S.-Y. Yong and C.-L. Wong, J. Appl. Phycol., 2009, 21, 625–631 CrossRef CAS.
- Y. A. Gomaa, M. J. Garland, F. McInnes, R. F. Donnelly, L. K. El-Khordagui and C. Wilson, Int. J. Pharm., 2012, 438, 140–149 CrossRef CAS PubMed.
- A. J. G. Otuka, V. Tribuzi, D. S. Corrêa and C. R. Mendonça, Opt. Mater. Express, 2012, 2, 1803–1808 CrossRef CAS.
- L. Zhang, Z. Fu, Z. Wu, Y. Wang, X. Fu and T. Cui, Mater. Res. Bull., 2014, 56, 65–70 CrossRef CAS PubMed.
- Q. Wang, Z. Ci, G. Zhu, M. Que, S. Xin, Y. Wen and Y. Wang, J. Solid State Sci. Technol., 2012, 1, R92–R97 CrossRef CAS PubMed.
- F. Kleitz, W. Schmidt and F. Schüth, Microporous Mesoporous Mater., 2003, 65, 1–29 CrossRef CAS.
| This journal is © The Royal Society of Chemistry 2015 |

