
 Open Access Article
 This Open Access Article is licensed under a
 Creative Commons Attribution 3.0 Unported Licence
Label-free monitoring of plasmonic catalysis on the nanoscale
Zhenglong
Zhang
a,
Tanja
Deckert-Gaudig
a and
Volker
Deckert
*ab
aLeibniz Institute of Photonic Technology – IPHT, Albert-Einstein-Str. 9, 07745 Jena, Germany. E-mail: volker.deckert@ipht-jena.de
bInstitute of Physical Chemistry and Abbe Center of Photonics, Friedrich-Schiller University Jena, Helmholtzweg 4, 07743 Jena, Germany
First published on 7th May 2015
Abstract
Plasmonics is the description of specific light matter interactions of metallic structures. In general the size of such structures is well in the nanometer regime and also determines such specific characteristics as color, field confinement etc. Plasmon-induced hot electrons play a vital role in so-called plasmonic catalysis, a field that has recently attracted attention as a new reaction platform. Current reports introduce such nanoscale catalysis as an effective approach to concentrate the energy of visible light and direct it to adsorbed molecules, thereby increasing the chemical reaction rate, and controlling the reaction selectivity. In this review, we present various plasmon-catalyzed reactions specifically monitored with Raman spectroscopy, namely surface-enhanced Raman scattering (SERS), remote SERS (Re-SERS) and tip-enhanced Raman scattering (TERS). These techniques utilize the signal enhancing effect of the metal nanoparticles. However, at the same time they can be used to control the actual reactivity. In the first part, the mechanism of plasmonic catalysis is introduced. Then it is shown how catalytic reactions can be spectroscopically investigated far beyond the diffraction limit using TERS. Finally, the sensitivity of the methods is discussed.
 Zhenglong Zhang | Zhenglong Zhang studied physics at Shaanxi Normal University and Institute of Physics, Chinese Academy of Sciences, China, and received his Ph.D. in optics in 2013. Then he worked as a Postdoc and AvH Fellow in Prof. V. Deckert's Group at Leibniz Institute of Photonic Technology, Germany. His research interests are in tip-enhanced Raman spectroscopy (TERS) and plasmonic catalysis. |
 Tanja Deckert-Gaudig | Tanja Deckert-Gaudig studied chemistry at the University of Würzburg and received her Ph.D. in organic chemistry in the group of Prof. S. Hünig in 1997. After her parental leave she switched to physical chemistry in 2002. Since then she has been working on Raman spectroscopy and scanning probe microscopy in the group of Prof. V. Deckert. In 2009 she moved to the Leibniz Institute of Photonic Technology (IPHT) in Jena. With tip-enhanced Raman spectroscopy (TERS) she studies and chemically characterizes organic and biological surfaces on the nanoscale. Her main focus is set on protein species such as amyloid fibrils. |
 Volker Deckert | Volker Deckert is a Professor at the Institute of Physical Chemistry at the Friedrich-Schiller University, Jena and also heads the Nanoscopy department at the Leibnitz Institute of Photonic Technologies, Jena. He received his Ph.D. from the University of Würzburg, working on Raman spectroscopy. As a post-doc his research focus shifted towards non-linear and time-resolved laser spectroscopy at the University of Tokyo and KAST, in Kawasaki. Since his habilitation at the ETH Zurich, he does research on near-field optical spectroscopy, a subject he still pursues and currently applies to biological samples and to the investigation of chemical reactivity on the nanometer scale. |
1. Introduction
In the presence of catalysts the activation barrier that has to be overcome to start a chemical reaction decreases and the reaction can be carried out under milder conditions. At the same time the reaction rate and efficiency can increase. The catalyst is not consumed during the reaction and can often be recycled.1–3 In this field photocatalysis is an emerging and economically viable technology, which can be initiated by the inexhaustibly abundant, clean and safe energy from the sun.4 An example of high public interest is the production of the clean fuel H2 that is obtained from the splitting of water by solar photocatalysis in the presence of TiO2.5Recently, surface plasmons (SPs) excited by visible light on metal nanostructures have been used to initiate chemical reactions where the plasmonic nanostructure acts as the catalytic active site.6–8 If such a reaction is followed by Raman spectroscopy the plasmonic nanostructure is catalyst and nanoscale signal enhancer, simultaneously. This so-called surface heterogeneous plasmonic catalysis gains significant attention due to its high throughput and low energy requirements as reported in studies on molecular dimerization and dissociation reactions, e.g. dissociation of hydrogen,9,10 water,11,12 hydrocarbon conversion,13,14etc.
Surface plasmons are collective oscillations of free electrons that exist at the metal–dielectric interface, where the real part of the dielectric function changes sign across the interface.15,16 Normally, SPs consist of localized SPs (LSPs) and propagating SPs (PSPs).17 LSPs are charge density oscillations confined to the surface of metallic nanoparticles.18 LSP resonance (LSPR), the excitation of LSPs by incident light at a special wavelength where resonance occurs, results in a huge enhancement of the local electromagnetic (EM) field. Such EM field enhancements are the underlying physical basis for surface-enhanced Raman scattering (SERS)19 and tip-enhanced Raman scattering (TERS).20 PSPs are the result of a collective excitation of conduction electrons that propagate in a wave-like manner along the metal–dielectric interface, and are confined to the vicinity of the interface.21 The remote-excitation measurement, e.g. remote excitation SERS (Re-SERS),22 can be explained by PSPs.
In addition to the EM enhancement, LSPs excited on silver or gold nanoparticle surfaces can decay non-radiatively into “hot electrons” with a high energy between the Fermi and vacuum energy level.23–26 If hot electrons scatter into an excited state of the absorbed molecules triggering a chemical reaction by reducing the activation energy, this is called a “plasmon catalyzed reaction”. A scheme of the proposed mechanism of plasmonic catalysis is shown in Fig. 1. Hot electrons initially generated from the plasmon decay on the silver or gold nanostructures’ surface, soon lose coherence and form a non-equilibrium Fermi–Dirac type distribution. The hot electrons in the high energy level have sufficient energy to transfer to the excited state of molecule A, creating a transient negative ion. This negative ion of molecule A travels to the excited state of molecule B and transfers the electron back to the silver or gold nanostructures’ surface, where it returns to the ground state of molecule B and finishes the plasmon catalyzed reaction of molecule A to B.
 | ||
| Fig. 1 Sketch of the plasmonic catalysis mechanism. Laser excitation of silver or gold nanostructures, generates hot electrons. Due to a plasmon decay the electrons can be transferred to an excited state of molecule A, from there a catalyzed reaction can be initiated to result in the final product, molecule B. Adapted from ref. 26. | ||
Based on the same principles of LSPs and PSPs, plasmonic catalysis can be tracked on the nanoscale by SERS and TERS. In this review, we focus on recent advances in the field of plasmon catalysis on the nanoscale. The presented nanoscale-techniques including SERS, remote SERS and TERS used in plasmonic catalysis are reviewed, respectively. First, the early results of plasmon catalyzed reactions observed by SERS and remote-SERS techniques are introduced. The well-studied plasmon catalyzed reaction of p-nitrothiophenol (pNTP) or p-aminothiophenol (pATP) molecules to p,p-dimercaptoazobenzene (DMAB) are reviewed in detail. Then, it is shown how TERS can be utilized for investigating plasmonic catalysis with high spatial resolution beyond the diffraction limit. The controlled catalytic processes and localized temperature of plasmonic catalysis revealed by TERS are reviewed. Finally, it is demonstrated that plasmonic catalysis can be conducted even at the single molecule level. A new behaviour of pNTP could be monitored on the single molecule level, which strongly differs from previous reports as separated pNTP molecules exclusively react to thiophenol (TP).
2. Plasmonic catalysis in SERS and Re-SERS
2.1 Short introduction of SERS and Re-SERS
Raman scattering is an inelastic scattering of photons from a molecule in which the frequency change from the excitation frequency corresponds to the vibrational energy levels.27 Since Raman spectra provide spectroscopic fingerprints of molecules it plays an important role in non-destructive and label-free detection, and biological and chemical sensing.28 However, Raman spectroscopy suffers from low sensitivity because of the very low cross section (∼10−27–10−30 cm2 sr−1 per molecule), which limits the applications of Raman sensing in plasmonic catalysis where often only minute amounts of sample are present.29The phenomenon of LSPR on the nanoscale on metal surfaces led to the SERS that strongly enhances Raman signals of molecules adsorbed on rough metal surfaces. In this way insensitive Raman spectroscopy evolved into a highly sensitive technique.30,31 Normally, the enhancement factor of SERS is more than 106, depending on the size and shape of the nanostructures, incident light wavelength, distance between molecule and surface, etc.32–34 Here, LSPR not only generates the hot electrons necessary for plasmonic catalysis but also enables SERS to monitor the reaction.
As mentioned, PSPs can propagate along a plasmonic waveguide, which allows the transfer of light over micrometres through structures with sub-diffraction limited diameters.35–37 Using PSPs as a remote excitation source, a novel technique Re-SERS was first reported in 2009.22,38 A schematic comparison of conventional SERS and Re-SERS is shown in Fig. 2. In a SERS experiment, the incident light is focused on the detecting target, which is called “local SERS”. In contrast, the Re-SERS refers to the focused spot of incident light that is far from the target, which is excited by the PSPs.39 Compared with local SERS, Re-SERS can avoid sample damage from direct laser irradiation, improve the signal to noise ratio, and lead to miniaturized photonics and high-resolution microscopy/spectroscopy. Using the Re-SERS technique, the remote investigation provides a novel way to perform sensing measurements of SERS and gives access to systems where traditional SERS is unsuitable, such as remote Raman optical activity,40,41 biomolecules in cells detecting,42,43 and also plasmonic catalysis.44–46
 | ||
| Fig. 2 Sketch of SERS and Re-SERS in an Ag nanoparticle–nanowire system. (a) Conventional SERS, the Raman signal is directly obtained from the nanoparticles. (b) Re-SERS signals are collected at the junction or end of a nanowire induced by the PSPs propagated along the nanowire when excited at the opposite end. | ||
2.2 Plasmonic catalysis in SERS
As a typical plasmon catalyzed reaction, pNTP adsorbed on plasmonic nanostructures reacts exclusively to DMAB, which was first reported by Dong et al. in 2011.47 The plasmon catalyzed dimerization of pNTP to DMAB is characterized by the disappearance of the Raman band at 1332 cm−1 (νNO2), and the appearance of new Raman bands around 1140 (βC–H), 1387 (νNN + νCC + νC–N) and 1432 (νNN + νCC + βC–H) cm−1. This observation can be explained by the reduction of the NO2 group and the formation of the –N![[double bond, length as m-dash]](https://www.rsc.org/images/entities/char_e001.gif) N– unit in DMAB. As shown in Fig. 3, with increasing time dimerization of pNTP to DMAB can be confirmed by the afore-mentioned bands in SERS by using silver nanoparticles on Cu and Ag films. It was found that this reaction strongly depends on substrate, wavelength and time. So, this plasmonic catalysis can be controlled accordingly. For example, irradiating silver nanoparticles on a copper film with 514 nm results in a completed reaction within minutes (see Fig. 3a), while on irradiating Ag nanoparticles with 633 nm on a silver film the reaction takes several hours (see Fig. 3b). The difference is attributed to different plasmon intensities in the gap between Ag nanoparticles and the Cu or Ag film, which can be estimated from the local EM field intensity distribution. pNTP and its amino analogue can be considered as model compounds for plasmon catalysis studies under different experimental conditions and acts a kind of standard to exploit related detection techniques.
N– unit in DMAB. As shown in Fig. 3, with increasing time dimerization of pNTP to DMAB can be confirmed by the afore-mentioned bands in SERS by using silver nanoparticles on Cu and Ag films. It was found that this reaction strongly depends on substrate, wavelength and time. So, this plasmonic catalysis can be controlled accordingly. For example, irradiating silver nanoparticles on a copper film with 514 nm results in a completed reaction within minutes (see Fig. 3a), while on irradiating Ag nanoparticles with 633 nm on a silver film the reaction takes several hours (see Fig. 3b). The difference is attributed to different plasmon intensities in the gap between Ag nanoparticles and the Cu or Ag film, which can be estimated from the local EM field intensity distribution. pNTP and its amino analogue can be considered as model compounds for plasmon catalysis studies under different experimental conditions and acts a kind of standard to exploit related detection techniques.
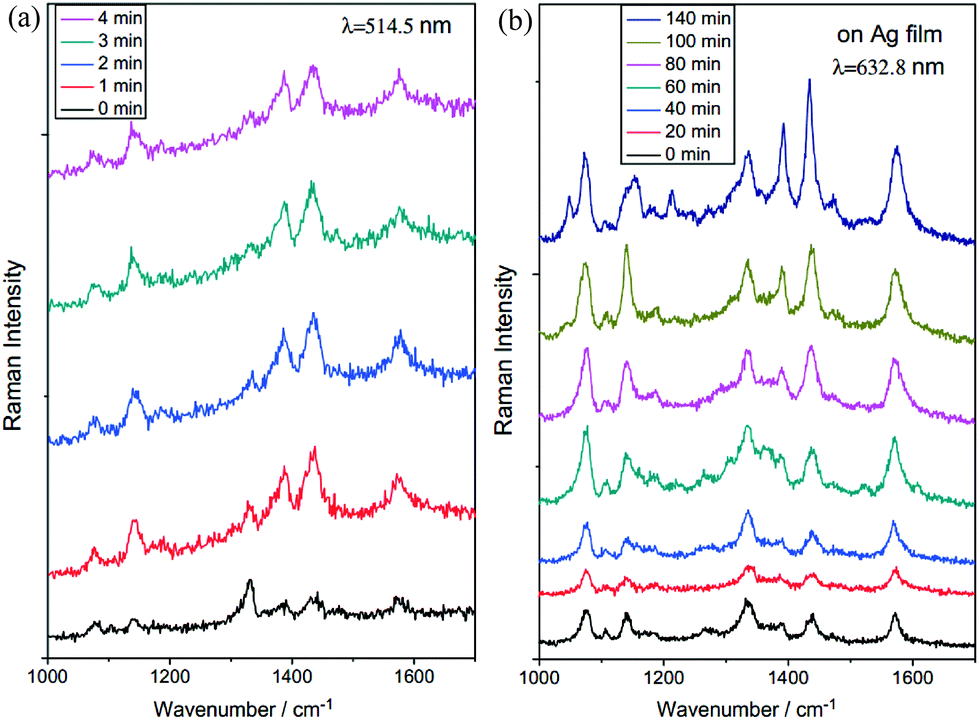 | ||
| Fig. 3 Time dependent SERS measurement of pNTP adsorbed on Ag nanoparticles on Cu and Ag films, respectively. (a) On Cu film at 514 nm, and (b) on Ag film at 632.8 nm. The peak at 1332 cm−1 is attributed to the NO2 vibration of pNTP and the peaks at 1140, 1387 and 1432 cm−1 are attributed to NN vibrations of DMAB. Adapted from ref. 47. | ||
In 2010, Fang, Huang and Canpean independently discovered that p-aminothiophenol (pATP) can also react to DMAB on SERS active substrates like silver or gold nanoparticles.13,14,48 As shown in Fig. 4, the catalyzed reaction of pATP to DMAB was investigated using different substrate dependent experiments, namely SERS, surface mass spectra, and potential dependent SERS. The results agree well with theoretical calculations utilizing density functional theory. These experiments investigate several aspects to fully understand previous (mis-)interpretations of pATP SERS spectra.49–52 Until recently, there were debates regarding whether the reaction could be attributed to a plasmon catalyzed reaction.6,53 In addition to the previously mentioned mass spectroscopy and potential dependent experiments selected plasmon catalysed reactions were also studied at different pH values, adding a further parameter to control such type of reactions.54–57 Some catalytic reactions can be even observed on a single nanoparticle level58,59 and single molecule level.26
 | ||
| Fig. 4 Reaction of pATP to DMAB confirmed by SERS, surface mass spectrometry and theoretical calculations. (a) SERS spectra of pATP from nanoparticles on Ag and Au films, which agrees well with theoretical calculations.13 (b) Surface mass spectra of pATP absorbed on Ag electrodes, illuminated with laser light (i), without any irradiation (ii), and a roughened Ag-free spectrum of pATP (iii), and the SERS spectra of pATP and DMAB on the Ag electrode. Adapted from ref. 13 and 14. | ||
2.3 Remote plasmonic catalysis in Re-SERS
Due to the atomic scale roughness and nearly perfect crystal form, chemically synthesized silver and gold nanowires (some micrometer long and some nanometers in diameter) can serve as plasmonic waveguides and play a primary role in remote controlled plasmonic catalysis, which was first reported by Sun et al. in 2011.45 As shown in Fig. 5, the remote SERS signals from a junction of silver nanowires and nanoparticles demonstrate that pNTP can react to DMAB induced by remotely excited PSPs. The SEM and optical images of the remote system are shown in Fig. 5(a) and (b). While an incident laser was focused on one of the ends (point A), a tiny emission spot at the junction (point B) and the other end (point C) indicates PSPs efficiently propagated along the Ag nanowire, coupling out as photons at point B with a massive electromagnetic enhancement. Fig. 5(c) shows Re-SERS spectra of the plasmon catalyzed reaction of pNTP to DMAB. The characteristic vibrational modes of DMAB were detected in the Re-SERS spectra, confirming the successful reaction initiation by the PSPs. Since PSPs on metal nanowires depend on the polarization angle of the incident laser, controlled remote plasmonic catalysis can be accomplished by irradiation angle variation. The most effective catalysis was achieved when the incident polarization was parallel to the nanowire axis, which could be understood by the properties of PSPs propagating along the metal nanowires.60 | ||
| Fig. 5 Remote controlled plasmonic catalysis on a single silver nanowire. (a) SEM images of the remote system of Ag nanowire and nanoparticles, (b) the bright field optical image of PSPs propagating along the Ag nanowire if the incident polarization is parallel to the nanowire axis, (c) polarization angle dependent Re-SERS spectra, which collected at point B in the image of (a). Adapted from ref. 45. | ||
In 2012 Lee and Moskovits reported an efficient remote plasmonic sensing using a nanowire array produced by electrochemical deposition on a porous anodic alumina template.11,44 This sensing device could be attached to an optical fiber or a catheter to remotely collect SERS signals. The plasmon catalyzed reaction of pATP to DMAB can be realized and monitored by this remote probe, although at that time it was not comprehended that the SERS signals were those of DMAB.44 The schematic of the experimental setup and SEM images of the remote sensing structures are shown in Fig. 6 left (a)–(e). For standard SERS measurements the incident laser was directly focused on the top of the wires where the molecule was located. In case of Re-SERS it was focused on the bottom of the glass substrate. In contrast to the above mentioned Re-SERS experiment, the PSPs on the Ag nanowire were excited by the incident laser and by the Raman scattering of the molecules adsorbed on the top of Ag nanowires, so the real remote distance was twice the nanowire length. The direct and remote excitation SERS spectra of pATP (DMAB) are shown in the right panel of Fig. 6. In this work also the influence of the gap distance was investigated, and it turned out that length and diameter of the Ag nanowires influence SERS and Re-SERS signals. The SERS and Re-SERS spectra from a gap of 11 nm and a length of 0.92–3.3 μm are shown in (f) and (g), and the gap of 33 nm with a length of 0.86–2.88 μm are shown in (h) and (i), respectively. It was found that for nanowire arrays with 11 nm gaps and 3.3 μm lengths (i.e., after a ∼6.6 μm round tip) the Re-SERS signals were rather strong, ∼5% the intensity of those obtained by local SERS.
 | ||
| Fig. 6 Remote plasmonic catalysis by a silver nanowire array of pATP to DMAB. Left: scheme of the remote SERS sensor system (top), cross-section (a) and top views (b–e), and the scale bar is 100 nm in (a)–(c), and 1 μm in (d) and (e). Right: averaged SERS spectra by direct excitation (f and g) and remote excitation (h and i); (f and g) gap of 11 nm with nanowire length of 920 nm (red). Image courtesy of Prof. Moskovits, adapted from ref. 44. | ||
3. Plasmonic catalysis in TERS
3.1 TERS
Tip enhanced Raman scattering (TERS) is a technique that provides molecular information on the nanoscale, which was first reported in 2000.61–63 In contrast to SERS, TERS can spatially resolve beyond the diffraction limit and is used for single molecule sensing64–69 and bio-molecule detection,70–72 plasmonic catalysis,73–75 and plasmonic gradient effects,76–78 to name only a few application areas. In TERS Raman microscopy is combined with scanning probe microscopy (SPM), and an ultra-sharp metal SPM tip can create a hot spot to strongly enhance the Raman scattering intensity. As an example a schematic of a side-illumination TERS setup is shown in Fig. 7. The highly localized enhancement provides a high spatial-resolution for optical analysis (<5 nm), which depends on the nanoparticle nature at the apex of the SPM tip. Commonly SPMs used in TERS include scanning tunnelling microscopes (STM) and atomic force microscopes (AFM). If the tip and substrate were placed in a high vacuum chamber, so called high vacuum TERS (HV-TERS), a clean environment for TERS study is provided which is in particular suitable for studying model plasmonic catalysis.79 | ||
| Fig. 7 Schematic TERS side-illumination setup. A long working distance objective links a Raman system (not shown) and focuses on the plasmonic tip; the enhanced signals originate predominantly from molecules in closest vicinity to the tip apex, which provides the high spatial-resolution analysis. Adapted from ref. 79. | ||
3.2 Controlled plasmonic catalysis in TERS
Plasmon catalyzed reactions revealed by TERS was first reported in 2012.73,74 As shown in Fig. 8(a), a monolayer of pNTP was assembled on a smooth gold nanoplate on glass, and probed with a AFM-TERS system. Excitation and collection of the Raman signals were performed through sample support and sample in epi-illumination, and a silver-coated AFM tip was used to generate a strong plasmon intensity to catalyse pNTP-to-DMAB conversion. The incident laser was switched between green (532 nm) and red (632.8 nm) to respectively initiate the reaction (green) and spectroscopically monitor (red). Fig. 8(b) shows the plasmon catalyzed reaction of pNTP to DMAB under high vacuum conditions based on a STM-TERS system. The hot electrons generated from the plasmon decay around the gap between gold tip and silver substrate served as the actual agent. Two pNTP molecules localized in the gap between tip and substrate were catalyzed to a DMAB molecule with the help of hot electrons. | ||
| Fig. 8 Schematic of the plasmon catalyzed reaction of pNTP in TERS. (a) A monolayer pNTP adsorbed on gold nanoplate on glass was catalyzed to DMAB by TERS based on an AFM system.73 (b) Same plasmonic catalysis in HV-TERS based on a STM system.74 Adapted from ref. 73 and 74. | ||
In contrast to the plasmon catalyzed reaction by SERS, an effective control of the catalytic process can be achieved with TERS. Fig. 9(a)–(e) gives incident laser power dependent TERS spectra of the reaction of pNTP to DMAB from a STM-TERS experiment. Initially, the spectrum shows the three main peaks of pNTP (see Fig. 9(a)) at 10 μW. On increasing the laser intensity to 60 μW no spectral changes were observed (see Fig. 9(b)). When the laser intensity was raised to 200 μW (see Fig. 9(c)) the intensity of the characteristic band at 1332 cm−1 for the –NO2 stretching mode decreased while DMAB bands at 1140, 1387 and 1432 cm−1 appeared, indicating a gradual reaction. Almost all pNTP molecules dimerized immediately when the laser intensity was increased to 2 mW (see Fig. 9(d)). Lastly, the spectra did not change when the laser intensity was reduced to the initial 10 μW (see Fig. 9(e)). Evidently, a series of in situ spectra in Fig. 9(a) were performed in a long time TERS measurement.
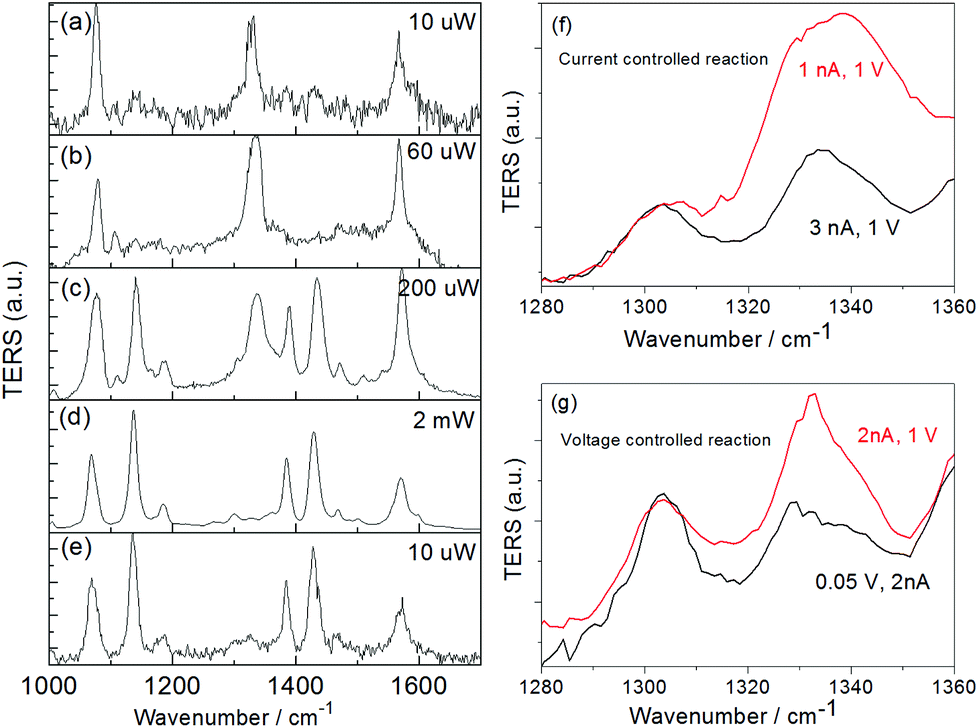 | ||
| Fig. 9 Laser intensity and gap distance dependent TERS spectra. Laser intensity controlled plasmon catalyzed reaction of pNTP to DMAB at a power of (a) 10, (b) 60, (c) 200, (d) 2000 μW, and back to (e) 10 μW; peak of pNTP at 1332 cm−1 can decrease when increasing the tunnelling current (f) or decreasing the bias voltage (g). Adapted from ref. 74. | ||
In STM-TERS, a plasmon catalytic reaction cannot only be controlled by the laser intensity, but also by the tip–substrate gap distance. Normally, the decrease of the gap distance can increase the local EM field, and excites a higher surface plasmon intensity at the apex of metallic tip.80 Similar to the increase of the incident laser intensity, a faster dimerization of pNTP to DMAB can be obtained by decreasing the gap distance. The tunnelling current in STM can be written as,
 | (1) |
3.3 Localized temperature of plasmonic catalysis revealed by anti-Stokes TERS
Due to the high-sensitivity and high spatial-resolution of TERS, the localized temperature can be calculated from the Stokes and anti-Stokes spectra.81,82 As shown in Fig. 10(a), the Stokes and anti-Stokes signals from a STM-TERS experiment were observed at a tunnelling current of 2.5 nA and a bias voltage of 1 V. The marker bands of DMAB at 1140, 1387 and 1432 cm−1 can also be clearly observed experimentally in Stokes and anti-Stokes TERS spectra, which further confirmed that almost all pNTP reacted to DMAB. | ||
| Fig. 10 (a) Stokes and anti-Stokes TERS spectra at a tunnelling current of 2.5 nA and a bias voltage of 1 V, and (b) gap distance dependent simulated spectra of the wavelength scanning plasmon enhancement of TERS, where R is 25 nm and θ = 60°. Adapted from ref. 82. | ||
The local reaction temperature in plasmonic catalysis can be estimated by fitting the intensities to
| Is/Ias = a × e(hv/kBT) | (2) |
 | (3) |
3.4 More plasmon catalyzed reactions in TERS
In the previous sections the potential of TERS as a tool to investigate and control plasmon catalyzed chemical reactions on the nanoscale has been reviewed. In addition to the plasmonic dimerization of pNTP to DMAB, the plasmonic dissociation of DMAB could also be accomplished by TERS. It has been reported that such products can be controlled by pH variation.83 As shown in Fig. 11(a), the –NN– bond in DMAB can be selectively dissociated by so-called plasmonic scissors, and pATP was produced from the radical via H+ attachment under acidic conditions, while pNTP was obtained under alkaline conditions. At low pH, DMAB in the nanogap was excited by 2 mW laser and TERS spectra were recorded for 60 minutes. As shown in Fig. 11(b) and (c), no significant changes were obtained during this period. However, with a low tunnelling current (increased gap distance) and a weak laser intensity (20 μW) resulting in a very low plasmon intensity, a significantly different spectrum was recorded from DMAB. As shown in Fig. 11(d), the –NN– bond of DMAB was selectively cleaved, and pATP was formed. Fig. 11(f)–(h) shows the TERS spectra at high pH, collected at 0, 10 and 60 minutes, respectively. It was found that the characteristic band of pNTP at 1332 cm−1 slowly appears at 2 mW laser excitation after 10 minutes, which had been obviously increased at 60 minutes with a simultaneous decrease of the characteristic DMAB signals. The signals of DMAB almost disappeared upon increasing the gap distance and decreasing the laser intensity to 20 μW, and only the characteristic bands of pNTP were observed (see Fig. 11(i) and (j)). The fragments from DMAB were subsequently converted to pNTP under alkaline conditions.
 | ||
| Fig. 11 (a) Schematic of the plasmon catalyzed dissociation of DMAB at low and high pH values. TERS spectra of DMAB at pH 3 after 0 (b) and 60 (c) minutes, and (d) spectrum on the tip with weak irradiation after strong excitation for 60 minutes. TERS spectra of DMAB at pH 11 after 0 (f), 10 (g) and 60 (h) minutes, and (i) spectrum on the tip with weak irradiation after strong excitation for 60 minutes. Raman spectra of pATP (e) and pNTP (j), respectively. Adapted from ref. 83. | ||
If the incident laser frequency is close in energy to an electronic transition of molecule, this resonance can enhance the Raman intensity strongly and facilitate a plasmonic catalyzed reaction. Since the absorption maximum of malachite green (MG) is around 630 nm and the TERS spectrum measured correspondingly at 632.8 nm, it would be expected that an inter or intra molecular reaction of MG could be observed with the help of plasmonic catalysis. This plasmon catalyzed bond-selective dissociation of MG molecule with resonant HV-TERS was reported in 2014.75 As shown in Fig. 12, resonantly excited Raman bands marked A–D can be observed in spectrum (a). Theoretical calculations reveal that these MG bands are associated with –NC2H6 fragments (see Fig. 12(f)), whereas band E refers to a vibrational mode associated with the C–C stretching mode of the benzenyl unit. It is noteworthy that the resonance enhanced Raman peaks A–D initially presented in the spectrum (a) disappeared, whereas new peaks F–M in the final stable spectrum (c) emerged after 40 minutes. The modes F–M can be assigned to the fragments (benzenyl unit of MG) as confirmed by the simulated Raman spectra (d) and (e). It is evident that a bond-selective dissociation reaction must have occurred. Applied to the intramolecular reaction it can be hypothesized that plasmon-induced hot electrons initiate a cleavage of two –NC2H6 residues from the MG molecule. A scheme of the proposed plasmonic scissors is shown in Fig. 12(g).
 | ||
| Fig. 12 Time dependent resonant TERS spectra of MG, (a) initial spectrum, (b) intermediate spectrum (20 minutes after continuous laser irradiation), (c) final spectrum (40 minutes after continuous laser irradiation), (d) and (e) simulated Raman spectra of MG fragments. (f) Vibrational modes of MG (corresponding to bands A–D in spectrum (a) as calculated by density functional theory). (g) Sketch of proposed plasmonic scissors in resonant TERS. Adapted from ref. 75. | ||
4. Single molecule level plasmonic catalysis
As stated above, plasmon catalyzed dimerization of pNTP to DMAB is possible in SERS as well as in TERS. For any dimerization the distance between the reactants is decisive. If the distance between pNTP molecules becomes too large a dimerization reaction cannot occur. In this case the question arises, whether plasmons can initiate an intramolecular reaction such as dissociation or rearrangement. To address this issue, detection sensitivity down to a few or ultimately even a single molecule is required. Using junctions or gaps between nanoparticles, so-called hot spots, very high enhancement factors (108–1012) can be achieved, providing sufficient signal enhancement for single molecule detection.84–86A single gold nanoparticle dimer was used for a SERS experiment with pNTP at a potential single molecule level. Different concentrations of the compound were chosen to determine whether it was possible to prevent clustering and self-assembly. Only then the distance of pNTP molecules adsorbed on the nanoparticles becomes too large for an intermolecular reaction. The experiments demonstrated that a dimerization of pNTP to DMAB occurred for 10−7 and 10−8 M solutions of pNTP indicating that the dimer surface was still too densely covered. In 10−9 M solution, on average 10 molecules are absorbed on a single gold dimer, resulting in an average distance between two molecules of ∼32 nm. As shown in Fig. 13(a), the initial SERS spectrum of pNTP was stable since no DMAB signals could be detected even at laser power within 30 minutes. It was obvious that the distance between pNTP molecules in the hot-spot of the gold dimer was indeed too large to allow an intermolecular reaction. However, an intensity decrease of the strong 1332 cm−1 pNTP signal was observed and after 10 min the band completely disappeared. Simultaneously new bands at 995 and 1017 cm−1 appeared. Hence, the behavior is considerably different compared to the higher concentrations. The disappearance of the NO2 mode suggests that the entire nitro group was cleaved from the benzene ring resulting in the formation of thiophenol (TP). The striking similarity of SERS spectra of neat TP and those from Fig. 13(b) supports this assumption.
 | ||
| Fig. 13 Comparison of SERS spectra of pNTP and TP with spectra recorded during the experiment by a single gold dimer. (a) Time dependent SERS spectra of reacted pNTP at 3 mW at 632.8 nm after 2, 6 and 30 min irradiation. Normal SERS spectra and corresponding molecular structures of TP and pNTP are shown in (b) and (c), respectively. Adapted from ref. 26. | ||
A step-like signal intensity change during the process strongly indicated that the dissociation reaction of pNTP to TP happened close to a single molecule level. In Fig. 14, the peak intensity slope is given as a function of time for the pNTP marker band at 1332 cm−1, and the TP marker band at 1017 cm−1, respectively. Half of the pNTP molecules reacted to TP after 5 min, and both pNTP molecules reacted to TP after 8 min. After 10 min no significant change occurred. Consequently, it can be assumed that two non-interacting molecules were detected in the hot spot of the single gold dimer. The two pNTP molecules were too far apart from each other for a dimerization reaction and an intramolecular dissociation was initiated.
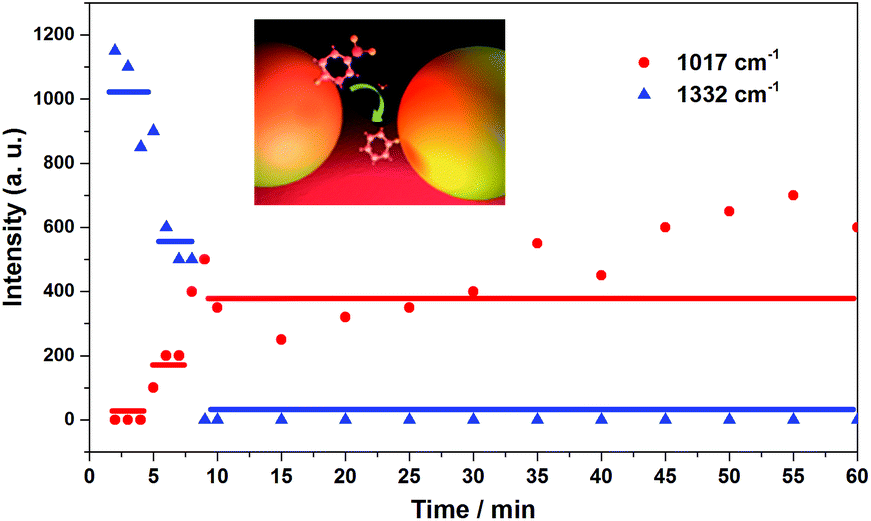 | ||
| Fig. 14 Step-like process of the dissociation of pNTP to TP. Peak intensity is given as a function of time for the pNTP marker band at 1332 cm−1 (red dots), and the TP marker band at 1017 cm−1 (blue triangles). Inset: scheme of the plasmon catalyzed reaction of pNTP to TP near the single molecule level on a single gold dimer. | ||
These experiments clearly support the dimerization mechanism as an explanation for the spectra and also report a novel reaction channel for pNTP, which strongly differs from high concentration investigations.
5. Summary and outlook
In this contribution the development of plasmonic catalysis as a new exciting heterogeneous catalytic system on the nanoscale was reviewed. The underlying mechanism was introduced and recent advanced studies of plasmon catalyzed reactions were summarized. In particular pNTP turns out to be a good model/standard for studies on the nanoscale as SERS, Re-SERS and TERS technique have revealed. With Re-SERS, plasmonic catalysis can be followed and controlled by means of a single Ag nanowire as a waveguide and the reaction is even more efficient with a Ag nanowire array. In TERS catalytic processes like dimerization, dissociation or protonation can easily monitored by time lapse or laser intensity dependent measurements. Using STM-TERS setups the speed of catalysis can be controlled further by the gap distance between tip and substrate and it was shown that the localized experimental temperature can be estimated from the ratio of Stokes and anti-Stokes TERS spectra. Concentration dependent SERS experiments of pNTP indicate the importance of the concentration of the probed molecule since below a certain threshold the intermolecular reaction switch to an intramolecular process. The ability to follow catalytic reactions near the single molecule level renders enhanced Raman spectroscopy very promising for mechanistic studies. However, to unravel the full potential of plasmonic catalysis, some challenges need to be overcome. In contrast to photocatalysis, the plasmons in plasmonic catalysis play a critical role not only for the excitation process but also for the chemical reaction. Most probably plasmonic catalysis can be attributed to plasmon induced hot electrons, but the detailed mechanism has not been completely understood yet. More theoretical and experimental studies including surface plasmon, hot electrons and plasmonic catalysis are necessary and will certainly follow in the near future to exploit the entire potential of this new research field.Acknowledgements
We gratefully acknowledge support from the Deutsche Forschungsgemeinschaft (DEP4TERS, FR1348/19-1) and the Thüringer Aufbau Bank (no. 2011SE9048). Z. Zhang acknowledges financial support from the Alexander von Humboldt foundation.Notes and references
- N. Mizuno and M. Misono, Chem. Rev., 1998, 98, 199–217 CrossRef CAS PubMed.
- A. S. K. Hashmi and G. J. Hutchings, Angew. Chem., Int. Ed., 2006, 45, 7896–7936 CrossRef PubMed.
- A. H. Liang, H. X. Ouyang and Z. L. Jiang, Analyst, 2011, 136, 4514–4519 RSC.
- M. A. Fox and M. T. Dulay, Chem. Rev., 1993, 93, 341–357 CrossRef CAS.
- J. Schneider, M. Matsuoka, M. Takeuchi, J. L. Zhang, Y. Horiuchi, M. Anpo and D. W. Bahnemann, Chem. Rev., 2014, 114, 9919–9986 CrossRef CAS PubMed.
- M. T. Sun and H. X. Xu, Small, 2012, 8, 2777–2786 CrossRef CAS PubMed.
- K. Ueno and H. Misawa, J. Photochem. Photobiol., C, 2013, 15, 31–52 CrossRef CAS PubMed.
- M. D. Xiao, R. B. Jiang, F. Wang, C. H. Fang, J. F. Wang and J. C. Yu, J. Mater. Chem. A, 2013, 1, 5790–5805 CAS.
- S. Mukherjee, F. Libisch, N. Large, O. Neumann, L. V. Brown, J. Cheng, J. B. Lassiter, E. A. Carter, P. Nordlander and N. J. Halas, Nano Lett., 2013, 13, 240–247 CrossRef CAS PubMed.
- S. Mukherjee, L. A. Zhou, A. M. Goodman, N. Large, C. Ayala-Orozco, Y. Zhang, P. Nordlander and N. J. Halas, J. Am. Chem. Soc., 2014, 136, 64–67 CrossRef CAS PubMed.
- J. Lee, S. Mubeen, X. L. Ji, G. D. Stucky and M. Moskovits, Nano Lett., 2012, 12, 5014–5019 CrossRef CAS PubMed.
- H. M. Chen, C. K. Chen, C. J. Chen, L. C. Cheng, P. C. Wu, B. H. Cheng, Y. Z. Ho, M. L. Tseng, Y. Y. Hsu, T. S. Chan, J. F. Lee, R. S. Liu and D. P. Tsai, ACS Nano, 2012, 6, 7362–7372 CrossRef CAS PubMed.
- Y. Fang, Y. Li, H. Xu and M. Sun, Langmuir, 2010, 26, 7737–7746 CrossRef CAS PubMed.
- Y. F. Huang, H. P. Zhu, G. K. Liu, D. Y. Wu, B. Ren and Z. Q. Tian, J. Am. Chem. Soc., 2010, 132, 9244–9246 CrossRef CAS PubMed.
- W. L. Barnes, A. Dereux and T. W. Ebbesen, Nature, 2003, 424, 824–830 CrossRef CAS PubMed.
- J. Homola, S. S. Yee and G. Gauglitz, Sens. Actuators, B, 1999, 54, 3–15 CrossRef CAS.
- A. J. Haes and R. P. Van Duyne, Anal. Bioanal. Chem., 2004, 379, 920–930 CrossRef CAS PubMed.
- K. A. Willets and R. P. Van Duyne, Annu. Rev. Phys. Chem., 2007, 58, 267–297 CrossRef CAS PubMed.
- A. Campion and P. Kambhampati, Chem. Soc. Rev., 1998, 27, 241–250 RSC.
- E. Bailo and V. Deckert, Chem. Soc. Rev., 2008, 37, 921–930 RSC.
- H. Wei, D. Ratchford, X. Q. Li, H. X. Xu and C. K. Shih, Nano Lett., 2009, 9, 4168–4171 CrossRef CAS PubMed.
- Y. R. Fang, H. Wei, F. Hao, P. Nordlander and H. X. Xu, Nano Lett., 2009, 9, 2049–2053 CrossRef CAS PubMed.
- A. O. Govorov, H. Zhang and Y. K. Gun'ko, J. Phys. Chem. C, 2013, 117, 16616–16631 CAS.
- I. Goykhman, B. Desiatov, J. Khurgin, J. Shappir and U. Levy, Nano Lett., 2011, 11, 2219–2224 CrossRef CAS PubMed.
- M. W. Knight, H. Sobhani, P. Nordlander and N. J. Halas, Science, 2011, 332, 702–704 CrossRef CAS PubMed.
- Z. L. Zhang, T. Deckert-Gaudig, P. Singh and V. Deckert, Chem. Commun., 2015, 51, 3069–3072 RSC.
- P. L. Stiles, J. A. Dieringer, N. C. Shah and R. R. Van Duyne, Annu. Rev. Anal. Chem., 2008, 1, 601–626 CrossRef CAS PubMed.
- J. A. Dougan and K. Faulds, Analyst, 2012, 137, 545–554 RSC.
- M. Moskovits, J. Raman Spectrosc., 2005, 36, 485–496 CrossRef CAS PubMed.
- M. Fleischm, P. J. Hendra and A. Mcquilla, Chem. Phys. Lett., 1974, 26, 163–166 CrossRef.
- D. L. Jeanmaire and R. P. Vanduyne, J. Electroanal. Chem., 1977, 84, 1–20 CrossRef CAS.
- C. L. Haynes and R. P. Van Duyne, J. Phys. Chem. B, 2003, 107, 7426–7433 CrossRef CAS.
- J. F. Masson, M. P. Murray-Methot and L. S. Live, Analyst, 2010, 135, 1483–1489 RSC.
- Z. L. Zhang, P. F. Yang, H. X. Xu and H. R. Zheng, J. Appl. Phys., 2013, 113, 033102 CrossRef PubMed.
- R. M. Dickson and L. A. Lyon, J. Phys. Chem. B, 2000, 104, 6095–6098 CrossRef CAS.
- S. Lal, J. H. Hafner, N. J. Halas, S. Link and P. Nordlander, Acc. Chem. Res., 2012, 45, 1887–1895 CrossRef CAS PubMed.
- H. Ditlbacher, A. Hohenau, D. Wagner, U. Kreibig, M. Rogers, F. Hofer, F. R. Aussenegg and J. R. Krenn, Phys. Rev. Lett., 2005, 95 Search PubMed.
- J. A. Hutchison, S. P. Centeno, H. Odaka, H. Fukumura, J. Hofkens and H. Uji-i, Nano Lett., 2009, 9, 995–1001 CrossRef CAS PubMed.
- Y. Z. Huang, Y. R. Fang, Z. L. Zhang, L. Zhu and M. T. Sun, Light: Sci. Appl., 2014, 3 Search PubMed.
- J. R. Xia, Y. T. Feng, L. Zhu, Z. L. Zhang, L. X. Xia and L. W. Liu, Plasmonics, 2014, 9, 673–676 CrossRef CAS.
- M. T. Sun, Z. L. Zhang, P. J. Wang, Q. Li, F. C. Ma and H. X. Xu, Light: Sci. Appl., 2013, 2, e68 CrossRef PubMed.
- R. X. Yan, J. H. Park, Y. Choi, C. J. Heo, S. M. Yang, L. P. Lee and P. D. Yang, Nat. Nanotechnol., 2012, 7, 191–196 CrossRef CAS PubMed.
- Y. Z. Huang, Y. R. Fang and M. T. Sun, J. Phys. Chem. C, 2011, 115, 3558–3561 CAS.
- S. J. Lee and M. Moskovits, J. Am. Chem. Soc., 2012, 134, 11384–11387 CrossRef CAS PubMed.
- M. T. Sun, Y. X. Hou, Z. P. Li, L. W. Liu and H. X. Xu, Plasmonics, 2011, 6, 681–687 CrossRef CAS.
- P. Song, Y. Z. Li, Y. Q. Li, M. Y. Zhao, L. W. Liu and M. T. Sun, Plasmonics, 2013, 8, 249–254 CrossRef CAS.
- B. Dong, Y. R. Fang, X. W. Chen, H. X. Xu and M. T. Sun, Langmuir, 2011, 27, 10677–10682 CrossRef CAS PubMed.
- V. Canpean, M. Iosin and S. Astilean, Chem. Phys. Lett., 2010, 500, 277–282 CrossRef CAS PubMed.
- M. Osawa, N. Matsuda, K. Yoshii and I. Uchida, J. Phys. Chem., 1994, 98, 12702–12707 CrossRef CAS.
- Q. Zhou, X. W. Li, Q. Fan, X. X. Zhang and J. W. Zheng, Angew. Chem., Int. Ed., 2006, 45, 3970–3973 CrossRef CAS PubMed.
- D. Maniu, V. Chis, M. Baia, F. Toderas and S. Astilean, J. Optoelectron. Adv. Mater, 2007, 9, 733–736 CAS.
- A. P. Richter, J. R. Lombardi and B. Zhao, J. Phys. Chem. C, 2010, 114, 1610–1614 CAS.
- L. B. Zhao, M. Zhang, Y. F. Huang, C. T. Williams, D. Y. Wu, B. Ren and Z. Q. Tian, J. Phys. Chem. Lett., 2014, 5, 1259–1266 CrossRef CAS.
- M. T. Sun, Y. Z. Huang, L. X. Xia, X. W. Chen and H. X. Xu, J. Phys. Chem. C, 2011, 115, 9629–9636 CAS.
- Y. Zong, Q. H. Guo, M. M. Xu, Y. X. Yuan, R. N. Gu and J. L. Yao, RSC Adv., 2014, 4, 31810–31816 RSC.
- P. Singh and V. Deckert, Chem. Commun., 2014, 50, 11204–11207 RSC.
- W. Xie, C. Herrmann, K. Kompe, M. Haase and S. Schlucker, J. Am. Chem. Soc., 2011, 133, 19302–19305 CrossRef CAS PubMed.
- L. L. Kang, P. Xu, B. Zhang, H. H. Tsai, X. J. Han and H. L. Wang, Chem. Commun., 2013, 49, 3389–3391 RSC.
- W. Xie, B. Walkenfort and S. Schlucker, J. Am. Chem. Soc., 2013, 135, 1657–1660 CrossRef CAS PubMed.
- S. P. Zhang, H. Wei, K. Bao, U. Hakanson, N. J. Halas, P. Nordlander and H. X. Xu, Phys. Rev. Lett., 2011, 107, 096801 CrossRef.
- R. M. Stockle, Y. D. Suh, V. Deckert and R. Zenobi, Chem. Phys. Lett., 2000, 318, 131–136 CrossRef CAS.
- M. S. Anderson, Appl. Phys. Lett., 2000, 76, 3130–3132 CrossRef CAS PubMed.
- N. Hayazawa, Y. Inouye, Z. Sekkat and S. Kawata, Opt. Commun., 2000, 183, 333–336 CrossRef CAS.
- Z. Liu, S. Y. Ding, Z. B. Chen, X. Wang, J. H. Tian, J. R. Anema, X. S. Zhou, D. Y. Wu, B. W. Mao, X. Xu, B. Ren and Z. Q. Tian, Nat. Commun., 2011, 2, 305 CrossRef PubMed.
- M. D. Sonntag, D. Chulhai, T. Seideman, L. Jensen and R. P. Van Duyne, J. Am. Chem. Soc., 2013, 135, 17187–17192 CrossRef CAS PubMed.
- T. Deckert-Gaudig, E. Kammer and V. Deckert, J. Biophotonics, 2012, 5, 215–219 CrossRef CAS PubMed.
- R. Zhang, Y. Zhang, Z. C. Dong, S. Jiang, C. Zhang, L. G. Chen, L. Zhang, Y. Liao, J. Aizpurua, Y. Luo, J. L. Yang and J. G. Hou, Nature, 2013, 498, 82–86 CrossRef CAS PubMed.
- W. H. Zhang, B. S. Yeo, T. Schmid and R. Zenobi, J. Phys. Chem. C, 2007, 111, 1733–1738 CAS.
- B. Pettinger, Mol. Phys., 2010, 108, 2039–2059 CrossRef CAS PubMed.
- A. Rasmussen and V. Deckert, J. Raman Spectrosc., 2006, 37, 311–317 CrossRef CAS PubMed.
- T. Deckert-Gaudig and V. Deckert, Phys. Chem. Chem. Phys., 2010, 12, 12040–12049 RSC.
- R. Treffer, R. Bohme, T. Deckert-Gaudig, K. Lau, S. Tiede, X. M. Lin and V. Deckert, Biochem. Soc. Trans., 2012, 40, 609–614 CrossRef CAS PubMed.
- E. M. van Schrojenstein Lantman, T. Deckert-Gaudig, A. J. G. Mank, V. Deckert and B. M. Weckhuysen, Nat. Nanotechnol., 2012, 7, 583–586 CrossRef CAS PubMed.
- M. T. Sun, Z. L. Zhang, H. R. Zheng and H. X. Xu, Sci. Rep., 2012, 2 Search PubMed.
- Z. L. Zhang, S. X. Sheng, H. R. Zheng, H. X. Xu and M. T. Sun, Nanoscale, 2014, 6, 4903–4908 RSC.
- M. T. Sun, Z. L. Zhang, P. J. Wang, Q. Li, F. C. Ma and H. X. Xu, Light: Sci. Appl., 2013, 2 Search PubMed.
- M. T. Sun, Z. L. Zhang, L. Chen, S. X. Sheng and H. X. Xu, Adv. Opt. Mater., 2014, 2, 74–80 CrossRef CAS PubMed.
- M. T. Sun, Y. R. Fang, Z. Y. Zhang and H. X. Xu, Phys. Rev. E: Stat. Phys., Plasmas, Fluids, Relat. Interdiscip. Top., 2013, 87 Search PubMed.
- Z. L. Zhang, L. Chen, S. X. Sheng, M. T. Sun, H. R. Zheng, K. Q. Chen and H. X. Xu, Front. Phys., 2014, 9, 17–24 CrossRef PubMed.
- M. T. Sun, Y. R. Fang, Z. L. Yang and H. X. Xu, Phys. Chem. Chem. Phys., 2009, 11, 9412–9419 RSC.
- Z. L. Zhang, X. R. Tian, H. R. Zheng, H. X. Xu and M. T. Sun, Plasmonics, 2013, 8, 523–527 CrossRef CAS.
- Z. L. Zhang, L. Chen, M. T. Sun, P. P. Ruan, H. R. Zheng and H. X. Xu, Nanoscale, 2013, 5, 3249–3252 RSC.
- M. T. Sun, Z. L. Zhang, Z. H. Kim, H. R. Zheng and H. X. Xu, Chem. – Eur. J., 2013, 19, 14958–14962 CrossRef CAS PubMed.
- S. M. Nie and S. R. Emery, Science, 1997, 275, 1102–1106 CrossRef CAS PubMed.
- K. Kneipp, Y. Wang, H. Kneipp, L. T. Perelman, I. Itzkan, R. Dasari and M. S. Feld, Phys. Rev. Lett., 1997, 78, 1667–1670 CrossRef CAS.
- H. X. Xu, E. J. Bjerneld, M. Kall and L. Borjesson, Phys. Rev. Lett., 1999, 83, 4357–4360 CrossRef CAS.
| This journal is © The Royal Society of Chemistry 2015 |