
 Open Access Article
 This Open Access Article is licensed under a Creative Commons Attribution-Non Commercial 3.0 Unported Licence
A palm-size μNMR relaxometer using a digital microfluidic device and a semiconductor transceiver for chemical/biological diagnosis†
Ka-Meng
Lei
ab,
Pui-In
Mak
*ab,
Man-Kay
Law
a and
Rui P.
Martins
abc
aState-Key Laboratory of Analog and Mixed-Signal VLSI, University of Macau, China. E-mail: pimak@umac.mo
bFaculty of Science and Technology, Dept. of ECE, University of Macau, China
cOn leave from Instituto Superior Técnico, Universidade de Lisboa, Portugal
First published on 2nd June 2015
Abstract
Herein, we describe a micro-nuclear magnetic resonance (μNMR) relaxometer miniaturized to palm-size and electronically automated for multi-step and multi-sample chemical/biological diagnosis. The co-integration of microfluidic and microelectronic technologies enables an association between the droplet managements and μNMR assays inside a portable sub-Tesla magnet (1.2 kg, 0.46 Tesla). Targets in unprocessed biological samples, captured by specific probe-decorated magnetic nanoparticles (NPs), can be sequentially quantified by their spin–spin relaxation time (T2) via multiplexed μNMR screening. Distinct droplet samples are operated by a digital microfluidic device that electronically manages the electrowetting-on-dielectric effects over an electrode array. Each electrode (3.5 × 3.5 mm2) is scanned with capacitive sensing to locate the distinct droplet samples in real time. A cross-domain-optimized butterfly-coil-input semiconductor transceiver transduces between magnetic and electrical signals to/from a sub-10 μL droplet sample for high-sensitivity μNMR screening. A temperature logger senses the ambient temperature (0 to 40 °C) and a backend processor calibrates the working frequency for the transmitter to precisely excite the protons. In our experiments, the μNMR relaxometer quantifies avidin using biotinylated Iron NPs (Φ: 30 nm, [Fe]: 0.5 mM) with a sensitivity of 0.2 μM. Auto-handling and identification of two targets (avidin and water) are demonstrated and completed within 2.2 min. This μNMR relaxometer holds promise for combinatorial chemical/biological diagnostic protocols using closed-loop electronic automation.
1. Introduction
The overall goal of lab-on-a-chip devices is to miniaturize benchtop laboratory apparatus into handheld tools for point-of-care (POC) diagnosis, while featuring orders-of-magnitude reduction in hardware cost and sample use. This vision implies tantalizing advantages over laboratory tests,1–3 especially for rapid pre-screening of infectious diseases, e.g., human immunodeficiency virus, tuberculosis and Ebola in the (under-)developing world.2,4Although a wide variety of POC diagnostic tools have been reported such as the electrical sensing,5,6 magnetic sensing7,8 or optical detection,9,10 none of them has explored the prospects of micro-nuclear magnet resonance (μNMR) with advanced microfluidic and microelectronic technologies. General NMR systems have been proven as a reliable tool for the diagnosis of a wide range of biological targets such as oligonucleotides,11 proteins,12,13 Mycobacterium tuberculosis14 and cancer cells,15 specifically by the pre-designed probe-decorated nanoparticles (NPs). The existence of targets will capture the probe-decorated NPs and thus decrease the spin–spin relaxation time (T2) of the samples. Moreover, inspired by the sensitivity improvement of complementary metal-oxide-semiconductor (CMOS) μNMR transceiver chips, a number of recent reports have focused on miniaturizing the weight and size of NMR systems.15–17 With a moderate magnetic field (<1 T) handheld magnet (weight <7.3 kg), it was possible to demonstrate the detection of biological targets and the observation of molecular structures to achieve a POC diagnosis platform where a high magnetic field is nonessential.
Regrettably, restrained by the limited inner volume of a high-homogeneity handheld magnet, sample management poses a substantial barrier for μNMR systems. As the opening gap of the magnet can be only 32 mm × 14 mm, sample placement and mixing of the probe-decorated NPs with the samples under analysis have to be manually pre-treated outside the magnet. Confounded by these operations that heavily rely on human efforts, the reproducibility of the results and throughput are deteriorated while raising the chance of sample contamination. Despite several reports that have managed to surmount sample manipulation for NMR including capillary electrophoresis18 and microfluidic channels,13,19 they still fail to avoid non-integrated laboratory gadgets, e.g., micro-pumps and valves.
Unlike conventional channel microfluidics, digital micro-fluidics (DMF) is highly amenable for co-integration, electronic automation and re-configuration.20–23 DMF is also bio-compatible and has been adopted in a wide variety of applications, including cell culturing,24–26 DNA amplification27–29 and single protein molecule capturing.30 Microdroplets (e.g., <10 μL) in the DMF device can be transported over an electrode array by modifying the surface tension of the electrode utilizing the principle of electrowetting-on-dielectric (EWOD). Such distinct microdroplet controllability renders the DMF a promising droplet management platform for POC devices, particularly for co-integration with μNMR.31 However, confounded by the unintegrated DMF device and discrete electronics, only manual droplet operation with one sample and one target was demonstrated, while lacking of position feedback to master the route of the droplets and temperature tracking to compensate the magnetic field variation.
This study describes the first palm-size electronic-automated μNMR relaxometer co-integrated with DMF and an optimized butterfly-coil-input CMOS transceiver to extend the capability and enhance performance. The former allows multiple-sample management in real-time with position feedback for flexible and automatic droplet manipulation and reaction, attaining a close-loop control for the system to master the entire operation of the droplets efficiently. The latter is enabled by analog circuit techniques together with the cross-domain design and modelling to culminate in low-power high-sensitivity μNMR screening within the limited inner volume of the magnet. It features a 1000× electronics volume shrinkage with an integrated low-pass filter compared to its modular counterpart. The development of μNMR systems over the past decade is depicted in Table 1 and Fig. S1 in the ESI.† Herein, the μNMR relaxometer is co-integrated with a DMF device to support multi-step and multi-sample diagnosis in a portable platform. The entire DMF protocol involves software control and hardware actuation and sensing to master the operation of the droplets. This co-integration of distinct technologies enables multiple and simultaneous chemical/biological diagnosis in a unified experiment that is crucial for bio-assays.32 In addition, as the DMF device is integrated with the μNMR model onto the same printed circuit board (PCB) substrate, the suppressed variation of droplet position culminates in the high reproducibility of the diagnostic results. Finally, a temperature-tracking local oscillator (LOref) is also adopted to enhance the robustness of the μNMR relaxometer over a wide range of ambient temperature (0 to 40 °C). When compared to the extant temperature compensation method,17,33 this scheme is more promising and befitting to rapid and portable diagnostic tool as it refrains from sweeping over a wide range of LOref frequency or entailing massive computation, which are time and power consuming. This multidisciplinary platform holds the promise for providing a potential solution for POC diagnosis systems.
| N. Sun et al. (2009, 2011)15,16 | D. Ha et al. (2014)17 | K.-M. Lei et al. (2014)31 | This work | |
|---|---|---|---|---|
| NMR type | Relaxometry | Spectroscopy | Relaxometry | Relaxometry |
| Coil type | Off-/on-chip | Off-chip | Off-chip PCB | Off-chip PCB |
| Spiral | Solenoid | Butterfly | Butterfly | |
| Magnet (B-field, weight and size) | 0.5 T, 1.2 kg, ∅ 8 cm × H 5 cm | 0.51 T, 7.3 kg, ∅ 11.8 cm × H 12.6 cm | 0.5 T, 1.2 kg, ∅ 8 cm × H 5 cm | 0.5 T, 1.2 kg, ∅ 8 cm × H 5 cm |
| Sample management | Manual (direct on coil) | Manual (capillary injection) | Limited (without feedback and timing) | Automatic (real-time feedback) |
| Sample per experiment | Single | Single | Single | At least 2 distinct samples |
| Pre/post-sample reaction supportability | No | No | Restricted (due to limited electrodes) | Flexible (e.g., merge, separate, translate) |
| Calibration of magnetic field fluctuation | No | Offline (by software) | No | Online (by hardware) |
2. Materials and methods
2.1 System assembly
An overview of the μNMR relaxometer is exemplified in Fig. 1. It can be divided into two parts: μNMR and DMF modules. The μNMR module includes: (i) a CMOS transceiver to excite and receive signals from the samples, (ii) a butterfly-coil fabricated on the PCB to transduce between magnetic and electrical signals inside the space limiting magnet (volume: 28.9 cm3), and (iii) peripheral voltage and current regulators to power up and bias the CMOS transceiver.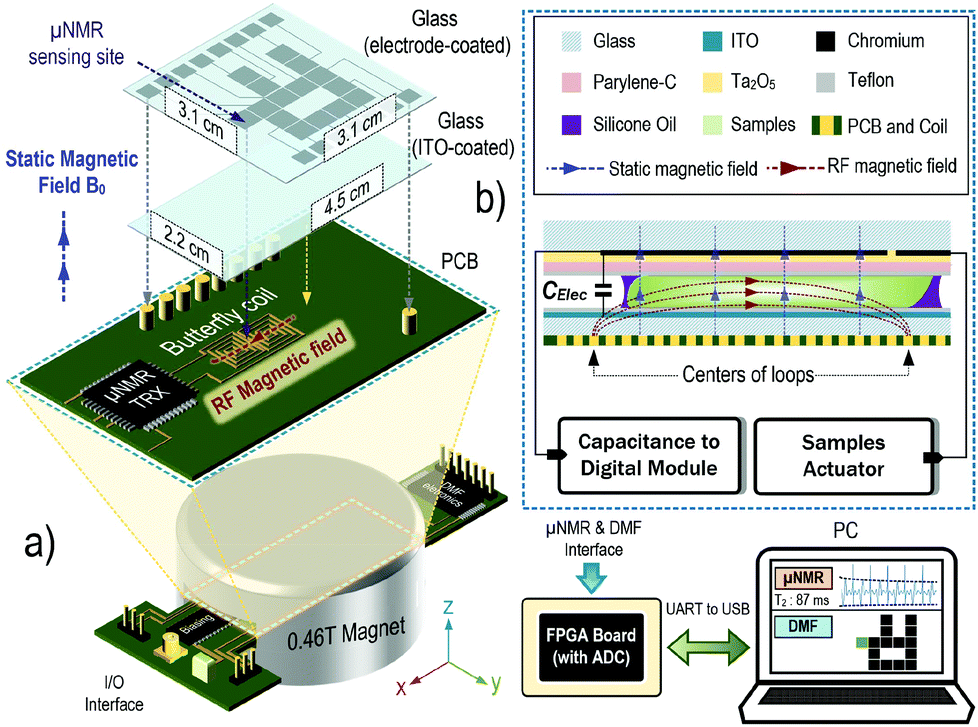 | ||
| Fig. 1 (a) Illustration of the reported μNMR relaxometer. The portable magnet greatly reduces the weight and size of the μNMR analysis, while the CMOS transceiver can provide high sensitivity, rendering it as a befitting μNMR relaxometer for POC applications. The DMF device is integrated with the μNMR to transport the samples under analysis automatically. The butterfly-coil, placed directly underneath the DMF device, is capable of generating the magnetic field in the x-direction, thus orthogonal to the static magnetic field (z-direction) and efficaciously utilizes the inner space of the magnet. The μNMR is controlled by the FPGA board, which is linked with the PC for visualizing the μNMR results and providing a graphical user interface. (b) The brief assembly of the DMF device. The droplets are squeezed inside the DMF device and the butterfly coil is placed underneath the DMF device for μNMR screening. The sample actuator and capacitance-to-digital module form a closed-loop control to govern the location of the droplets. The step-by-step assembly as well as the operation of the μNMR relaxometer can be found in the ESI video 1.† | ||
The DMF module composes of: (i) a DMF device in which the samples are placed and transported; (ii) the sample actuator that controls the pulse applied on each electrode; and (iii) a capacitance-to-digital module that scans the real-time capacitance of each electrode and reports the vacant sites.
The experimental setup is depicted in Fig. 2(a). The system operation is centralized on a personal computer (PC), including the setup of μNMR parameters, display of μNMR results and droplet routing and positioning. The PC is linked with the field programmable gate array (FPGA) board to control the device-level hardware using the universal asynchronous receiver/transmitter (UART). The key functional blocks and their intercommunication are given in detail in ESI.†
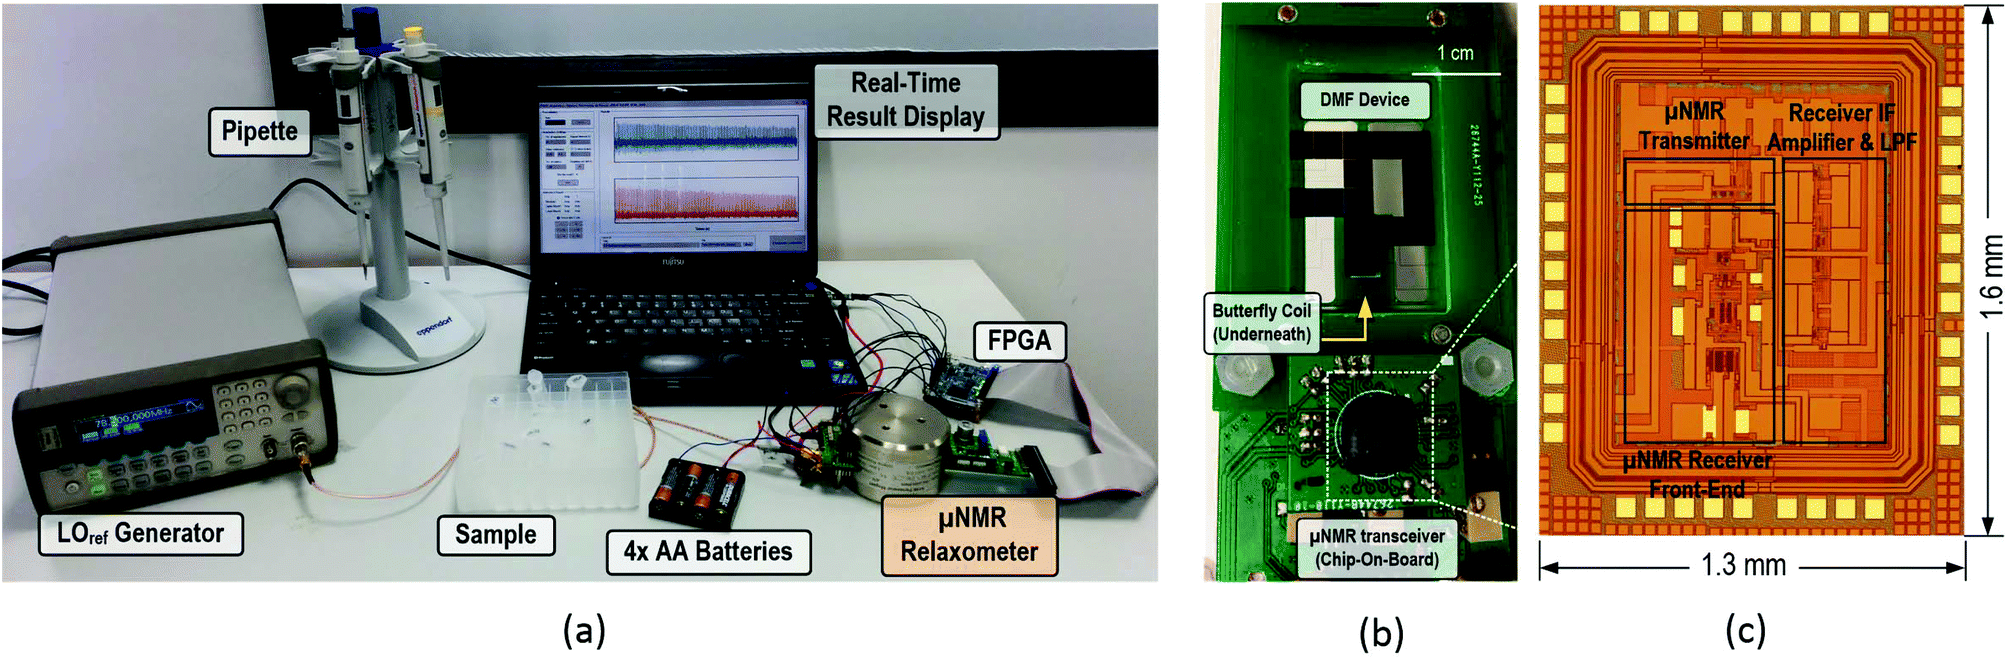 | ||
| Fig. 2 (a) The entire setup of the μNMR relaxometer and peripheral devices including the FPGA to control the device level hardware, a PC for real-time results display and setting up of the experimental parameters (pulse width, number of echoes and echoes spacing), batteries for powering up the μNMR relaxometer and a signal generator to provide LOref signal for the relaxometer. The samples are placed inside the DMF device using the pipette before the experiments. (b) The assembly of the CMOS μNMR transceiver, DMF device and the butterfly coil. The DMF device is placed on top of the butterfly coil, which is connected to the μNMR transceiver to excite the samples inside the DMF device and sense the resultant RF signal. (c) An image of the CMOS transceiver die. The overall size of the die is 1.6 × 1.3 mm2. | ||
2.2 μNMR principle
The principle of NMR and μNMR is to observe the resonant behaviour of the non-zero spin nuclei (i.e., 1H, 13C, 17O and 31P) with radio-frequency (RF) excitation signals acting on them in the presence of an orthogonal static magnetic field . With
  acting on the non-zero spin nuclei, they magnetize in the direction of
  and stay in equilibrium. If an excitation RF signal with a frequency equal to the Larmor frequency of the nuclei is applied on the nuclei orthogonally, the nuclei will start to precess around
  to exchange resonant energy between RF magnetic fields and nuclear spins, and hence the net magnetization will deviate from
  with tip angle θ. The nuclei will not precess if the excitation signal falls outside this Larmor frequency, which can be derived as:
| fL = γB0 | (1) |
 with θ = 90° and the excitation signal will be turned off. The nuclei will still oscillate at fL and decay exponentially at T2, which is influenced by the environment sensed by the nuclei. This parameter can reveal the physical properties of the samples.
2.3 DMF device and electronic
The DMF device shown in the inset of Fig. 1 consists of two parallel glass plates fit-in the 32 mm inner width of the magnet. The top plate (thickness: 1.5 mm) is coated with 15 chromium electrodes (each 3.5 × 3.5 mm2), first for droplet control, followed by multi-layer dielectric materials to enhance the EWOD force, thus reducing the threshold driving voltage.21 The ITO (Indium Tin Oxide) coated glasses were purchased from HuaNan Tehnology Ltd (China) to serve as the bottom plate of the DMF device. The specified sheet resistance of the ITO is 100 Ω sq−1. It serves as the ground and has a thickness of 0.5 mm, 3× thinner than the top plate rendering it suitable for μNMR screening underneath. The final coating for both plates is a hydrophobic Teflon® layer for smooth droplet actuation. Details of the fabrication procedure for the DMF device can be found in the ESI.† The volume of liquid under testing per electrode (without mixing) is 8 μL unless specified otherwise. The DMF device and its assembly are depicted in Fig. 2(b).The electrodes are actuated by a 40 Vpp square wave with a frequency of 1 kHz. The on (off) duty cycle is 10% (90%) to strap the droplets, while reducing the RMS-voltage stress on the electrode to minimize the risk of dielectric breakdown (Fig. S9 in the ESI†).34 This driving signal on the NMR sensing site is switched off during the NMR experiment to prevent interference on the sensitive NMR receiver. To further enhance the portability of the system, an electronic boost converter is used to generate the square wave so as to circumvent the use of an extra high voltage supply. The position of the droplet is sensed by a capacitance-to-digital module. A detailed schematic of the DMF electronic device is included in the ESI.†
2.4 Portable permanent magnet
The portable magnet PM-1055 obtained from Metrolab Technology SA (Switzerland) is adopted in this system with nominal magnetic field of 0.5 T (±0.05 T). It has an opening gap with a dimension of 32 mm × 14 mm and a weight of 1.25 kg. The magnetic field at different temperature is measured using a Tesla Meter DTM-150 with probe LPT-130 obtained from Group3 Technology Ltd (New Zealand) inside the temperature chamber SH-261 obtained from ESPEC North America, Inc. (Hudsonville, MI).2.5 Samples
De-ionized water was tested firstly to show the functionality of the μNMR relaxometer. Silicone oils (polydimethylsiloxanes) of 1 cSt viscosity from Clearco Products Co., Inc. (Bensalem, PA) are used as the filler medium to smoothen the droplet movement due to their low surface tension and prevent sample evaporation. Copper(II) sulfate solutions were prepared from CuSO4·5H2O purchased from Aladdin® (Industry, CA). Avidin powder was purchased from Sigma-Aldrich Co. (St. Louis, MO) and biotinylated magnetic NPs (Φ: 30 nm) were purchased from Nanocs Inc. (New York, NY). The concentration of biotinylated magnetic NPs used throughout the experiment is 0.5 mM.2.6 μNMR CMOS transceiver
The μNMR transceiver was designed in 0.18 μm CMOS process by EDA tool Vituoso Platform from Cadence Design Systems, Inc. (San Jose, CA) and fabricated by GlobalFoundries Inc. (Santa Clara, CA) with one polysilicon layer and six metal layers. An image of the die is shown in Fig. 2(c). The transmitter is equipped with a state control, a pulse sequence synthesizer and a power amplifier to generate the Carr–Purcell–Meiboom–Gill (CPMG) pulse sequences and excite the samples via the butterfly-coil. For the receiver, it is headed by a multi-stage low-noise amplifier to boost the gain and enhance the signal-to-noise ratio (SNR) of the experiments, followed by a pair of quadrature mixers down converting the RF signal to intermediate frequency (IF) for filtering. A dynamic-bandwidth low pass filter was designed to rapidly recover from the dead time and manage the uncertain IF. The filter is a 6th-order Butterworth filter using the source-follower-based topology. The overall receiver has a simulated input-referred noise of 0.92 nV/√Hz. The die is bonded on the PCB by chip-on-board technology with encapsulated sealing to reduce the lead inductance.The CMOS transceiver is powered up by batteries and regulated with a 1.8 V low-dropout regulator. The butterfly-coil, which transduces between the magnetic field and voltage signals, can effectively utilize the inner space of the magnet by generating a surface-parallel RF-magnetic field orthogonal to the static magnetic field. It was fabricated on the PCB with a conductor width of 0.15 mm and spacing of 0.15 mm. The coil's parameter and geometry optimization are studied in finite element analysis simulator COMSOL Multiphysics® (Burlington, MA) and is detailed in the ESI.† The signal generator 33250A obtained from Agilent Technologies (Santa Clara, CA) serves as a voltage-controlled oscillator, providing the LOref signal for the μNMR relaxometer, which can be replaced by an on-chip phase-locked loop if desired. The temperature sensor MAX6612 obtained from Maxim Integrated (San Jose, CA) is used to sense the ambient temperature. The detailed design and schematic as well as the measurement results of the CMOS transceiver and the peripheral electronic are discussed in the ESI.†
2.7 μNMR experimental parameters
The π/2 pulse width for the butterfly coil was found to be 150 μs. A CPMG pulse sequence was used to excite the protons and refocus the dephasing magnetization attributed to the inhomogeneous magnetic field. Relaxometry is chosen for this system as it poses a flexible requirement on the magnet hence the volume and weight of the magnet can be reduced compared to spectroscopic counterpart, rendering it favourable to POC diagnosis. The spacing between the echoes were set to 4 ms for all cases. The samples were halted for 6 s upon arrival on the μNMR sensing site for the stabilization of the hydrogen nuclei. The experiments were repeated 8 times to enhance the SNR and the time interval between the successive experiments was set at 6 s.2.8 μNMR signal post-processing
The μNMR results were recorded and digitized by an Analog-to-Digital Converter ADC128S022 obtained from Texas Instruments Inc. (Dallas, TX) with 12-bit resolution. Thereafter, the raw data were sent to the PC and the I/Q channel data were demodulated with a Hilbert transformer to reject the image noise. The spin–spin relaxation time was derived using a nonlinear regression model. The T2 spectrum of the samples was obtained by performing an inverse Laplace transform on the echoes amplitude in MATLAB from MathWorks, Inc. (Natick, MA).3. Results
3.1 Temperature-tracking LOref generation
The neodymium magnet is sensitive to temperature (stated −1200 ppm K−1). Thus, albeit at room temperature, the Larmor frequency of the proton shifts ∼25.5 kHz per 1 °C variation. Confounded by the narrow bandwidth of the excitation signal (18.8 kHz for 300 μs refocusing pulses) attributed to the low voltage CMOS transceiver, this frequency shift causes the μNMR relaxometer to malfunction, and calibration of the local oscillator (LOref) frequency is therefore necessary. To achieve this, a temperature-tracking LOref generator was developed. As shown in Fig. 3(a), a temperature sensor detects the ambient temperature and the processor (PC here) reads the corresponding digitized value and calculates the corresponding temperature. Consequently, the processor can calibrate the required working frequency for the LOref and drive the digital-to-analog converter (DAC) with a proper code. The output of the DAC is fed into the signal generator and the frequency of the LOref is altered by the output of the DAC, thus matching the Larmor frequency of the proton, which is shown in eqn. (1) linearly proportional to the magnetic field, with the excitation frequency. Fig. 3(b) depicts the magnetic field and temperature sensor output versus temperature. Both of them show a linear relationship with the temperature and thus the Larmor frequency can be calibrated from the temperature. This feature enables the system to work in an environment where the ambient temperature ranges from 0 to 40 °C, while raising the robustness of the μNMR relaxometer.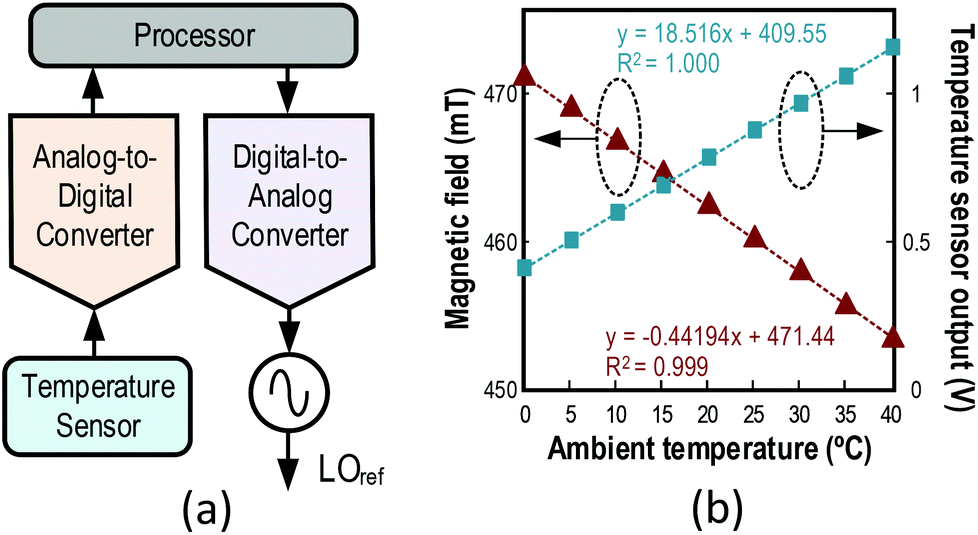 | ||
| Fig. 3 (a) Schematics of the temperature-tracking LOref generator. A temperature sensor is used to sense the ambient temperature and the result is digitized and read by the processor. The required working frequency for the LOref is then calculated by the processor and the processor drives the digital-to-analog converter, which alters the output frequency of the signal generator thus befitting with the Larmor frequency of the protons. (b) The measured result for the magnetic field of the magnet and temperature sensor output over temperature. Both of them show a great linearity (R2 > 0.999) hence the required LOref frequency can be calculated from the temperature sensor output. | ||
3.2 Operation of water droplet
A de-ionized water sample was used experimentally to demonstrate the functionality of the μNMR relaxometer. The droplet is placed on an arbitrary electrode and the DMF device can auto-locate the droplet by scanning and comparing the pulses counted at each electrode. With a droplet sandwiched between the electrode and the ITO, the capacitance of the corresponding electrode increases because the permittivity of water is 80× of air. As shown in Fig. 4(a), the average pulse counted on the occupied and vacant electrodes are 277.5 and 757.7, respectively. This 2.73× difference is sufficient to identify whether the electrodes are occupied by the droplets. This sensing module is critical in this two dimensional DMF device as the relaxometer entails handling of multiple droplets. Moreover, with this sensing module adopted, the system is under a close-loop control to attain an efficient droplet management scheme. The operation of the droplets including the trigger of the NMR experiment, stabilization of the hydrogen nuclei before the NMR experiment and anti-merging droplets paths can be manipulated and optimized by the software within the shortest time to boost the efficiency and throughput of the system.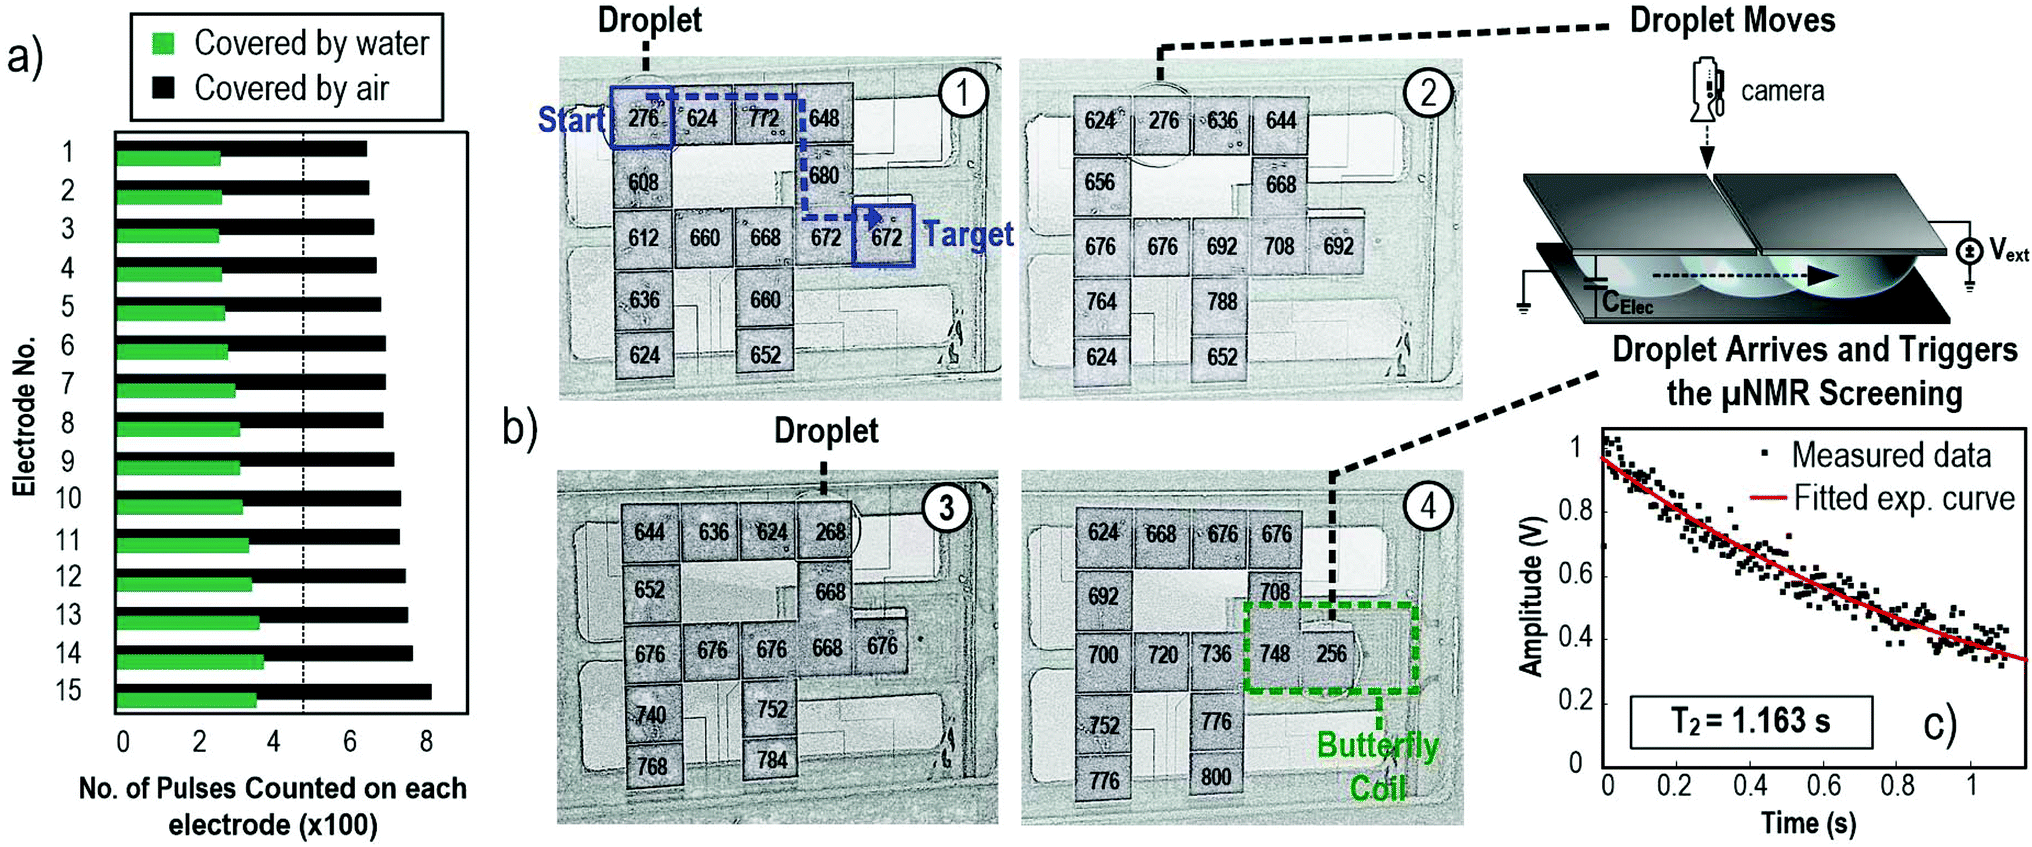 | ||
Fig. 4 (a) The pulses counted on the electrodes covered by air and water, respectively. As the permittivity of water is substantially larger than air (80![[thin space (1/6-em)]](https://www.rsc.org/images/entities/char_2009.gif) :1), the capacitance of the electrode covered by water has a higher capacitance, causing lower pulses to be counted and thus the system can detect if the electrode is vacant. (b) The images taken outside the magnet demonstrate the movement of the droplets. The real-time pulses counted on the electrodes are marked. The droplet is initially placed on an arbitrary electrode (upper left in the image) and the system detects the location of the droplet by comparing the pulse counted on the electrodes. After the droplet is located, it is guided to the μNMR sensing site progressively (from 1 to 4). (c) Once the droplet arrives at the μNMR sensing site, the μNMR experiment will be triggered and the echoes amplitude of the samples will be collected (256 echoes). The visualized operation of the μNMR relaxometer is shown in video 2 (ESI†). :1), the capacitance of the electrode covered by water has a higher capacitance, causing lower pulses to be counted and thus the system can detect if the electrode is vacant. (b) The images taken outside the magnet demonstrate the movement of the droplets. The real-time pulses counted on the electrodes are marked. The droplet is initially placed on an arbitrary electrode (upper left in the image) and the system detects the location of the droplet by comparing the pulse counted on the electrodes. After the droplet is located, it is guided to the μNMR sensing site progressively (from 1 to 4). (c) Once the droplet arrives at the μNMR sensing site, the μNMR experiment will be triggered and the echoes amplitude of the samples will be collected (256 echoes). The visualized operation of the μNMR relaxometer is shown in video 2 (ESI†). | ||
After the identification of the droplet location, the program starts to transport the droplet to the μNMR sensing site. The droplets are guided to the destination gradually with their positions tracked in real-time to ensure successful movement. To visualize these movements, the entire journey was recorded outside the magnet, as shown in Fig. 4(b). The droplets are transported with a velocity of 1.17 mm s−1 (i.e., 3 s per electrode). The snapshots of droplet moving between neighbouring electrodes are shown in Fig. S11 of the ESI.† Upon the droplet arrival, the μNMR experiment is triggered after 6 s and the T2 of the sample is derived, as depicted in Fig. 4(c), by applying the CPMG pulse sequence on the droplet. The CPMG pulse sequence can recover the hastened damping NMR signal attributed to the field inhomogeneity of the magnet by refocusing the dephasing spins across the droplet.
Silicone oil is commonly utilized in DMF to smoothen the droplet operation. Yet it contains hydrogen atoms (formula: [–Si(CH3)2O–]n) that will affect the μNMR result. To evaluate the interference observed from silicone oil, the T2 variation of the samples (i.e., water) with different volumes of silicone oil is shown in Fig. 5(a). With an increasing amount of silicone oil, the T2 of the sample deviates from its original value. A volume of 1.6 μL of silicone oil shell (<0.1 mm) is chosen to surround the samples for minimum interference to the μNMR result (ΔT2 < 5%), while preserving its function in smoothening the droplet motion. The T2 spectrum of the resulting samples and oil formation is plotted in Fig. 5(b), showing the desired single decaying exponential pattern.
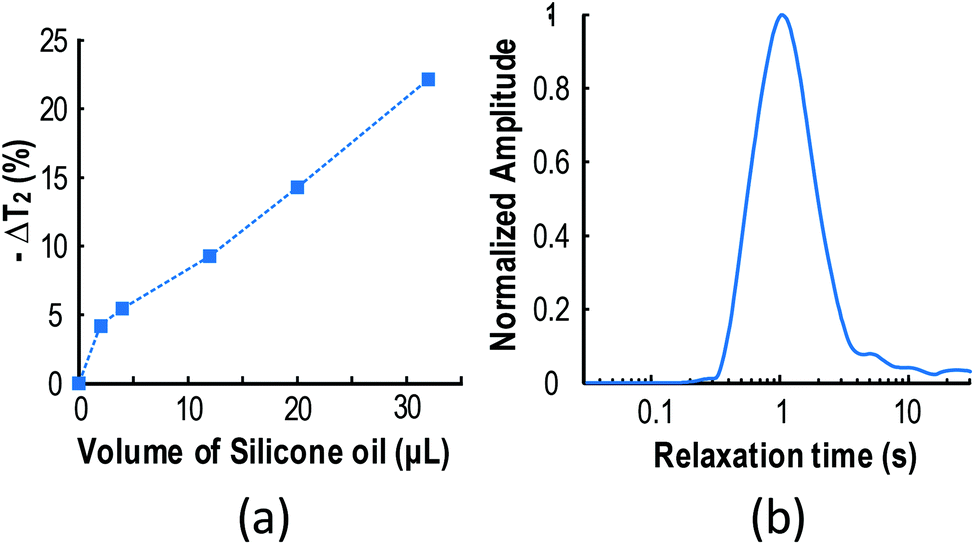 | ||
| Fig. 5 (a) The interference of silicone oil on the T2 of deionized water. As the amount of silicone oil surrounding the droplets increases, the T2 deviates from its original value (without silicone oil). (b) The T2 spectrum of the samples enclosed with 1.6 μL of silicone oil, showing a singular exponential decay for the samples. | ||
3.3 Chemical/biological samples quantification
The capability of quantifying chemical and biological targets using the μNMR relaxometer was studied. Paramagnetic CuSO4 ions have a high magnetic susceptibility of 1330 × 10−6 cm3 mol−1. It will perturb the local field of the surrounding protons and shorten the T2 and thus it is used as the test agent in the first experiment. As shown in Fig. 6(a), the μNMR relaxometer can detect the CuSO4 concentration with respect to T2−1.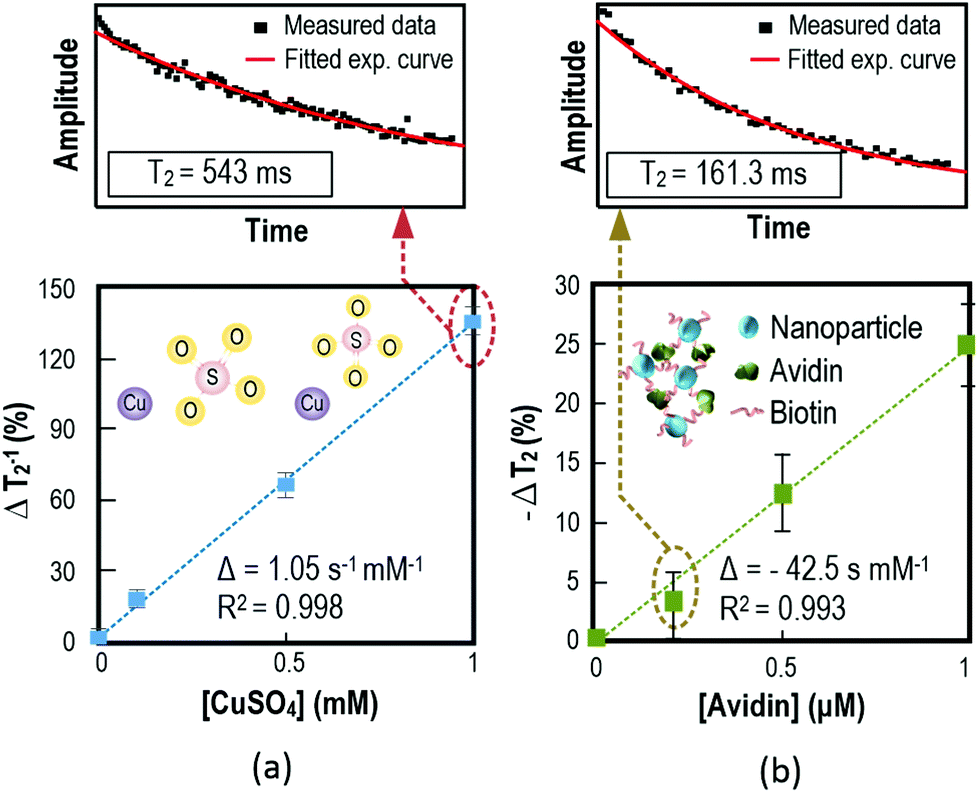 | ||
| Fig. 6 (a) The correlation of ΔT2−1 (with reference to 0 mM of CuSO4) with the concentration of CuSO4, which shows a linear dependency. The paramagnetic CuSO4 ions perturb the local field and thus shorten the T2 of the protons. The echoes amplitude for the case of CuSO4 at 1 mM concentration is plotted above. 128 echoes were collected for each single experiment. (b) The correlation of ΔT2 (with reference to 0 μM of avidin) with the concentration of avidin, which shows a linear dependency. Avidin bonds with biotin, which is attached on the iron NPs and forms NP micro-clusters and thus shortens the T2 of the samples. The echoes amplitude for the case of avidin at 0.2 μM concentration is plotted above. 64 echoes are collected for each single experiment. | ||
The second experiment demonstrates the capability of the system to pinpoint specific biological targets with pre-designed probe-decorated NPs. Iron NPs with biotin labeling were used as a probe to quantify avidin in the samples. The biotinylated magnetic NPs bond with avidin to yield NP micro-clusters, which shorten the T2 of the proton attributed to the super-paramagnetism of iron NPs. Fig. 6(b) depicts the experimental results and shows that the T2 value decreases proportionally to the concentration of avidin with an achieved sensitivity of 0.2 μM. These experiments demonstrate that the μNMR relaxometer is capable of handling and quantifying chemical and biological targets.
3.4 Multi-step multi-sample droplet operation
One unique feature of this μNMR relaxometer is the capability to handle distinct samples and perform μNMR experiments on them sequentially. This is attributed to the expanded two-dimensional electrodes, which benefit from the compact CMOS transceiver. This feature is demonstrated by placing two stationary targets and two identical probe-decorated NP droplets inside the DMF device at the same time. Because the relaxometer has to handle multiple samples, it is crucial to distinguish the droplets and project individual paths for them without the risk of fortuitous mixing. As the location of the droplets can be tracked by the capacitance-to-digital module, their individual paths can be procured at a software level. As shown in Fig. 7(a), the 1st probe-decorated NP droplet (7.5 μL) is guided to a stationary target (2.5 μL) for mixing and then to the μNMR sensing site to extract the T2. Concurrently, the 2nd probe-decorated NP droplet is guided to another target for mixing. The 1st mixture is led away from the μNMR sensing site after finishing the diagnosis in 48 s, allowing the 2nd mixture to enter. The assays are completed after the 2nd mixture finished μNMR screening and the raw data is processed using the PC for concentration quantification (T2 for the water sample: 256 ms; for avidin: 211 ms). Two or more probes and targets pairs can be placed inside the DMF device for enhancing the throughput of the relaxometer, depending on the geometry of the DMF electrodes.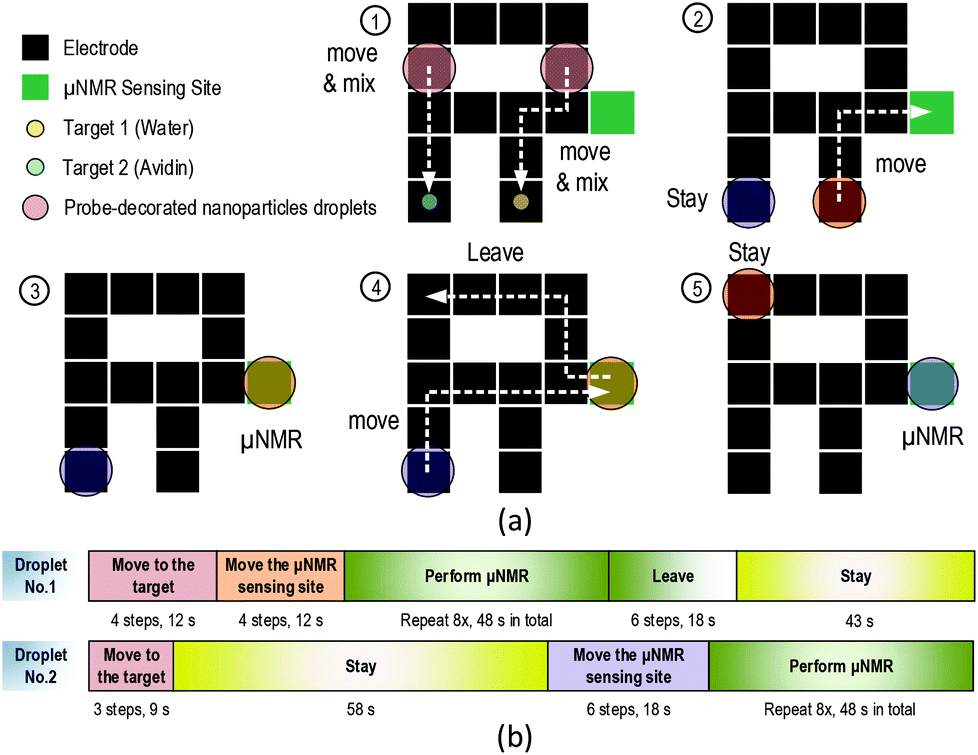 | ||
| Fig. 7 (a) Illustration of the motions of the droplets for multi-step multi-sample handling. Two identical probe-decorated NP droplets are placed inside the DMF device together with two targets (water as control and avidin). The probe-decorated NP droplets are then gradually transported to the target site for mixing with the target. After mixing, one of the mixture droplets is transported to the μNMR sensing site while the other stays on its electrode. When the first mixture droplet finishes the μNMR analysis, it is guided away from the μNMR sensing site and the second mixture enters. These operations demonstrate that the μNMR relaxometer can handle and perform multi-step and multi-sample μNMR analysis. T2 for the water sample: 256 ms; for avidin: 211 ms. (b) A Gantt chart of the operation of an individual droplet. With software control on the computer, the route of the droplets, the protocols can be optimized and the duration of the experiment can be minimized. The turnaround time for the experiment is 2.2 ms. | ||
The timing diagram of the μNMR relaxometer operation is shown in Fig. 7(b). With the droplet movement controlled by the program automatically and their positions tracked in real-time, the optimization of the route and timing management can be done at a software level. The fastest protocol can be found and applied to the DMF device. This 2.2 min experiment validates the entire system as being capable to transport, mix and analyse multiple distinct samples in real-time, while reducing the labor work (error) and the risks of defilement.
Another experiment reveals the capability of the relaxometer to handle the sample prior to/after NMR sensing. A droplet, which acts as a probe (water), is placed on an arbitrary position inside the DMF device together with two targets (2 nanomole of CuSO4 individually), as shown in Fig. 8(a). First, the probe is guided to the sensing site for recording the original T2. Afterwards, the droplet is guided and mixed with the 1st target. The T2 of the resulting mixture is then recorded for concentration identification. Subsequently, the droplet is mixed with the 2nd target and the T2 of the mixture is analysed again. As shown in Fig. 8(b), this experiment successfully pinpoints the amount of analytes that exist in the multiple targets in a multi-step fashion, benefitting from the droplet management capability and the expanded DMF electrode array, for the proposed relaxometer.
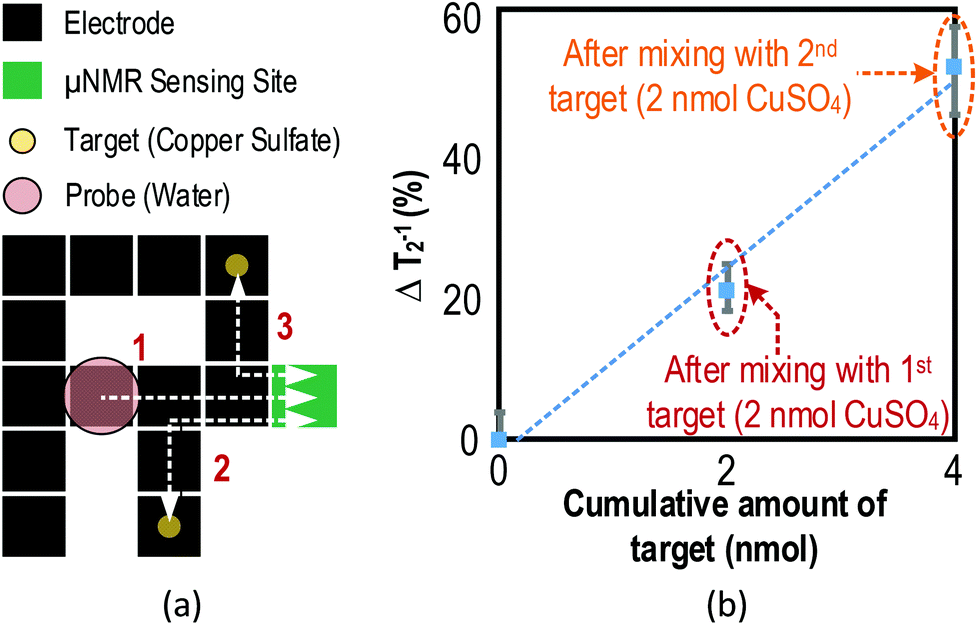 | ||
| Fig. 8 (a) Illustration of the multi-step experiment. The probe (water alone) is first guided to the NMR sensing site for recording the spin–spin relaxation time as reference. Then, it is mixed with the 1st target and the mixture is transported to the NMR sensing site for concentration identification. Subsequently, the droplet is mixed with the 2nd target and the resulting droplet is driven to the NMR sensing again for quantification. The sequence of the droplet operations are marked on the figure. (b) Variation of T2 upon reaction with CuSO4 ions. The T2 of the droplet is changed upon mixing with the CuSO4 ions, which reveals the capability of the relaxometer to perform a multi-step NMR experiment. | ||
4. Discussion
The proposed electronic-automated μNMR relaxometer surpasses existent μNMR systems as it can simultaneously quantify multi-biomarkers in a single experimental setup by manipulating the samples utilizing the DMF device, as demonstrated in the experiments. In addition to the time-multiplexing assay, the throughput can be elevated by adopting a multiple butterfly-coil inside the magnet. As shown in Fig. 9, a transceiver built with multiple receivers can be used to receive and process the signals from multiple butterfly-coils for higher throughput and space utilization.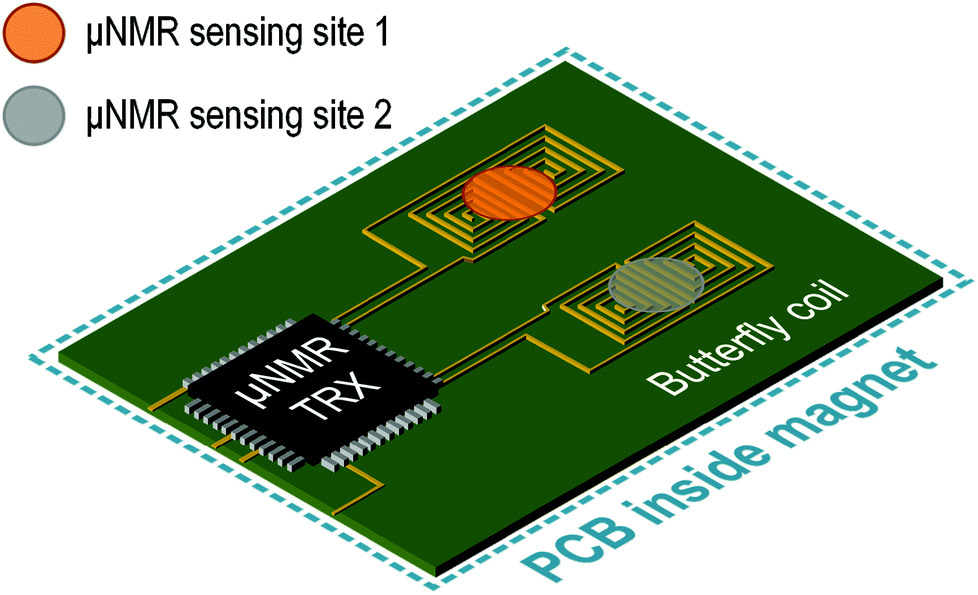 | ||
| Fig. 9 Illustration of the multi-butterfly-coil μNMR relaxometer. By integrating multiple receivers inside the CMOS transceiver together with the multiple butterfly-coil, the throughput of the assay can be further increased to befit a simultaneous multi-biomarker targeting. For simplicity, the DMF device is omitted in this figure. | ||
In addition, attributed to the non-invasive and contactless properties of μNMR, this μNMR relaxometer integrated with a DMF device can be extended by introducing other DMF-compatible protocols to further enhance the applicability of the system. Exemplification includes cell isolation,35 cell culturing, DNA amplification and electroimmunoassay36 inside the DMF device. These protocols can be utilized with extant NMR analytic techniques to culminate in a unified and integrated solution for lab-on-a-chip assays. Moreover, a thermal heater can also be integrated inside the DMF device to alter the temperature of the droplets,37 which opens up the possibility to investigate temperature related NMR assays on biological samples.38 Furthermore, multimodal analysis where different aspects of the sensing technique such as optical sensing39 or impedance sensing40 combined with the μNMR system can be implemented inside the DMF device to provide complementary analytes information.
5. Conclusions
A portable μNMR relaxometer capable of handling multi-step multi-sample protocols is demonstrated for the first time. It is equipped with a semiconductor transceiver to reduce the overall dimensions of the module while improving the sensitivity. The transceiver's input network is a PCB-fabricated butterfly coil to better utilize the inner space of the handheld magnet. Inside the magnet, the electronic-automated DMF device with closed-loop capacitive feedback manages multiple droplet samples in real-time and can be reconfigured by software. A number of experiments validate the μNMR relaxometer as being competent to achieve the real-time quantification of chemical/biological analytes in sub-10 μL samples, capable of manipulating multiple samples automatically and performing multi-step experiments inside the space-limiting magnet effectively. When compared to conventional micro-channel NMR systems, this work offers a more flexible and electronically automated method to handle multi-step multi-sample diagnostic protocols.Acknowledgements
The authors gratefully acknowledge J. Gao for fabricating the DMF chips and D. Y. Zhao for assisting the implementation of the CMOS transceiver. This work is funded by the University of Macau and Macau Science and Technology Development Fund (FDCT) under the project (033/2011/A2) and the State Key Lab fund.Notes and references
- C. D. Chin, V. Linder and S. K. Sia, Lab Chip, 2007, 7, 41–57 RSC.
- P. Yager, G. J. Domingo and J. Gerdes, Annu. Rev. Biomed. Eng., 2008, 10, 107–144 CrossRef CAS PubMed.
- D. A. Giljohann and C. A. Mirkin, Nature, 2009, 462, 461–464 CrossRef CAS PubMed.
- D. G. Storla, S. Yimer and G. A. Bjune, BMC Pub. Health, 2008, 8, 15–23 CrossRef PubMed.
- E. W. M. Kemna, L. I. Segerink, F. Wolbers, I. Vermes and A. Berg, Analyst, 2013, 138, 4585–4292 RSC.
- J. O. Esteves-Villanueva, H. Trzeciakiewicz and S. Martic, Analyst, 2014, 139, 2823–2831 RSC.
- P. Liu, K. Skucha, M. Megens and B. Boser, IEEE Trans. Magn., 2011, 47(10), 3449–3451 CrossRef PubMed.
- A. Pai, A. Khachaturian, S. Chapman, A. Hu, H. Wang and A. Hajimiri, Analyst, 2014, 139, 1403–1411 RSC.
- M. Safavieh, M. U. Ahmed, E. Sokullu, A. Ng, L. Braescu and M. Zourob, Analyst, 2014, 139, 482–487 RSC.
- E. Wajs, F. Caldera, F. Trotta and A. Fragoso, Analyst, 2014, 139, 375–380 RSC.
- L. Josephson, J. M. Perez and R. Weissleder, Angew. Chem., Int. Ed., 2001, 113(17), 3304–3306 CrossRef.
- J. M. Perez, L. Josephson, T. O'Loughlin, D. Högemann and R. Weisselder, Nat. Biotechnol., 2002, 20, 816–820 CrossRef CAS PubMed.
- H. Lee, E. Sun, D. Ham and R. Weissleder, Nat. Med., 2008, 14(8), 869–874 CrossRef CAS PubMed.
- M. Liong, A. N. Hoang, J. Chung, N. Gural, C. B. Ford, C. Min, R. R. Shah, R. Ahmad, M. Fernandez-Suarez, S. M. Fortune, M. Toner, H. Lee and R. Weissleder, Nat. Commun., 2013, 4(1752), 1–9 Search PubMed.
- N. Sun, T.-J. Yoon, H. Lee, W. Andress, R. Weissleder and D. Ham, IEEE J. Solid-State Circuits, 2011, 46(1), 342–352 CrossRef.
- N. Sun, Y. Liu, H. Lee, R. Weissleder and D. Ham, IEEE J. Solid-State Circuits, 2009, 44(5), 1629–1643 CrossRef.
- D. Ha, J. Paulsen, N. Sun, Y.-Q. Song and D. Ham, Proc. Natl. Acad. Sci. U. S. A., 2014, 111(13), 11955–11960 CrossRef CAS PubMed.
- J. D. Trumbull, I. K. Glasgow, D. J. Beebe and R. L. Magin, IEEE Trans. Biomed. Eng., 2000, 47(1), 3–7 CrossRef CAS PubMed.
- C. Massin, F. Vincent, A. Homsy, K. Ehrmann, G. Boero, P.-A. Besse, A. Daridon, E. Verpoorte, N. F. de Rooij and R. S. Popovica, J. Magn. Reson., 2003, 164(2), 242–255 CrossRef CAS.
- A. R. Wheeler, Science, 2008, 322, 539–540 CrossRef CAS PubMed.
- J. Gao, X. Liu, T. Chen, P.-I. Mak, Y. Du, M.-I. Vai, B. Lin and R. P. Martins, Lab Chip, 2013, 13, 443–451 RSC.
- M. H. Shamsi, K. Choi, A. H. C. Ng and A. R. Wheeler, Lab Chip, 2014, 14, 547–554 RSC.
- F. Lapierre, M. Harnois, Y. Coffinier, R. Boukherroub and V. Thomy, Lab Chip, 2014, 14, 3589–3593 RSC.
- I. Barbulovic-Nad, H. Yang, P. S. Park and A. R. Wheeler, Lab Chip, 2008, 8, 519–526 RSC.
- G. J. Shah, A. T. Ohta, E. P.-Y. Chiou, M. C. Wu and C. J. Kim, Lab Chip, 2009, 9, 1732–1739 RSC.
- I. Barbulovic-Nad, S. H. Au and A. R. Wheeler, Lab Chip, 2010, 10, 1536–1542 RSC.
- Y. H. Chang, G. B. Lee, F. C. Huang, Y. Y. Chen and J. L. Lin, Biomed. Microdevices, 2006, 8, 215–225 CrossRef CAS PubMed.
- R. Sista, Z. Hua, P. Thwar, A. Sudarsan, V. Srinivasan, A. Eckhardt, M. Pollack and V. Pamula, Lab Chip, 2008, 8, 2091–2104 RSC.
- Z. Hua, J. L. Rouse, A. E. Eckhardt, V. Srinivasan, V. K. Pamula, W. A. Schell, J. L. Benton, T. G. Mitchell and M. G. Pollack, Anal. Chem., 2010, 82(6), 2310–2316 CrossRef CAS PubMed.
- D. Witters, K. Knez, R. Ceyssens, R. Puers and J. Lammertyn, Lab Chip, 2013, 13, 2047–2054 RSC.
- K.-M. Lei, P.-I. Mak, M.-K. Law and R. P. Martins, Analyst, 2014, 139(23), 6204–6213 RSC.
- M. Muluneh and D. Issadore, Adv. Drug Delivery Rev., 2014, 66, 101–109 CrossRef CAS PubMed.
- D. Issadore, C. Min, M. Liong, J. Chung, R. Weissleder and H. Lee, Lab Chip, 2011, 11, 2282 RSC.
- C. Dong, T. L. Chen, J. Gao, Y. W. Jia, P.-I. Mak, M.-I. Vai and R. P. Martins, Microfluid. Nanofluid., 2015, 18, 673–683 CrossRef CAS.
- A. Rival, D. Jary, C. Delattre, Y. Fouillet, G. Castellan, A. Bellemin-Comte and X. Gidrol, Lab Chip, 2014, 14, 3739–3749 RSC.
- M. H. Shamsi, K. Choi, A. H. C. Ng and A. R. Wheeler, Lab Chip, 2014, 14, 547–554 RSC.
- P. Y. Keng, S. Chen, H. Ding, S. Sadeghi, G. J. Shah, A. Dooraghi, M. E. Phelps, N. Satyamurthy, A. F. Chatziioannou, C. J. Kim and R. M. van Dam, Proc. Natl. Acad. Sci. U. S. A., 2012, 109(3), 690–695 CrossRef CAS PubMed.
- L. Indrawati, R. L. Stroshine and G. Narsimhan, J. Sci. Food Agric., 2007, 87(12), 2207–2216 CrossRef CAS PubMed.
- L. Luan, R. D. Evans, N. M. Jokerst and R. B. Fair, IEEE Sens. J., 2008, 8(5), 628–635 CrossRef CAS.
- S. C. C. Shih, I. Barbulovic-Nad, X. Yang, R. Fobel and A. R. Wheeler, Biosens. Bioelectron., 2013, 42, 314–320 CrossRef CAS PubMed.
Footnote |
| † Electronic supplementary information (ESI) available: 1. Highlight of the recent μNMR system; 2. design of the CMOS μNMR transceiver; 3. simulation and measurement results of the CMOS transceiver; 4. co-optimization of the butterfly coil and CMOS transceiver; 5. digital microfluidic module; 6. DMF device fabrication; 7. droplet actuation and 8. μNMR relaxometer software and hardware interfaces. See DOI: 10.1039/c5an00500k |
| This journal is © The Royal Society of Chemistry 2015 |