 Open Access Article
Creative Commons Attribution 3.0 Unported Licence
Bacterial detection with amphiphilic carbon dots†
Sukhendu
Nandi
a,
Margarita
Ritenberg
a and
Raz
Jelinek
*ab
aDepartment of Chemistry, Ben Gurion University of the Negev, Beer Sheva 84105, Israel. E-mail: razj@bgu.ac.il; Fax: (+)972-8-6472943
bIlse Katz Institute for Nanotechnology, Ben Gurion University of the Negev, Beer Sheva 84105, Israel
First published on 13th April 2015
Abstract
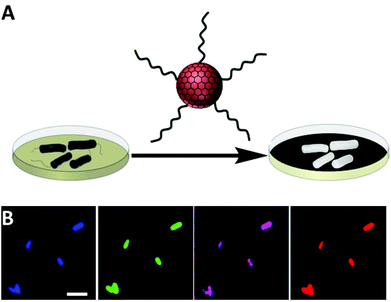
New bacterial detection and imaging methods are desirable for diagnostics and healthcare applications, as well as in basic scientific research. We present a simple analytical platform for bacterial detection and imaging based upon attachment of amphiphilic carbon dots (CDs) to bacterial cells. We show that CDs functionalized with hydrocarbon chains readily bind to bacterial cells following short incubation and enable detection of bacteria through both fluorescence spectroscopy and microscopy. Importantly, we demonstrate that the intensity and spectral position of the carbon dots’ fluorescence depend upon bacterial species, providing a tool for distinguishing among bacteria even in cases of mixed bacterial populations. Moreover, bacterial labelling with the amphiphilic CDs enables visualization of physiological processes such as cell division.
Introduction
Detection and microscopic visualization of bacteria are essential for numerous applications. Current bacterial detection methods generally rely on indirect detection of bacterially-secreted metabolites or visualization of bacterial colonies (rather than individual bacterial cells).1,2 Imaging of bacterial cells has been carried out through the use of varied staining techniques, using either fluorescent dyes,3 or in some cases by semiconductor quantum dots.4 While these strategies are widely used and many bacterial detection5 and imaging agents are commercially available, there is still a need for versatile platforms that could be employed for a broad range of bacterial species, which would be technically simple and inexpensive, and would provide morphological details on bacterial cells. Here, we present a novel scheme for detection and microscopic visualization of bacterial cells using amphiphilic carbon dots.Carbon dots (CDs) are small (<10 nm), quasi-spherical crystalline graphitic nanoparticles, and have attracted considerable interest due to their unique structural and photophysical properties.6,7 CDs exhibit a multitude of colors (e.g. excitation/emission wavelength pairs), fluorescence up-conversion,8 and high quantum yield.8 CDs have been proposed as useful vehicles for biological studies since they are chemically stable, can be readily surface-functionalized, and their broad excitation/emission spectral range and low photo bleaching are beneficial for imaging applications.
CDs can be readily derivatized with varied molecular residues consequently endowing them with diverse functionalities.9,10 We have recently demonstrated that CDs displaying long hydrocarbon chains – i.e. amphiphilic CDs – can be employed as useful fluorescent probes for membrane analysis.11 Moreover, amphiphilic CDs were shown to exhibit high affinity to actual cellular membranes, thereby enabling multicolor microscopic imaging of cells and intracellular organelles.11 Here, we show that amphiphilic CDs serve as effective fluorescent markers of bacterial cells. Importantly, we show that the fluorescence emission was modulated by the specific bacterial strain to which the CDs were attached – providing a powerful vehicle for distinguishing among different bacteria, even in mixtures of more than a single bacterial species. The new CD labelling method was further employed for visualizing “poles” within dividing bacterial cells, pointing to utilization of the technology for analysis of cellular events.
Experimental section
Materials
Phosphate buffered saline (PBS) was purchased from Sigma-Aldrich. Luria–Bertani (LB) agar was purchased from Pronadisa (Spain).Bacterial growth
The bacteria used in the studies were Escherichia coli MG1655 wild type, Salmonella typhimurium (strain ATCC14028), Pseudomonas aeruginosa PAO1 wild type, Bacillus cereus, and PET28a-FtsA-GFP strains. The plasmid was pet28a having a T7 promoter.12 Transformation efficiency was calculated by fluorescence microscopy and it is 75–80% of the whole cell population. The bacteria were grown aerobically at 37 °C in a sterilized solid LB medium composed of 13.5% yeast extract, 27% peptone, 27% NaCl, and 32.5% agar at pH 7.4. After overnight growth, a colony from each bacterial strain was taken and added to 10 mL sterilized LB medium and incubated at 37 °C. Bacterial growth was monitored at the desired time points through measuring the concentration of the bacteria by visible spectroscopy (108 CFU mL−1 when optical density at 600 nm was 1.0).Synthesis of amphiphilic carbon dots
Synthesis of amphiphilic carbon dots followed a recently published procedure [full experimental details are presented in Fig. 1–9, ESI† and in ref. 11]. Briefly, we synthesized 6-O-acylated fatty acid ester of D-glucose (prepared by reacting D-glucose with O-O′-di-lauroyl-tartaric acid anhydride) which then underwent carbonization to produce amphiphilic CDs. Purity of end products was confirmed by NMR spectroscopy which confirms complete carbonisation during the course of the reaction. FT-IR (Fig. 7, ESI†) and XPS (Fig. 8, ESI†) spectra reveal the chemical composition of the as-synthesised CDs. Two dominant peaks at 281.7 and 530.4 eV in the XPS survey spectrum are attributed to C1s and O1s, suggesting the existence of only carbon and oxygen elements in the as-synthesized CDs (atomic content of carbon and oxygen was 72% and 28% respectively). The measured C1s spectrum can be deconvoluted into five surface components, corresponding to sp2 (C![[double bond, length as m-dash]](https://www.rsc.org/images/entities/char_e001.gif) C) at binding energy of 284.7 eV, sp3 (C–C, C–H) at 285.3 eV, C–OH at 286.8 eV, C
C) at binding energy of 284.7 eV, sp3 (C–C, C–H) at 285.3 eV, C–OH at 286.8 eV, C![[double bond, length as m-dash]](https://www.rsc.org/images/entities/char_e001.gif) O at 287.6 eV and O–C
O at 287.6 eV and O–C![[double bond, length as m-dash]](https://www.rsc.org/images/entities/char_e001.gif) O at 286.8 eV. In the deconvoluted O1s spectrum the appearance of peaks at binding energies of 529.9 eV, 530.8 eV and 531.6 eV corresponding to C–O, C
O at 286.8 eV. In the deconvoluted O1s spectrum the appearance of peaks at binding energies of 529.9 eV, 530.8 eV and 531.6 eV corresponding to C–O, C![[double bond, length as m-dash]](https://www.rsc.org/images/entities/char_e001.gif) O, and OH–C
O, and OH–C![[double bond, length as m-dash]](https://www.rsc.org/images/entities/char_e001.gif) O groups, respectively, is consistent with the FT-IR spectrum indicating the presence of oxygen containing hydrophilic functional groups on the surface of the as-synthesized CDs. The transmission electron microscopy (TEM) images in Fig. 9, ESI† further confirm the crystallinity of the CD product. Quantum yield of the amphiphilic CDs was 16.5%, 9.4%, and 4.7% in chloroform, hexane, and NaH2PO4 buffer, respectively (full details in the ESI† document).
O groups, respectively, is consistent with the FT-IR spectrum indicating the presence of oxygen containing hydrophilic functional groups on the surface of the as-synthesized CDs. The transmission electron microscopy (TEM) images in Fig. 9, ESI† further confirm the crystallinity of the CD product. Quantum yield of the amphiphilic CDs was 16.5%, 9.4%, and 4.7% in chloroform, hexane, and NaH2PO4 buffer, respectively (full details in the ESI† document).
Bacterial labelling with amphiphilic carbon dots
All bacteria were grown overnight at 37 °C in LB medium. After overnight growth, a colony from each bacterial strain was placed into 10 mL falcon tubes and the optical density was measured at 600 nm and adjusted to 1.0 (108 cells per mL). The bacterial cells were centrifuged for 20 min at 2300 rcf, washed twice with the sterilized PBS (pH 7.4), and the cell pellet was re-suspended in 1 mL solution of amphiphilic CDs dissolved in PBS buffer (pH 7.4) under gentle vortexing (CD concentration 1 mg mL−1). The bacteria/CD suspensions were kept at 37 °C for 3 h with gentle shaking. After incubation, the mixture was centrifuged to pellet the CD-labeled bacteria, the supernatant was discarded and the pellet was re-suspended in PBS buffer. The process was repeated twice to remove all unbound amphiphilic CDs. Finally, the pellet was suspended again in 1 mL PBS and 900 μL of such aliquot was taken in a quartz cuvette and subjected to fluorescence spectroscopy studies.Fluorescence microscopy, binding curves and sensitivity test
For the fluorescence microscopy experiments, 50 μL of the above prepared amphiphilic CD labeled cell suspension was placed on microscope slides coated with 100 μL of 5% agarose gel. For measuring the binding curves of the amphiphilic CDs to different bacteria, the same procedure was carried out with different concentrations of amphiphilic CDs (from 0.1 mg mL−1 to 1.5 mg mL−1) in PBS buffer. The best-fit curve was obtained by using SigmaPlot dynamic curve fitting software for fitting experimentally-obtained points in an equation that corresponds to the curve merging a maximum number of experimental points with reduced chi-square value and R2 closest to 1. For binding curve experiments and sensitivity tests each data point was repeated three times.Sensitivity assay
The procedure was repeated with different concentrations of bacteria (108 CFU mL−1 to 102 CFU mL−1) prepared through dilution and incubated with the same concentration of amphiphilic CDs (1 mg mL−1). For visualization of the membrane domains of E. coli, the bacterial cells were grown together with amphiphilic CD solution in LB medium (concentration 1 mg mL−1) at 37 °C for 3 h. For microscopic visualization of the membrane domain a thin cover glass slide was coated with 100 μL of 5% agarose gel and the bacteria were placed on the treated surface.Fluorescence spectroscopy and microscopy
Steady-state fluorescence spectra were recorded using a Fluorolog 3 (Jobin-Yvon) steady-state spectrometer. Fluorescence microscopy experiments were carried out on an Olympus IX70 microscope (Japan), equipped with a Roper Scientific Inc. MicroMAX camera with an UPlanFL100×/1.4 objective. Images were processed with “WINView” software.Results and discussion
Fig. 1A illustrates the new bacterial detection approach using amphiphilic carbon dots (CDs). We recently demonstrated that these CDs, which display hydrocarbon chains upon the particle surface, exhibit high affinity to cell membranes.11 As depicted in Fig. 1A, the bacterial detection scheme relies upon incubation of bacteria with the amphiphilic CDs (for 3–4 h); after subsequent washing, CDs attached to the bacterial cells render them highly fluorescent, thereby being easily detectable by fluorescence spectroscopy/microscopy.Fig. 1B depicts representative fluorescence microscopy images recorded after incubation of E. coli bacterial cells with the amphiphilic CDs. The images in Fig. 1B show bright fluorescent bacterial cells due to attachment of the amphiphilic CDs (the fluorescence threshold was adjusted to subtract the auto-fluorescence of the bacteria).13,14 Importantly, the multicolor fluorescence apparent in Fig. 1B reflects the broad excitation/emission range of CDs.15,16 This distinctive property enables, in principle, selection of the desired excitation and emission wavelengths for visualization of the bacteria, depending upon instrument features, auto-fluorescence levels of the tested bacteria in specific wavelengths, and/or the presence of other fluorescent dyes.
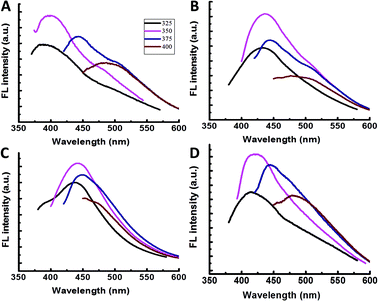
To investigate labelling and interactions of different bacterial species with amphiphilic CDs, we incubated the carbon nanoparticles with four widely-studied bacterial strains, Gram-negative (E. coli, P. aeruginosa, S. typhimurium) and Gram-positive (B. cereus). Fig. 2A–D present the emission spectra recorded following incubation of the same concentrations of amphiphilic CDs with the four bacterial strains. Previous studies have shown that the CDs’ fluorescence is sensitive to their molecular environments.6–11 The distinct wavelength-dependent shifts of the CDs’ fluorescence (Fig. 2A–D), apparent for each bacterial strain, likely indicate that the CDs exhibit different affinities and interactions with the bacterial cell membranes.
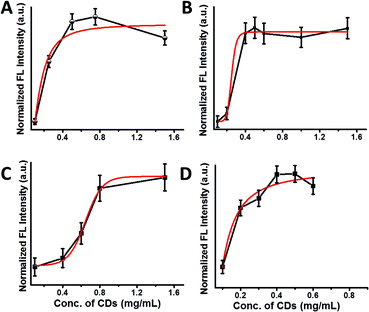
Fig. 3 presents binding curves depicting the fluorescence emission intensities (excitation 350 nm, in which maximal emission of the CDs was observed, Fig. 2A–D) recorded upon addition of different concentrations of the amphiphilic CDs to solutions containing 108 bacterial cells. The fluorescence emissions were recorded after incubation of the bacteria with the CDs followed by washing to remove excess (unbound) nanoparticles.
Fig. 3 shows the attachment of the CDs to the bacterial cells; in all four bacterial strains, after the initial fluorescence increase due to binding of the fluorescent CDs to the cells, the fluorescence intensities reach plateaus – reflecting maximal available binding sites for the amphiphilic-CD upon the cell surface (i.e. saturation levels).
An important observation in Fig. 3 is the distinct binding profiles of the amphiphilic CDs associated with each bacterial strain. The differences are clearly apparent upon comparison of the best-fit binding curves shown in red (calculated through SigmaPlot dynamic curve fitting software). Indeed, the slopes, concentration thresholds for bacterial labelling, and overall shapes of the curves in Fig. 3 indicate that the binding mechanisms of the amphiphilic CDs vary among the bacterial species. Echoing the fluorescence emission spectra in Fig. 2, this result likely reflects the variation in cell surface properties among the bacterial strains examined (i.e. different lipid compositions, molecular organization, and macroscopic structures of bacterial surface), which determine the affinities of the amphiphilic CDs to the bacterial membranes and their modes of attachment.17–19
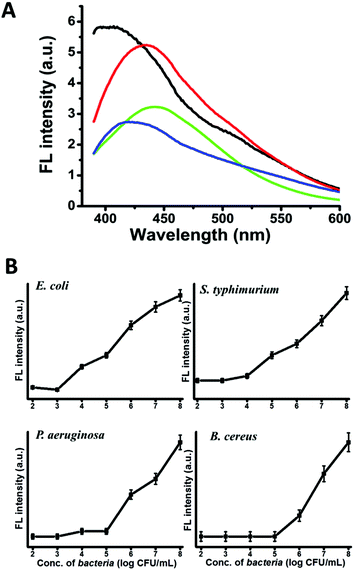
The new CD-labelling approach opens interesting avenues for bacterial detection applications. Fig. 4A depicts the fluorescence spectra recorded upon excitation at 350 nm using the same concentration of bacterial cells and amphiphilic CDs. The significant strain-dependent differences in spectral shifts and peak intensities apparent in Fig. 4A are ascribed to the distinct membrane compositions and molecular organization of the bacterial species tested, which affect both the affinity of the amphiphilic CDs to the cell membranes, as well as the environments of the bound nanoparticles. Interestingly, the relative intensities of the fluorescence emissions in Fig. 4A trace the abundance of phosphatidylethanolamine (PE) in the membrane of the bacteria tested (Table 1, ESI†), which might reflect affinity of the amphiphilic CDs to the zwitterionic phospholipid.
Fig. 4B depicts the detection sensitivities of the CD labelling assay for the four strains tested (using CD concentrations corresponding to the saturation values, Fig. 3). Notably, the detection threshold values recorded (103–105 cells per mL) are better than other fluorescence based techniques for bacterial detection, such as fluorescein isothiocyanate (FITC) based methods.3,4
Fig. 5 examines the feasibility of using the carbon dot platform for distinguishing among different bacterial species in a mixture through exploiting the distinct photoluminescence profiles of the CD-labeled bacteria (i.e.Fig. 2, 3 and 4A). In the experiment shown in Fig. 5 we created a mixture of two bacterial strains which were subsequently labeled with amphiphilic CDs: E. coli which was also fluorescently-labeled with green fluorescent protein (GFP),13 and B. cereus (which was not GFP labeled). Fig. 5 depicts fluorescence microscopy images of the bacterial mixture recorded using distinct excitation/emission wavelengths (i.e. different colors), and different fluorescence thresholds in the images.
Fig. 5A depicts the image showing several labeled cells, recorded using blue excitation (365 nm) and a 420 nm LP emission filter, and obtained using a low fluorescence threshold and 0.5 s exposure time. However, when a significantly higher fluorescence threshold was employed in the same microscopy image, fewer bacterial cells were observed (Fig. 5B). This result likely indicates that the bacterial cells that became “invisible” in Fig. 5B correspond to B. cereus, as labelling of this strain with the amphiphilic CDs yielded much lower fluorescence emission (i.e.Fig. 4A, blue curve). In comparison, the brighter remaining cells in Fig. 5B are likely E. coli – as this bacterial strain emits much more intense fluorescence after the attachment of amphiphilic CDs (Fig. 4A, black curve).
To confirm this interpretation we recorded a fluorescence microscopy image using 470 nm excitation, a 510 LP emission filter and at a very low exposure time, i.e. 0.05 s (Fig. 5C) – a setup optimized for imaging of GFP-labeled E. coli bacteria.20 Indeed, the fluorescence microscopy image in Fig. 5C shows only the GFP-labeled E. coli cells (as the CD-labeled bacterial cells do not show up in such a low exposure time due to the lower quantum yield of the CDs compared to GFP), exactly coincident with the cells imaged in Fig. 5B. Optical filtering of B. cereus cells labeled with amphiphilic CDs could be similarly accomplished using excitation–emission pairs in the red spectral region using excitation of 540 nm, emission filter 605 nm and 0.5 s exposure time (Fig. 5D). Echoing the fluorescence profile in Fig. 4A, CD-labeled B. cereus exhibits much lower fluorescence emission also in the red region compared to CD-labeled E. coli (Fig. 2, ESI†). Accordingly, by appropriate setting of the fluorescence threshold in the microscopy images one can observe only the E. coli cells, as apparent in Fig. 5D.
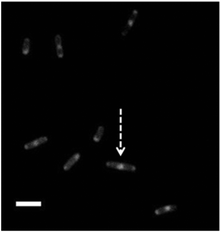
Labelling bacteria with amphiphilic CDs further enabled dramatic visualization of membrane domains associated with fundamental physiological events (Fig. 6). Fig. 6 presents microscopic analysis of CD-labeled E. coli cells (excitation 365 nm and 420 nm LP emission filter) revealing high fluorescence intensities at the two “poles” of the bacterial cell. The localization of the fluorescent CDs at the poles might be ascribed to the presence of membrane domains comprising high cardiolipin (CL) concentrations,17 and migration of membrane-associated proteins to the poles during cell division.21,22 Indeed, inspection of the fluorescence microscopy image in Fig. 6 also clearly shows E. coli cells likely in the midst of a division process – exhibiting another highly fluorescent domain in the middle of a dividing cell (i.e. cell indicated with an arrow in Fig. 6).
Conclusions
We show that amphiphilic carbon dots (CDs) can be employed as a convenient vehicle for bacterial imaging, based upon their affinity to bacterial cell surfaces. Distinct fluorescence emission profiles were recorded due to the different molecular properties of the bacterial membranes. The dependence of fluorescence emission upon bacterial species makes possible, in some cases, distinguishing among different strains. Carbon dot labeling makes possible dramatic microscopic visualization of physiological processes such as cell division, reflected in changes of cell surface morphologies.Acknowledgements
The Kreitman School of Advanced Graduate Studies at Ben Gurion University is acknowledged for financial support (SN). We are grateful to Dr Manoj Pal, Department of Life Sciences, Ben-Gurion University of the Negev, for help with the bacterial imaging experiments.Notes and references
- M. M. Champion, E. A. Williams, G. M. Kennedy and P. A. Champion, Mol. Cell. Proteomics, 2012, 11, 596–604 CAS.
- D. Meir, L. Silbert, R. Volinsky, S. Kolusheva, I. Weiser and R. Jelinek, J. Appl. Microbiol., 2008, 104, 787–795 CrossRef CAS PubMed.
- M. A. Hahn, P. C. Keng and T. D. Krauss, Anal. Chem., 2008, 80, 864–872 CrossRef CAS PubMed.
- X.-L. Su and Y. Li, Anal. Chem., 2004, 76, 4806–4810 CrossRef CAS PubMed.
- B. Mukhopadhyay, M. B. Martins, R. Karamanska, D. A. Russell and R. A. Field, Tetrahedron Lett., 2009, 50, 886–889 CrossRef CAS PubMed.
- L. Cao, X. Wang, M. J. Meziani, F. Lu, H. Wang, P. G. Luo, Y. Lin, B. A. Harruff, L. M. Veca, D. Murray, S.-Y. Xie and Y.-P. Sun, J. Am. Chem. Soc., 2007, 129, 11318–11319 CrossRef CAS PubMed.
- S. K. Bhunia and N. R. Jana, ACS Appl. Mater. Interfaces, 2011, 3, 3335–3341 CAS.
- A. Salinas-Castillo, M. Ariza-Avidad, C. Pritz, M. Camprubi-Robles, B. Fernandez, M. J. Ruedas-Rama, A. Megia-Fernandez, A. Lapresta-Fernandez, F. Santoyo-Gonzalez, A. Schrott-Fischer and L. F. Capitan-Vallvey, Chem. Commun., 2013, 49, 1103–1105 RSC.
- A. B. Bourlinos, A. Stassinopoulos, D. Anglos, R. Zboril, M. Karakassides and E. P. Giannelis, Small, 2008, 4, 455–458 CrossRef CAS PubMed.
- Q. Li, T. Y. Ohulchanskyy, R. Liu, K. Koynov, D. Wu, A. Best, R. Kumar, A. Bonoiu and P. N. Prasad, J. Phys. Chem. C, 2010, 114, 12062–12068 CAS.
- S. Nandi, R. Malishev, K. Parambath Kootery, Y. Mirsky, S. Kolusheva and R. Jelinek, Chem. Commun., 2014, 50, 10299–10302 RSC.
- X. Ma, D. W. Ehrhardt and W. Margolin, Proc. Natl. Acad. Sci. U. S. A., 1996, 93, 12998–13003 CrossRef CAS.
- Z. Zhou, M. N. Pons, L. Raskin and J. L. Zilles, Appl. Environ. Microbiol., 2007, 73, 2956–2962 CrossRef CAS PubMed.
- A. T. Garcia and J. S. Olmos, Aquaculture, 2007, 262, 211–218 CrossRef CAS PubMed.
- Z.-A. Qiao, Y. Wang, Y. Gao, H. Li, T. Dai, Y. Liu and Q. Huo, Chem. Commun., 2010, 46, 8812–8814 RSC.
- A. Sachdev, I. Matai, S. U. Kumar, B. Bhushan, P. Dubey and P. Gopinath, RSC Adv., 2013, 3, 16958–16961 RSC.
- R. M. Epand and R. F. Epand, Mol. BioSyst., 2009, 5, 580–587 RSC.
- R. M. Epand and R. F. Epand, Biochim. Biophys. Acta, Biomembr., 2009, 1788, 289–294 CrossRef CAS PubMed.
- L. T. Nguyen, E. F. Haney and H. J. Vogel, Trends Biotechnol., 2011, 29, 464–472 CrossRef CAS PubMed.
- E. Spiess, F. Bestvater, A. Heckel-Pompey, K. Toth, M. Hacker, G. Stobrawa, T. Feurer, C. Wotzlaw, U. Berchner-Pfannschmidt, T. Porwol and H. Acker, J. Microsc., 2005, 217, 200–204 CrossRef CAS PubMed.
- G. Laloux and C. Jacobs-Wagner, J. Cell Sci., 2014, 127, 11–19 CrossRef CAS PubMed.
- L. Shapiro, H. H. McAdams and R. Losick, Science, 2009, 326, 1225–1228 CrossRef CAS PubMed.
Footnote |
| † Electronic supplementary information (ESI) available: Correlation between fluorescence emission and lipid compositions of bacterial membranes; quantum yield calculations. See DOI: 10.1039/c5an00471c |
| This journal is © The Royal Society of Chemistry 2015 |

