
 Open Access Article
 This Open Access Article is licensed under a
 Creative Commons Attribution 3.0 Unported Licence
Online investigation of respiratory quotients in Pinus sylvestris and Picea abies during drought and shading by means of cavity-enhanced Raman multi-gas spectrometry
Stefan
Hanf
ab,
Sarah
Fischer
b,
Henrik
Hartmann
b,
Robert
Keiner
a,
Susan
Trumbore
b,
Jürgen
Popp
acd and
Torsten
Frosch
*acd
aLeibniz Institute of Photonic Technology, Jena, Germany
bMax Planck Institute for Biogeochemistry, Jena, Germany
cFriedrich Schiller University, Institute for Physical Chemistry, Jena, Germany. E-mail: torsten.frosch@uni-jena.de; torsten.frosch@gmx.de
dFriedrich Schiller University, Abbe Center of Photonics, Jena, Germany
First published on 28th May 2015
Abstract
Photosynthesis and respiration are major components of the plant carbon balance. During stress, like drought, carbohydrate supply from photosynthesis is reduced and the Krebs cycle respiration must be fueled with other stored carbon compounds. However, the dynamics of storage use are still unknown. The respiratory quotient (RQ, CO2 released per O2 consumed during respiration) is an excellent indicator of the nature of the respiration substrate. In plant science, however, online RQ measurements have been challenging or even impossible so far due to very small gas exchange fluxes during respiration. Here we apply cavity-enhanced multi-gas Raman spectrometry (CERS) for online in situ RQ measurements in drought-tolerant pine (Pinus sylvestris [L.]) and drought-intolerant spruce (Picea abies [L. H. Karst]). Two different treatments, drought and shading, were applied to reduce photosynthesis and force dependency on stored substrates. Changes in respiration rates and RQ values were continuously monitored over periods of several days with low levels of variance. The results show that both species switched from COH-dominated respiration (RQ = 1.0) to a mixture of substrates during shading (RQ = 0.77–0.81), while during drought only pine did so (RQ = 0.75). The gas phase measurements were complemented by concentration measurements of non-structural carbohydrates and lipids. These first results suggest a physiological explanation for greater drought tolerance in pine. CERS was proven as powerful technique for non-consumptive and precise real-time monitoring of respiration rates and respirational quotients for the investigation of plant metabolism under drought stress conditions that are predicted to increase with future climate change.
Introduction
Cellular respiration, i.e. the breakdown of organic compounds for the release of biochemical energy, can be fueled with carbohydrates (glucose), proteins (amino acids), and lipids (fatty acids).1 One approach for elucidating substrate use and respiration dynamics is provided by the analysis of the respiratory quotient (RQ), defined as molar ratio of CO2 units released per O2 units consumed. Monitoring of the RQ allows the identification of changes in substrate use, because the different organic molecules have different stoichiometric ratios of C![[thin space (1/6-em)]](https://www.rsc.org/images/entities/char_2009.gif) :O:H and thus the amount of O2 units per unit of CO2 differs2 for the oxidation of such compounds. For example, pure carbohydrates, which have a higher degree of oxidization than proteins and lipids, have RQ values close to 1.0, i.e. less oxygen is required for their complete breakdown. In contrast, lipids, consisting of C and H but less O, will have lower RQ of ∼0.7 (i.e. higher demand on external oxygen for fatty acid oxidization), assuming that protein oxidation (RQ = 0.82) remains a negligible component. Fast real-time monitoring of CO2 and O2 is already established in diagnostic medicine3 for respiratory studies in exhaled breath and covers a range of 15–21 vol% for O2 and 3–6 vol% for CO2. Whereas RQ measurements of plants have been difficult in practice due to the relatively small concentration changes in O2 content of ambient air (concentration of O2 in air is approximately 20.9 vol% while the concentration of CO2 in air is approximately 360 ppm). Thus RQ values in plant sciences are much more difficult to measure accurately than in human and animal breath studies. For example, an increase in CO2 concentration from 400 to 600 ppm causes a decrease in O2 concentration from 209.400 to 209.200 ppm (for RQ = 1), i.e. a relative difference of 50% vs. 0.1%.
:O:H and thus the amount of O2 units per unit of CO2 differs2 for the oxidation of such compounds. For example, pure carbohydrates, which have a higher degree of oxidization than proteins and lipids, have RQ values close to 1.0, i.e. less oxygen is required for their complete breakdown. In contrast, lipids, consisting of C and H but less O, will have lower RQ of ∼0.7 (i.e. higher demand on external oxygen for fatty acid oxidization), assuming that protein oxidation (RQ = 0.82) remains a negligible component. Fast real-time monitoring of CO2 and O2 is already established in diagnostic medicine3 for respiratory studies in exhaled breath and covers a range of 15–21 vol% for O2 and 3–6 vol% for CO2. Whereas RQ measurements of plants have been difficult in practice due to the relatively small concentration changes in O2 content of ambient air (concentration of O2 in air is approximately 20.9 vol% while the concentration of CO2 in air is approximately 360 ppm). Thus RQ values in plant sciences are much more difficult to measure accurately than in human and animal breath studies. For example, an increase in CO2 concentration from 400 to 600 ppm causes a decrease in O2 concentration from 209.400 to 209.200 ppm (for RQ = 1), i.e. a relative difference of 50% vs. 0.1%.
Drought can have severe impacts on carbon availability in plants and on physiological processes like cellular osmoregulation and respiration.4 Stomatal closure during drought reduces carbon assimilation and forces trees to rely on stored carbon reserves. During longer periods of drought, this could lead to depletion of reserves, carbon starvation and mortality.5 So far, most studies in plant science have focused on carbohydrates as the major fraction of carbon storage compounds and main respiratory substrate. But plants also store carbon in the form of proteins and lipids that can also be mobilized and used in respiration. Shading-starved leaves or severed root tips without external C supply have been shown to respire lipids and proteins.6 But RQ measurements in these studies depended on incubation of excised tissues and hence could not reveal long-term trends in intact plants. Empirical evidence for changes in substrate use in stressed whole plants and specifically in trees is sparse or even absent. Such studies are challenging because in stressed plants gas sensors are faced with small changes in CO2 and O2.7 Thus accurate and simultaneous measurements of both, O2 consumption and CO2 production, would allow deeper insights into plant physiological phenomena than assessments of only one gas component.
Commonly used designs for respiration rate measurements are: (1) closed or static systems, (2) flowing or flushed systems, and (3) permeable systems. The most accurate design for the determination of low respiration is the closed system since the gases being exchanged accumulate or decline over the time of the measurement cycle. However, the O2 and CO2 concentration changes in the enclosed air space during measurement may negatively affect respiration rates.8 For O2 concentration measurements, conventional sensors are either based on paramagnetic, electrochemical (i.e. galvanic), or optical (photoluminescence) techniques. CO2 can be measured by electrochemical or several infrared absorption techniques (photoacoustic, infrared absorption spectroscopy (IRAS), or non-dispersive infrared (NDIR) absorption spectroscopy). A widely distributed technique to measure multiple gases of interest is gas chromatography in combination with mass spectrometry (GCMS), which has very high accuracy down to the ppt region for multi-gas detection, but lacks fast response times, is consumptive, requires frequent calibration procedures and is lab based. Hence, conventionally available O2/CO2 sensors suffer from one or more basic problems: (1) insufficient precision and/or low specify, (2) no continuous measurements with high response time <1 s, (3) consumption of sample gas, (4) operation only under high oxygen atmosphere, (5) need for frequent calibration due to fast sensor aging, (6) inability to simultaneously measure CO2 and O2, and (7) no miniaturization for online in situ monitoring.
Simultaneous and rapid monitoring of O2 and CO2 concentrations can be performed with Raman spectroscopy, which is a powerful analytical tool in many scientific disciplines.9 A novel technique for highly sensitive Raman gas measurements is CERS.10 Here a low power consumptive laser diode is passively frequency locked and feedback coupled to a high finesse optical cavity, thus enabling a strong power build up and consequently a signal enhancement of several orders of magnitude.11 CERS can be exploited for simultaneous and non-consumptive quantification of a variety of gases (O2, N2, and CO2), in a dynamic range from 100 ppm to 100 vol% and with fast response times <1 s.
This work introduces CERS as a novel tool for fast and continuous in situ online monitoring of RQ for the investigation of changes in plant respiration substrates during drought and shading in two common European forest tree species: drought-tolerant pine (Pinus sylvestris [L.]) and drought-intolerant spruce (Picea abies [L. H. Karst]). These treatments were applied in order to provoke carbon limitation (and storage dependency) via reductions in photosynthesis by decreasing stomatal conductance (drought) or by depleting light energy required for carboxylation (shading). We hypothesize that trees in these treatments will switch from primary respiration substrates carbohydrates (produced during photosynthesis (sugars) and their short-term storage form (starch)) to other substrates like proteins and long-term storage compounds like lipids. This shift in substrate pools would cause declines in the observed RQ values.
Material and methods
Biological material
Trees were purchased at a local forest nursery, were five years old, and ∼60 cm tall at the time of the experiment. They were planted in 2 L pots containing a 2:1 vermiculate:sand mixture (fertilized with Manna® Wuxal Super 8-8-6 with microelements and a slow-release conifer fertilizer Substral® Osmocote 11-8-17; Wilhelm Haug GmbH & Co. KG, Düsseldorf, Germany, and Scotts Celaflor GmbH, Mainz Germany). For the drought treatment, irrigation was stopped completely because a preliminary study showed that drought-related changes in tree functioning (e.g. declines in photosynthetic rate and stomatal conductance) occurred within one week only under complete drought. Treatments were continued beyond initial changes in RQ and until the RQ stabilized, but stopped the experiment before drought-induced mortality occurred. Different treatments for pine and spruce lasted 7–11 days, respectively. For the shading experiment, the whole trees were placed into a (dark) incubator with a constant temperature of 25 °C and a temperature accuracy of ±0.1 K (IPC7000, Memmert GmbH). The investigation in drought-induced stress was carried out for both species in an air-conditioned laboratory at temperatures ranging between 25 to 27 °C. The relative humidity and temperature were logged by a humidity-temperature data logger (Testo 177-H1) with an accuracy of ΔT = 0.2 K and Δϕ = 0.5%.
Raman spectroscopic gas analysis
Gas concentrations and the corresponding gas exchange rates were obtained using cavity-enhanced Raman gas spectrometry11 with a sensitivity of approximately 100 ppm. Temperature and absolute pressure were determined with electronic sensors on the sample gas. A robust calibration for this multi-gas sensing was achieved by using pure reference gases of O2, CO2, and N2. The measured Raman Stokes intensity is given by:| IR = const × N × I0 × (ϖ0 − ϖR)4 × |α|2, |
Ig defines the intensity of the measured gas g (or gas mixture), Ic of the calibration gas c;

![[small nu, Greek, tilde]](https://www.rsc.org/images/entities/i_char_e0e1.gif) defines the wavenumber, and k the number of CCD pixels for m gases. A least-squares fit of the whole spectra was performed for the gas mixture, such that all detector pixels are taken into account.
defines the wavenumber, and k the number of CCD pixels for m gases. A least-squares fit of the whole spectra was performed for the gas mixture, such that all detector pixels are taken into account.
All investigated gases (O2, CO2, and N2) could be specifically identified and independently quantified (Fig. 1A). The gas concentrations were expressed as mixing ratios, and normalized to the sum of all measured gases (which was constant over the course of the experiment). The inlet of the Raman multi-gas sensor was connected to outlet port of the dark respiration chamber, which contained a single tree branch (Fig. 1B). The airtight Perspex® chamber was covered by two layers of aluminum foil for complete darkness to prevent photosynthetic activity, thus ensuring that only dark respiration contributed to changes of O2 and CO2 in the branch chamber. The outlet of the Raman gas sensor was plugged to two software-controlled three-way magnetic valves (M1, M2), which were connected in series. The monitored multi-gas mixture after one measurement cycle could be evacuated to the atmosphere by using the first valve (M1), whereas the second valve (M2) was connected to a gas bottle with synthetic air (SA: 80 vol% N2, rest O2). The opening and closing of the valves was controlled by a LabView program. When both valves were closed, the air circulated through a closed system which connected the dark chamber and the Raman gas analyzer. The respired CO2 accumulated over time in this initially CO2-free volume, while the O2 concentration decreased from its initial value of 20 vol%. When the CO2 concentration in the closed cycle volume reached a predefined limit (for example 3500 ppm in Fig. 2A), both magnetic valves were automatically opened for flushing of the whole volume (consisting of dark chamber with branch, Raman gas analyzer, tubing, and the magnetic valves) for several minutes with synthetic air and thus replacing the gas mixture of the previous measurement cycle. After this procedure, the magnetic valves were automatically closed and a new measurement cycle started. These cycles were repeated continuously. One measurement period lasted 0.5–1.0 h (Fig. 2).
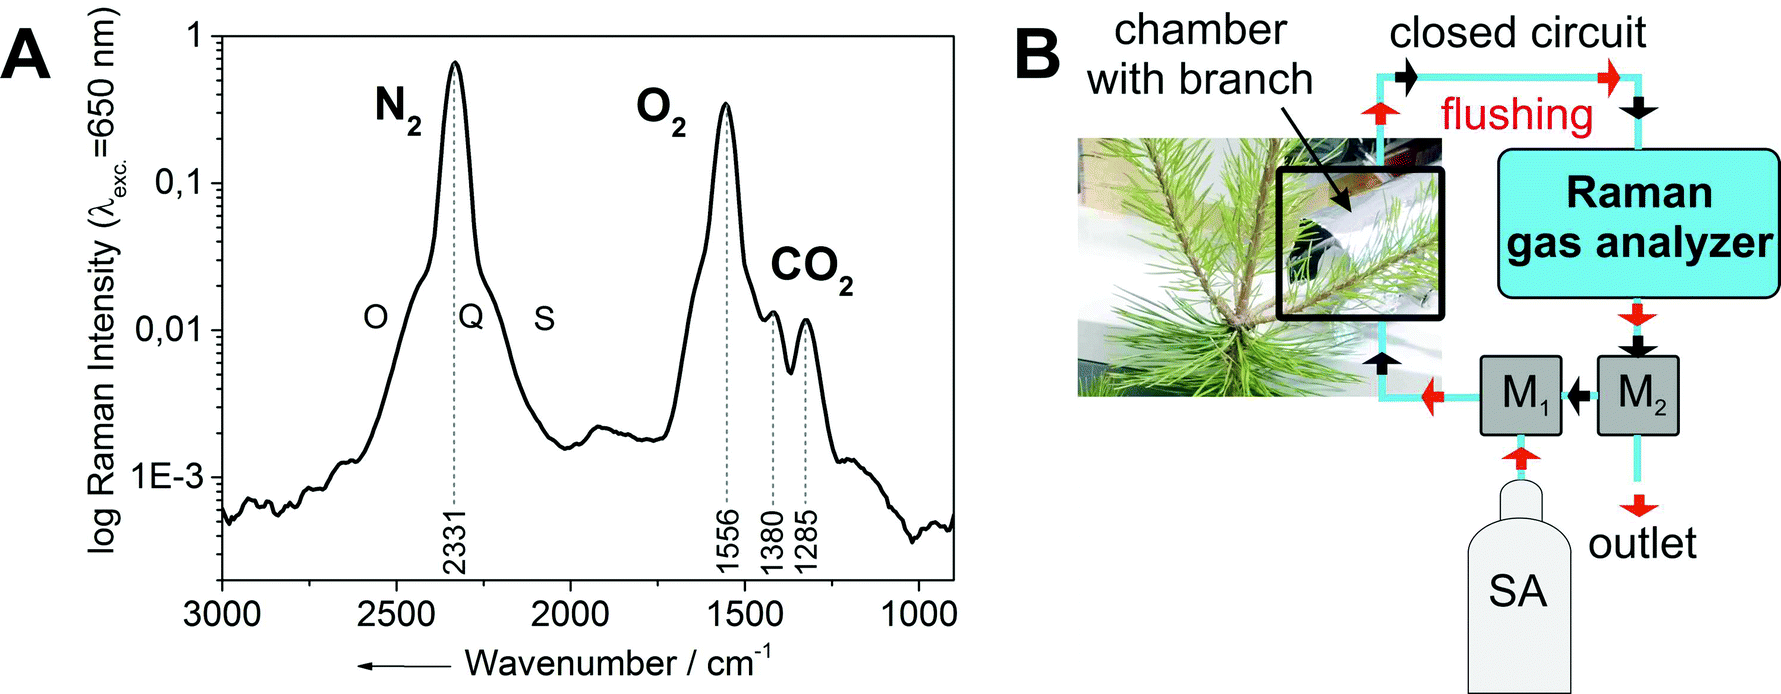 | ||
| Fig. 1 (A) Example of an experimentally-derived Raman spectrum from a dark respiration experiment with the ro-vibrational bands of nitrogen and oxygen and the Fermi diad18 of carbon dioxide. (B) Schematic setup of the Raman gas analysis experiment for gas phase RQ measurements. It consists of the Raman gas analyzer connected to a dark chamber containing a branch section. The whole setup was either flushed (red arrows) with CO2-free synthetic air (SA) or run in closed-circuit mode for continuous gas measurements (black arrows), switching between modes was done automatically via software-controlled magnetic valves (M1, M2). The Raman analysis was non-consumptive and did not change the gas composition. | ||
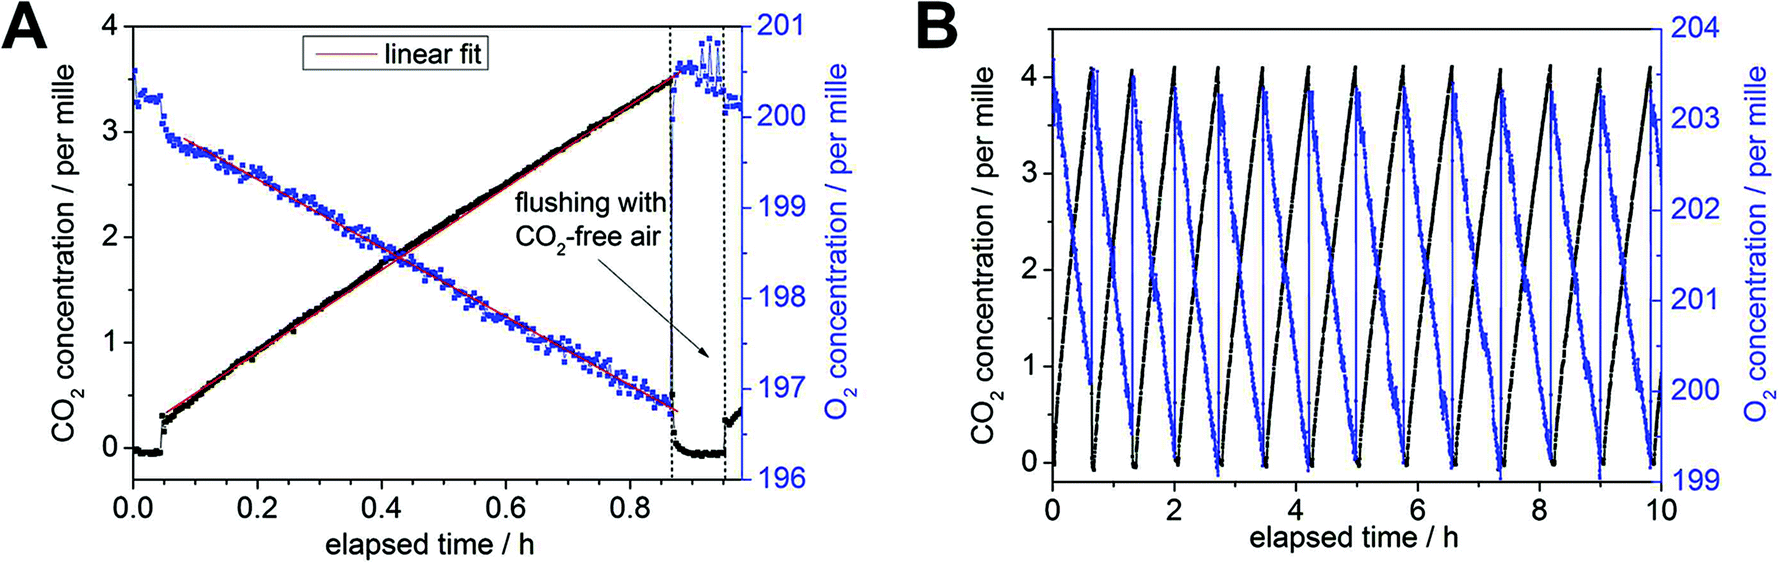 | ||
| Fig. 2 Example for monitoring rates of branch dark respiration by CERS for untreated pine. (A) Detail of a single respiration cycle with a total cycle time of almost 1 h. Before a new cycle was initiated by the software-controlled magnetic valves, the total volume was flushed for 3 min with synthetic air (80 vol% N2, 20 vol% O2). The concentration of O2 was linearly decreasing from initial ∼20 vol% (blue), whereas the concentration of CO2 revealed a linear rise starting at 0 ppm with an initially small offset of ∼300 ppm (black). After the CO2 concentration reached an experimentally-defined upper limit (here 0.4 vol%), the cycle was ended and the closed chamber flushed again with synthetic air for a new dark respiration cycle. The individual concentration changes were fitted with a linear trend (red lines) for the calculation of respiration rates (both O2 and CO2). The initial change of O2 and CO2 concentrations before the start of the cycle were caused by a residual small non-flushed tubing dead volume of ∼1 ml. (B) The graph shows 13 subsequent slopes for an overall elapsed time of ∼10 h. Each individual cycle yielded RR for O2 and CO2 and thus 13 RQ values for a measurement period of 10 h. The cycle duration could be decreased by a reducing the upper CO2 threshold for starting the flush cycle and by applying shorter flush times. | ||
Measurements of respiration rates (RR) and respiratory quotient (RQ)
The measurement cycle time depended on two factors: the total volume of the whole closed cycle and the respiration activity (and its decline) of the current branch under investigation. The total volume including all tubing summed up to approx. 50 and 60 ml for the drought and shading experiments, respectively. Within each experiment this total volume was determined by the following procedure: an overpressure of some tens mbar was applied for the closed cycle (including the chambered branch) via a gas syringe with defined gas volume of 5 ml under ambient conditions. By measuring the introduced pressure difference, the individual total volume of the closed cycle could be determined based on the ideal gas law for each experiment. Respiration rates for O2 and CO2 were very different for each branch segment and, according to the chambered biomass and respiration rates, the maximum threshold of the CO2 concentration was defined for each cycle, given a preset cycle time of less than one hour (including the flushing process). In order to maintain almost constant cycle durations during longer experimental periods of several days, the CO2 threshold value was reduced from initially 7000 ppm to 3000 ppm to account for treatment-induced decreases in respiration rates. After each treatment, the surface area of the investigated intact tree branch was determined with a LI-3100C® area meter (LI-COR, Lincoln, Nebraska USA) for individual needles and branches with a standard deviation of 1.5 and 0.4% for needles and branches, respectively. Using the total (needles and branch) surface area in m2, the total volume in ml, the atmospheric parameters p and T, and the Raman spectroscopically determined O2/CO2 concentration changes in per mille h−1, the RR were converted in µmol m−2 s−1. Linear fits of both concentration changes yielded the respiratory quotients defined by (Δc(CO2))/(−Δc(O2)).After flushing with CO2-free (synthetic) air, an immediate concentration increase of ∼300 ppm for CO2 occurred, since a small dead volume of the tubing between both magnetic valves could not be flushed and the remaining CO2 molecules distributed to the whole headspace after closing the open circuit for measurement (Fig. 2B). Thus measurements during the first three min after flushing (see Fig. 2A) were not used for the determination of the individual RR by linear concentration fitting. The fitting process in Fig. 2A resulted in slope of −3.91 ± 0.04 per mille h−1 and 3.86 ± 0.02 per mille h−1 for O2 and CO2, respectively (including the RR values from 0.05–0.85 h). This caused an overall error of ±0.02 for the resulting RQ of 0.99 in this example (13 subsequent slopes for a total time of ∼10 h). The precision for the Raman gas analyzer was defined with a relative error of 1% for the individual gas concentration.11 Hence, the contribution of O2 to the error in RQ (for overall small concentration changes) is higher than that of CO2 due to the generally higher O2 concentration of ∼20 vol% compared to some per mille for CO2. The precision (i.e. the standard deviation of values in a time trend) for continuous RR did not exceed 1% for both, O2 and CO2, which was experimentally established in a separate continuous measurement period of eight weeks (see result section). Because respiration rates declined during the max. 11 days of treatment, the error for individual RR increased up to 1.5%. The RR are reported both without and with averaging, the former to resolve rapid responses, e.g. day–night cycles in droughted spruce (Fig. 3A), the latter to highlight the temporal dynamics during the experimental period. The daily averaging introduced a standard deviation up to ±0.07 of mean RQ values but were smaller at the start and end of the treatments (±0.03).
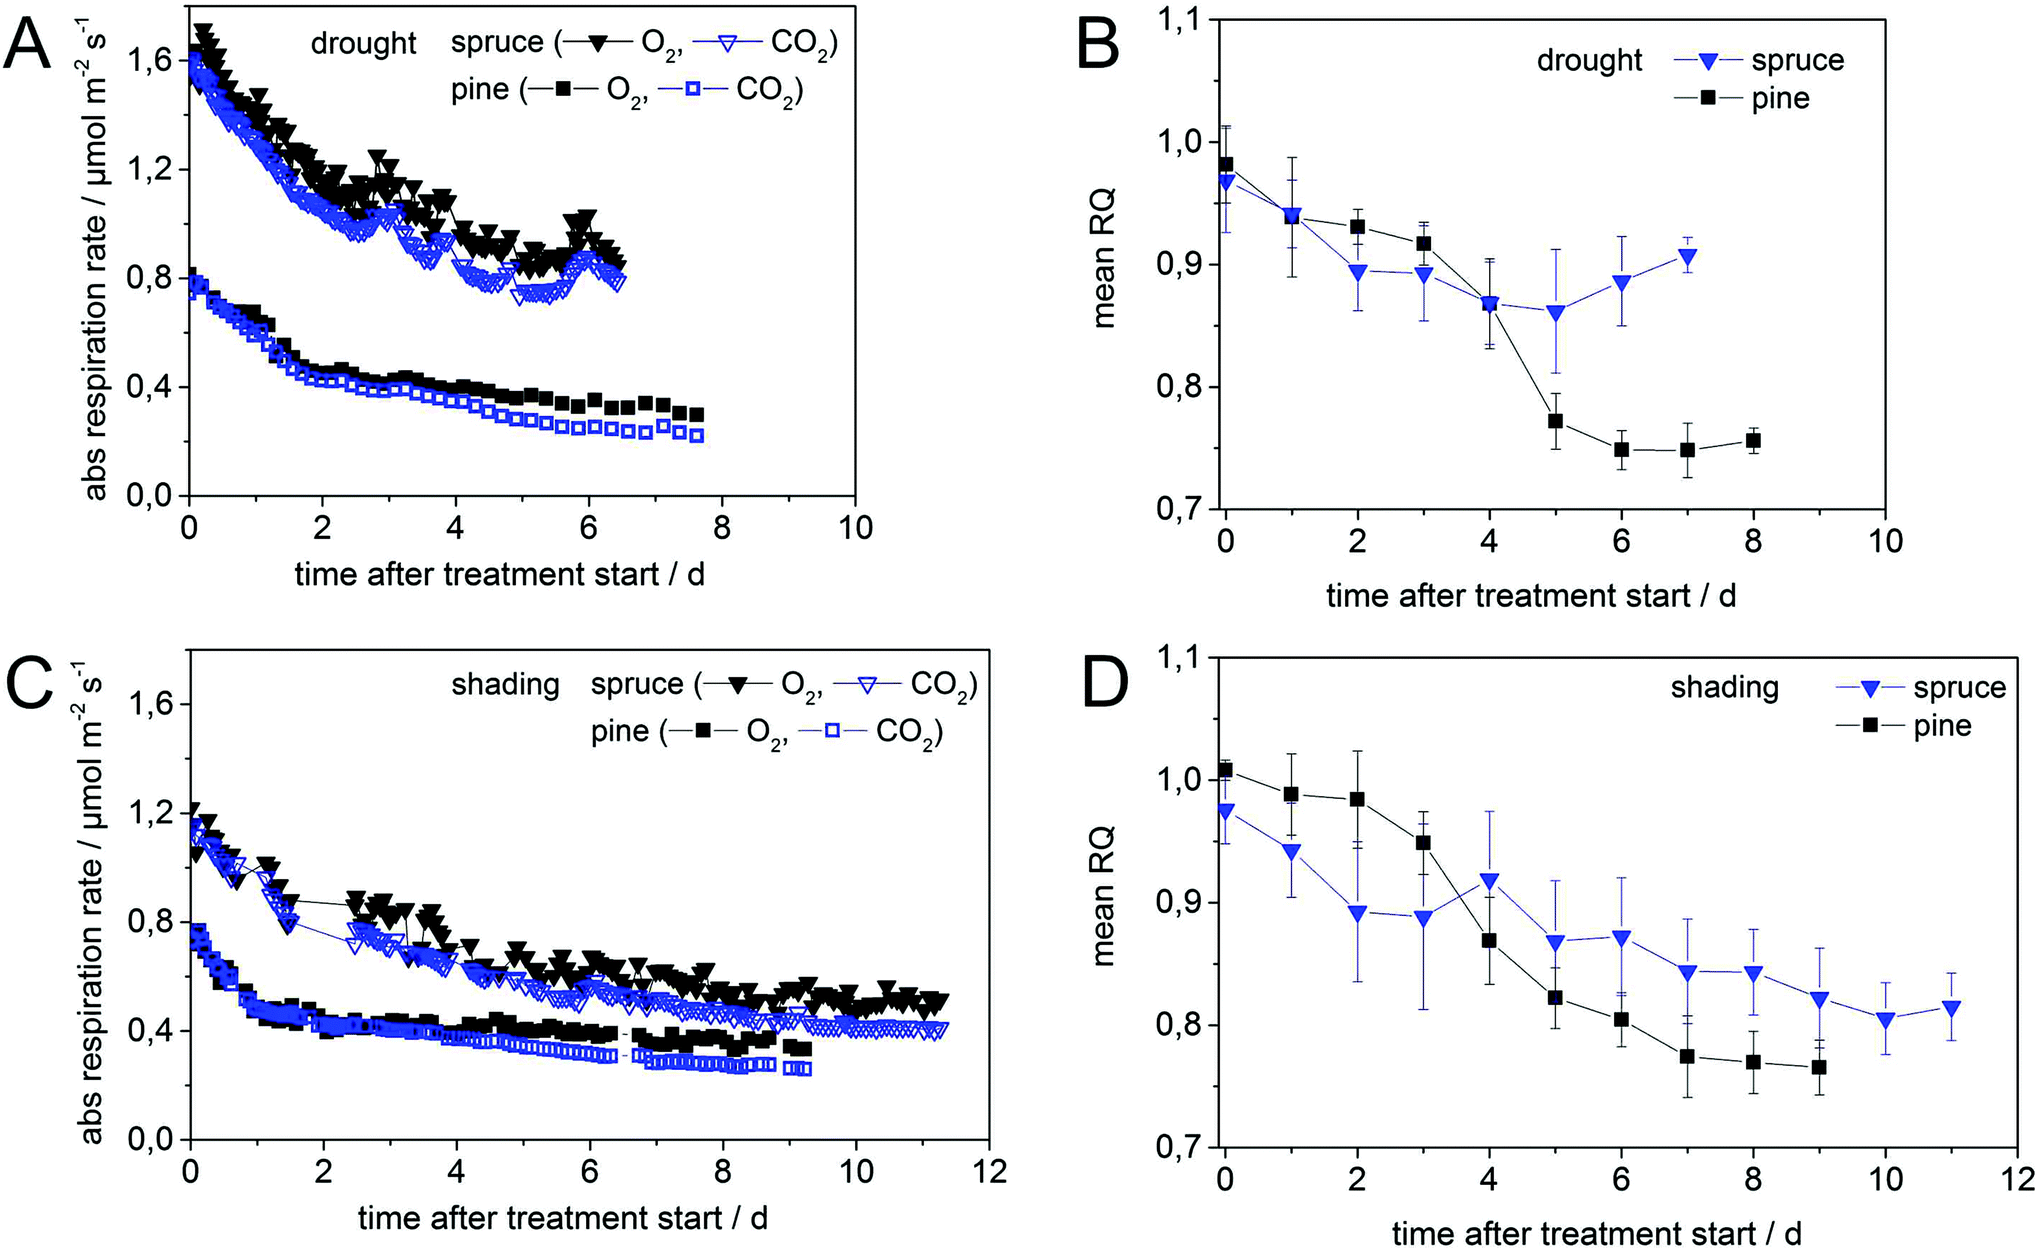 | ||
| Fig. 3 Online Raman multi-gas analysis of O2 and CO2 during branch dark respiration in pine and spruce showing absolute RR for drought (A) and shading (C) (left column) and daily averaged RQ values for drought (B) and shading (D) (right column). Treatments for drought (A, B: upper line) and shading (C, D: lower line) lasted 7 and 11 days, respectively. The RQ values were averaged per day to highlight the general trend (B, D). The data of RR for shaded spruce on day 2 are missing (C). | ||
Concentration measurements of non-structural carbohydrates
Glucose, fructose, sucrose, and inositol were analyzed as the major fraction of water soluble non-structural carbohydrates (WSC) as well as starch in leaves and branches. Samples were collected at the beginning and end of the experiment, cut, immediately frozen by immersion in liquid nitrogen, and kept on dry ice until they were placed in a freezer at −80 °C for longer term storage. For later extractions, the frozen samples were vacuum freeze-dried for 72 h and milled to fine powder with a ball mill (Retsch® MM200, Haan, Germany).For extractions of water soluble sugars, 50 mg of the samples were added to 1 ml of distilled water. The mixture was vortexed, incubated for 10 min at 65 °C in a thermomixer, and centrifuged for 6 min at 12000g. The supernatant was removed with a pipette and stored on ice and the procedure was repeated twice.12 The supernatants were pooled and stored frozen at −20 °C for later measurement. For starch hydrolysis, the same amount of ground sample (50 mg) was added to 0.35 ml distilled water, vortexed for 1 min and treated for 10 min in a thermomixer at 65 °C. An amount of 0.5 ml of 52% perchloric acid was then added and the mixture was agitated in an orbital shaker for 20 min. After centrifuging at 12000g for 6 min, the supernatant was removed with a pipette and the procedure was repeated on the remaining pellet.12 The supernatants from the two extractions were pooled and stored frozen at −20 °C for later measurement.
Soluble sugar and starch extracts were diluted (1:20 for soluble sugars, 1:55 for starch) and quantified with high-pressure liquid chromatography pulsed amperometric detection (HPLC-PAD) on a Dionex® ICS 3000 ion chromatography system equipped with an auto sampler. Starch concentrations were analyzed as the difference in glucose concentration in the hydrolyzed extract minus the glucose and half of the sucrose concentration in the water-soluble sugar extract multiplied by a conversion factor of 0.9.13
Lipid concentration measurement
The concentration of lipids (triacylglycerol) was determined using the method of Eggstein & Kuhlmann.14 One ml of 0.5 M NaOH was added to 10 mg of ground plant material, vortexed, and incubated in a thermomixer at 70 °C for 30 min for saponification of lipids (cleavage of fatty acids and glycerol). After cooling to room temperature an addition of 0.2 ml 2.5 M PCA neutralized the extract. Following vortexing and centrifuging at 12000g, an aliquot of 0.3 ml was diluted in 0.7 ml of bi-distilled water. The concentration of total glycerol was assessed by the enzymatic conversion of glycerol to glycerol-3-phosphate using photometry at 340 nm on a micro plate reader (Infinite M200, Tecan, Salzburg, Austria). Pure glycerol solutions in varying concentrations were used as standards. Enzymes were purchased from Sigma-Aldrich GmbH, Steinheim, Germany (glycero-kinase and lactate-dehydrogenase) and Roche Diagnostic GmbH, Mannheim, Germany (Pyruvate kinase).
Results and discussion
During the measurement cycles, CO2 concentrations increased while O2 concentrations decreased in the darkened (closed) chambers (Fig. 2). Afterwards the whole system was rapidly flushed with synthetic air (open chamber) causing O2 concentration to increase and CO2 concentrations to decrease (Fig. 2B). In order to test the reproducibility and accuracy of CERS-based RQ measurements, branches of four different control pine trees were measured over a period of eight weeks. Within this period, trees were watered and experienced a natural day and night cycle (no additional treatment or lighting was applied). The RR were averaged to (−1.28 ± 0.09) µmol m−2 s−1 and (1.21 ± 0.07) µmol m−2 s−1 for O2 and CO2, respectively. This resulted in an average RQ of 0.98 ± 0.02, in agreement with the stoichiometry of mainly carbohydrate combustion (starch, sucrose, glucose, fructose, and inositol). The standard deviation of ±0.02 represented the measurement precision for the RQ values, which was defined by the Raman gas sensor precision and the natural species variation of the trees. In the stress experiments (drought and shading), initial RQ values were close to 1.00 ± 0.03 for both investigated species (pine and spruce), indicating pure carbohydrate metabolism. The individual leaf area varied between 21–25 cm2 and 22–37 cm2 for pine and spruce, respectively.CERS investigations of pine
For droughted pine (Fig. 3A), initial respiration rates of approx. 0.8 µmol m−2 s−1 dropped to approx. 0.4 µmol m−2 s−1 within the first two days after initiating the treatment, whereas for the shaded pine (Fig. 3C) this initial decrease ceased already within the first day. The initial decline in RR for shaded tree was −0.22 µmol m−2 s−1 d−1 for the first day and decreased to −0.01 µmol m−2 s−1 d−1 for the remaining treatment period (Fig. 3A). The fast initial down-regulation of RR was accompanied by a minor decrease in RQ from 1.00 ± 0.02 to 0.97 ± 0.03 for shaded pine (Fig. 3D) and to 0.93 ± 0.03 for droughted pine (Fig. 3C) within the first day. The error of 0.03 for RQ was slightly higher than in control measurements and may indicate a non-steady state process (i.e. variation of RQ due to stress-initiation). In droughted pine, the RQ slightly decreased for another two days and then abruptly dropped to a value of 0.75 ± 0.02 within two days before remaining almost constant for additional five days (Fig. 3B). The RQ value of shaded pine decreased until day six to a value of 0.80 ± 0.03 before being almost stationary for the next three days with a final value of 0.77 ± 0.03 (Fig. 3D). In both treatments for pine the overall behavior of the RQ shows a sigmoidal decrease, most likely due to enzyme saturation,15 and the absolute RQ decline has a value of 0.23 (Table 1).| RR (µmol m−2 s−1) | RQ (SD) | |||||
|---|---|---|---|---|---|---|
| Start | End | RR diff. | Start | End | RQ diff. | |
| Pine, drought | −0.81 | −0.30 | 0.51 | 0.98 (0.03) | 0.75 (0.02) | −0.23 |
| Spruce, drought | −1.71 | −0.84 | 0.87 | 1.00 (0.02) | 0.90 (0.02) | −0.10 |
| Pine, shading | −0.77 | −0.33 | 0.44 | 1.00 (0.02) | 0.77 (0.03) | −0.23 |
| Spruce, shading | −1.22 | −0.50 | 0.77 | 0.97 (0.03) | 0.81 (0.03) | −0.16 |
CERS investigations of spruce
In spruce the initial respiration rates of 1.71 µmol m−2 s−1 (Fig. 3A) for drought differed from 1.22 µmol m−2 s−1 (Fig. 3C) for shading, most likely due a different acclimatization time in the laboratory for shading (three days instead of generally two days) prior to the treatment. For the droughted spruce, RR decreased rapidly within the first two days and then slower during the next three days to a value of 0.84 µmol m−2 s−1 (Fig. 3A). RR remained almost stationary for another two days until the treatment was stopped. Interestingly, RR of droughted spruce showed a distinct day–night cycle with higher rates during daytime than during the night (Fig. 3A). This most likely originated from two facts: changes in day–night temperatures and frequent changes in light conditions over the whole treatment period. The latter did not affect the chambered branch under investigation, but the rest of the tree. For this day–night-cycle of the RR the largest difference between minimum and maximum RR (for O2) occurred between 24 and 26 h after treatment start in the range of 0.078–0.090 µmol m−2 s−1 and was easily detectable by the high precision of the Raman gas analyzer (Fig. 3A). This strong day–night-cycle was to a lower degree also observed in droughted pine and shaded spruce (see periodic oscillations of O2 RR in Fig. 3A and C). The RR of shaded spruce decreases to a value of 0.82 µmol m−2 s−1 within the first one and a half days (Fig. 3C). This decline continued slowly for the next four days with a RR of 0.61 µmol m−2 s−1 after 5.5 days and approximately 0.50 µmol m−2 s−1 after eleven days (Fig. 3C), the end of the shading treatment. Similar absolute RR differences of 0.87 µmol m−2 s−1 and 0.77 µmol m−2 s−1 were observed in spruce for drought (within seven days) and shading (within eleven days) (Table 1). The dynamics in RR were mirrored by the RQ values in both treatments for spruce. Starting with an initial value of 1.00 ± 0.02, the RQ of droughted spruce rapidly decreased to 0.90 ± 0.04 after two days and remained close to this level (within error bars) for the next five days (Fig. 3B). The RQ of shaded spruce dropped initially from 0.97 ± 0.03 to 0.89 ± 0.05 within the first two days and decreased continuously and slowly to a final value of 0.81 ± 0.03 after a period of another 9 days until the treatment was stopped. The initial decline of −0.22 µmol m−2 s−1 d−1 in RR for droughted spruce during the first 2.5–3 days was similar to that of pine. Afterwards, the rate of decline remained on a relatively high level with −0.11 µmol m−2 s−1 d−1 (Fig. 3C). Contrary to pine, the initial decline rate in spruce of −0.10 µmol m−2 s−1 d−1 of the first four and a half days slowed down to −0.02 µmol m−2 s−1 d−1 for the remaining period of the shading treatment, indicating the mobilization and continued use of stored carbon compounds (Fig. 3C).Independent of treatment and species, initial respiration rates dropped in the first one to two days rapidly to 50–70% of initial values and continued with smaller decrease until the end of the treatments. All data are summarized in Table 1.
Analysis of respiration substrates
Starch concentrations declined under drought in both tree species (Fig. 4E) from similar initial substrate levels (Fig. 4A and C), but increased in shading treatments (Fig. 4F). Initial WSC concentrations (given in mg g−1) were higher in spruce than in pine for both treatments, but final WSC concentrations approached in branches and needles of both species. This may be a consequence of the faster down-regulation of metabolism in pine than in spruce. The greater decline in lipid concentration in spruce (Fig. 4A–D) may indicate a higher proportion of lipid metabolism during shading6c than during drought and hence also corroborates the lower RQ in this treatment (Table 1). None of the treatments completely depleted any of the pools (Fig. 4C and D), which was probably a result of the rapid down-regulation of respiration rates in both species following the start of treatments (Fig. 3A and C) and also due to the short duration of the treatment (max. eleven days).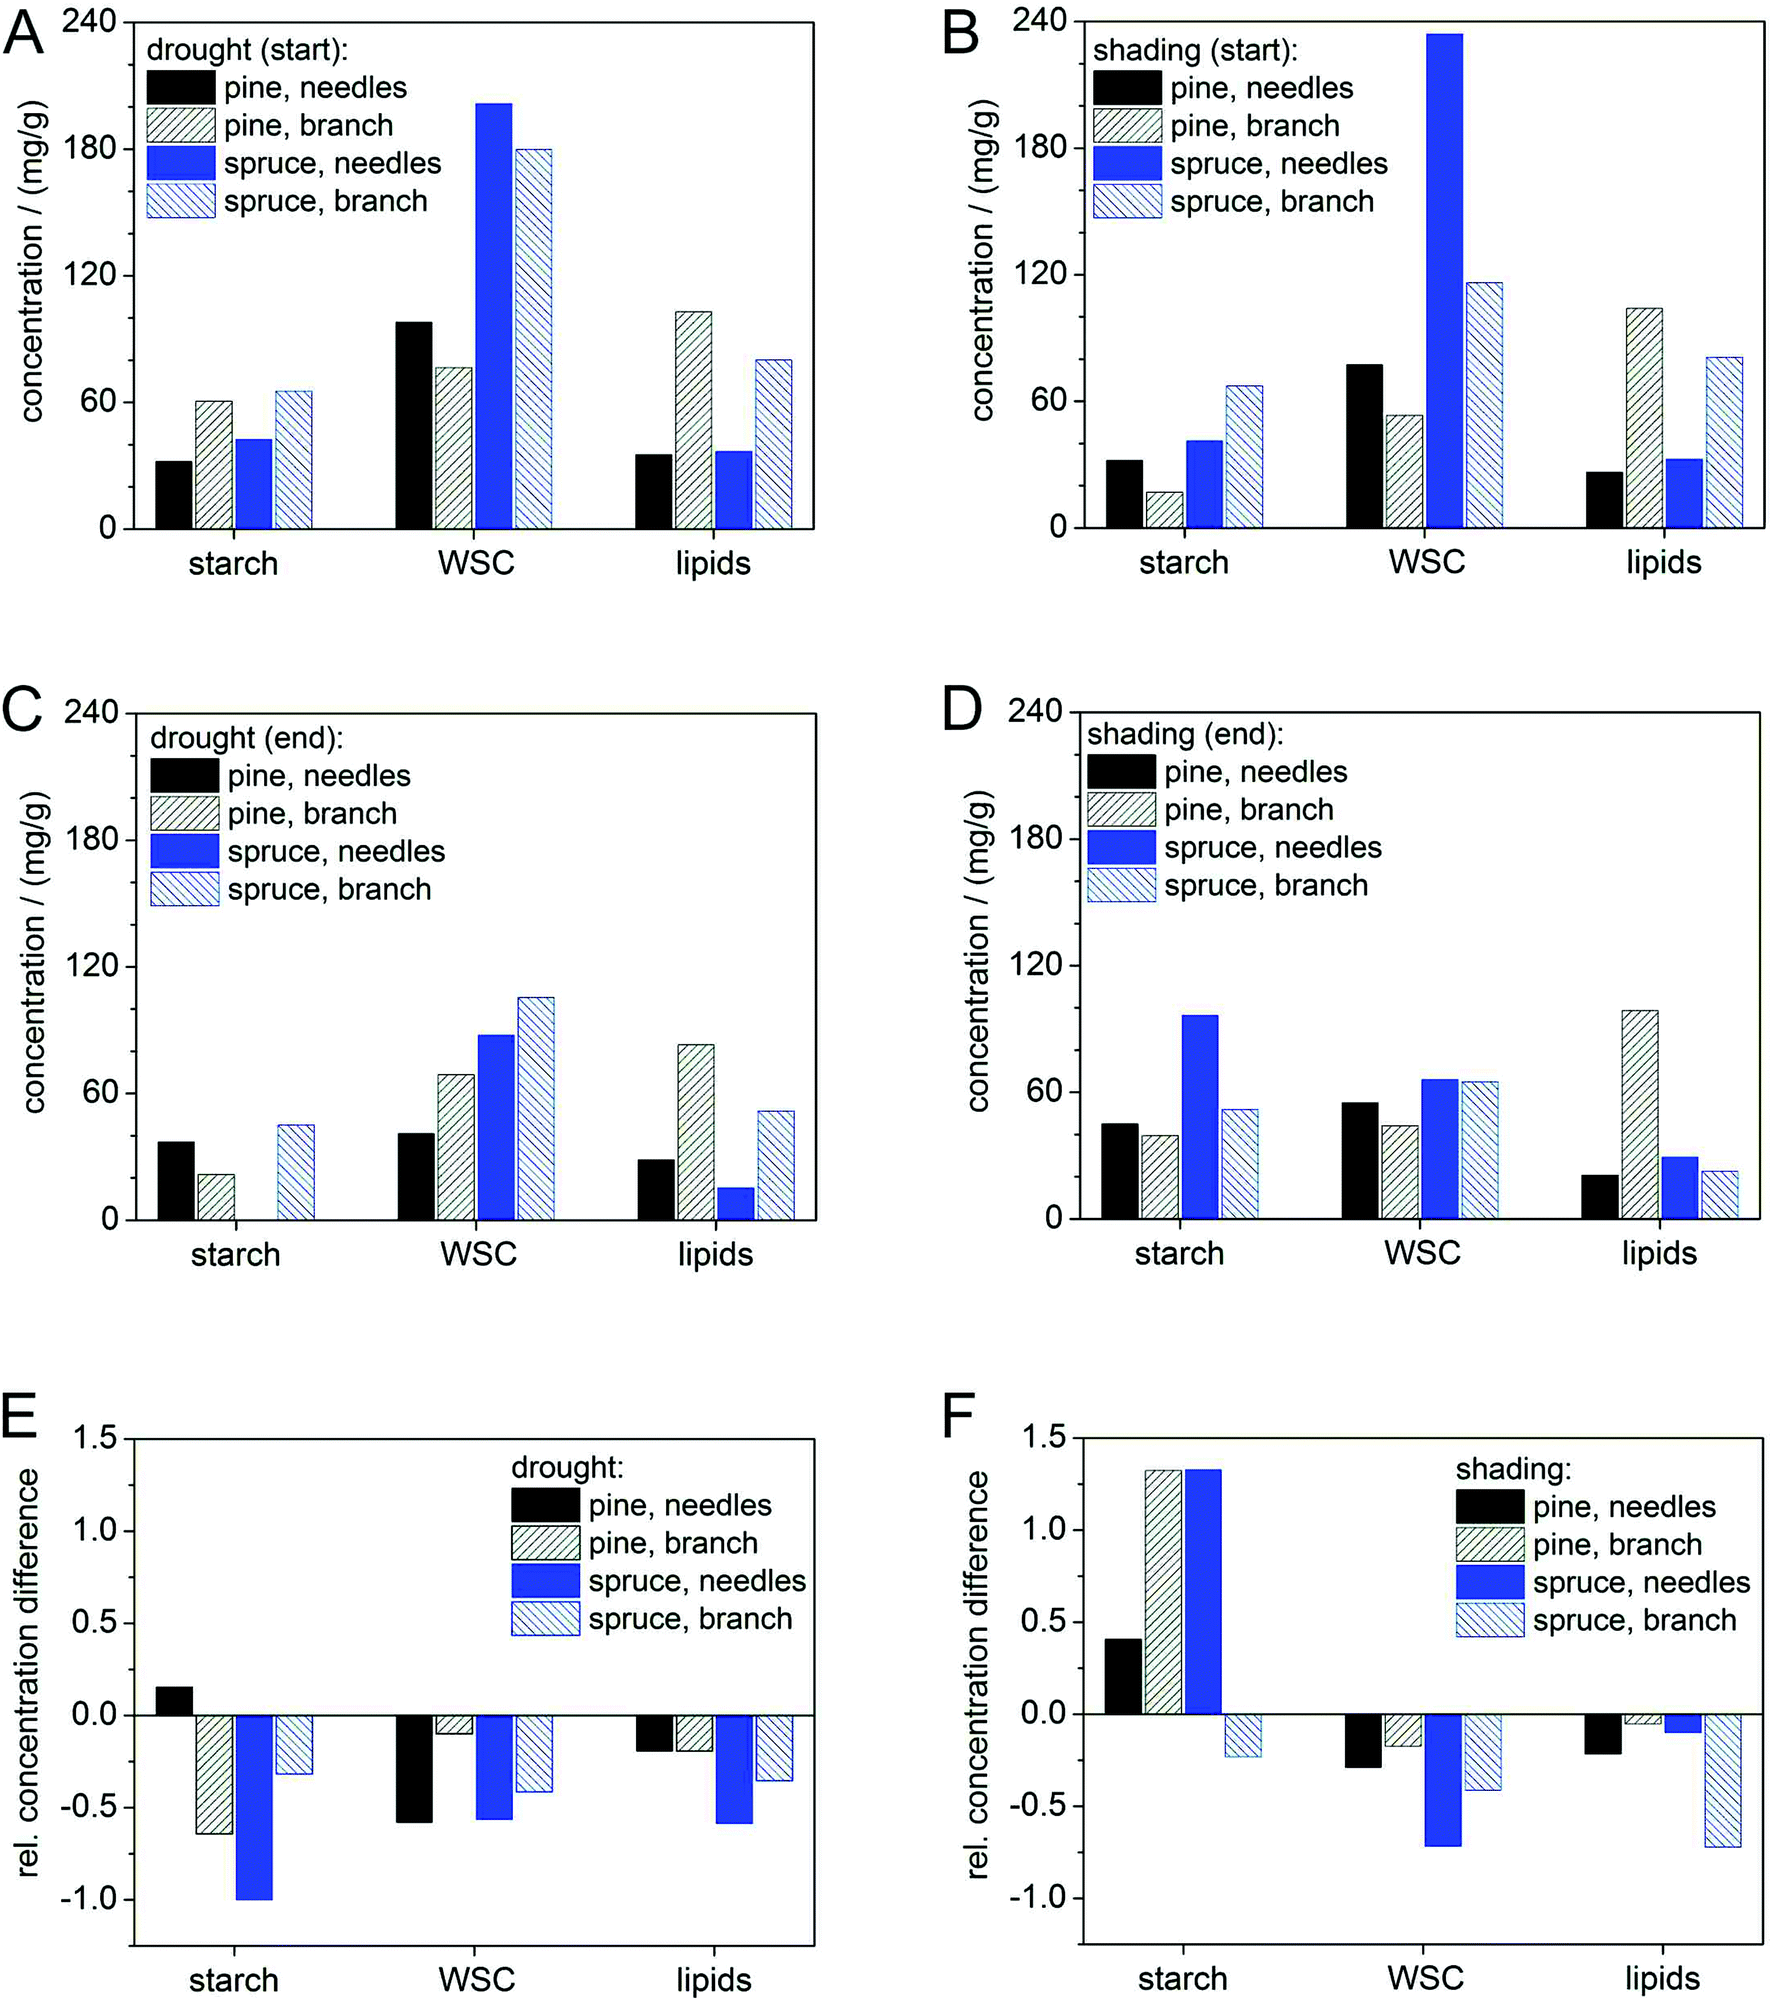 | ||
| Fig. 4 Absolute concentrations (A–D) and relative differences (E, F) in respiration substrate between start (A, B) and end (C, D) of drought (A, C, E: left column) and shading (B, D, F: right column) for starch, water soluble carbohydrates (WSC: glucose, fructose, sucrose, and inositol), and lipids in needles and branches of pine and spruce. Relative differences relate to the start concentration, respectively. | ||
While the initial decline in respiration rates in both species may be attributed to a sudden decrease of primary photosynthates due to stomatal closure16 or shading,4 the continuous strong decline of RR in spruce could be mediated by the impediment of storage remobilization and translocation via dehydration.17 This is corroborated by the different results obtained in the shading treatment although concentrations of those substrates (i.e. carbohydrates) did not show a clear indication for a continuous mobilization.
Our results indicate that pine was able to mobilize and use stored carbon compounds more readily than spruce, in both treatments. However, carbon pool dynamics in pine were also not very insightful and our substrate data do not provide a strong support for RQ measurements in this species. This may be in part due to methodological difficulties in accurately determining carbohydrate concentrations in tree tissues. Moreover, the down-regulation of catabolic activity may have reduced carbon requirements to such an extent that carbon pool changes could not be detected. Accumulating carbon release from respiration for the entire experimental period and comparing it with changes in substrate pools could potentially verify this. Unfortunately, our experimental design does not allow closing the energy balance of the measured branch section, because our carbon pool measurements do not account for carbon import or export from or to other plant parts.
So far, investigations of respiratory physiology under sugar starving conditions, specifically addressing lipid and protein metabolism, are sparse and restricted to cell cultures and excised tissues studies.6a In these studies changes in substrate use during starvation showed a series of specific events controlled by carbohydrate availability.6d In our study, conclusive simultaneous declines in RR, RQ, and concentrations of putative respiratory substrates in pine and spruce under carbon limitation were not contradictory to previous findings in sugar starving cells and excised plant tissues.6a,d After an initial down-regulation of respiration rates, metabolism of excised tissues gradually switched from carbohydrates to proteins and lipids. Starvation studies on intact herbaceous plants indicate similar patterns during shading but are restricted to castor bean (Phaseolus vulgaris L.).6c
Conclusion and outlook
This study demonstrated the unique capabilities of cavity-enhanced multi-gas Raman spectrometry (CERS) for accurate online quantification of respiration rates (RR) and changes in the respiratory quotient (RQ) in trees exposed to stress treatments. With CERS it was possible to quantify O2 and CO2 concentrations and it minor relative changes simultaneously and monitor the dark respiration rates of chambered branches in situ continuously over periods of up to 11 days. Those measurements are challenging due to the ambient background of approx. 21 vol% O2 content and 400 ppm CO2 concentration. The high temporal resolutions of RR reported here (<1 h) were adequate to elucidate rapid physiological responses, such as day–night-cycle dependent variations of the respiratory rates, but also more long-term changes (over days) in key physiological parameters of stressed trees.CERS outmatches other gas sensing techniques for highly precise RQ measurements in ecophysiological studies on plant metabolism due to some essential features:
• Raman spectroscopic multi-gas monitoring allows fast and simultaneous analysis of several gases in complex mixtures (also homonuclear diatomics O2, N2, and H2) without altering the gas composition or showing any cross-sensitivities.
• CERS combines a high chemical selectivity with a high sensitivity for the precise quantification of changes in CO2 concentrations from e.g. 400 to 500 ppm associated with changes in O2 concentrations from 209.400 to 209.300 ppm (for RQ = 1) and thus the simultaneous monitoring of relative differences of 25% and 0.05%.
• The versatile CERS device is very robust and portable and therefore suitable for in situ online analysis on trees with long-term stability and no need of maintenance over periods of weeks.
The application of this novel CERS technology hence allowed deep insights into plant ecophysiology, e.g. that greater drought tolerance in pine (compared to spruce) might be linked to its greater flexibility in substrate use for respiration. A sigmoidal decrease of the RQ values was observed in both treatments for pine down to a value of 0.75. However, the experimental design was tailored for testing the suitability of CERS for applications in plant science, not for ecological research per se. Based on the findings of this study, additional experiments under controlled environmental conditions should be designed and carried out, with sufficient replication and control treatments. Such experiments will yield profound insights into plant functioning and can contribute to substantially accelerate progress in plant science. We therefore foresee that this innovative CERS approach will tremendously advance studies aiming at detecting nutrition shifts at the whole-tree scale and in response to environmental stress.
Acknowledgements
Funding by the Collaborative Research Centre 1076 “AquaDiva” from the Deutsche Forschungsgemeinschaft (DFG) is highly acknowledged. S.H. gratefully acknowledges support from the International Max-Planck Research School (IMPRS) “Global Biogeochemical Cycles”. The authors thank Anett Enke, Iris Kuhlmann, Savoyane Lambert, and Waldemar Ziegler for technical support during the implementation of the experiment and for sample processing.References
- L. Taiz and E. Zeiger, Plant Physiology, Sinauer Associates, 2010 Search PubMed.
- J. Darnell, Molecular Cell Biology, Freeman & Company, 1986 Search PubMed.
- (a) H. B. Richardson, The Respiratory Quotient, 1929, vol. 9, pp. 61–125 Search PubMed; (b) T. Boegoezi, J. Popp and T. Frosch, Fiber-enhanced Raman multi-gas spectroscopy - what is the potential of its application to breath analysis?, Bioanalysis, 2015, 7(3), 281–284 CrossRef CAS PubMed.
- S. Sevanto, N. G. McDowell, L. T. Dickman, R. Pangle and W. T. Pockman, How do trees die? A test of the hydraulic failure and carbon starvation hypotheses, Plant, Cell Environ., 2014, 37(1), 153–161 CrossRef CAS PubMed.
- N. McDowell, W. T. Pockman, C. D. Allen, D. D. Breshears, N. Cobb, T. Kolb, J. Plaut, J. Sperry, A. West, D. G. Williams and E. A. Yepez, Mechanisms of plant survival and mortality during drought: why do some plants survive while others succumb to drought?, New Phytol., 2008, 178(4), 719–739 CrossRef PubMed.
- (a) R. Brouquisse, F. James, P. Raymond and A. Pradet, Study of Glucose Starvation in Excised Maize Root Tips, Plant Physiol., 1991, 96(2), 619–626 CrossRef CAS PubMed; (b) P. H. Saglio and A. Pradet, Soluble Sugars, Respiration, and Energy Charge during Aging of Excised Maize Root Tips, Plant Physiol., 1980, 66(3), 516–519 CrossRef CAS PubMed; (c) G. Tcherkez, S. Nogues, J. Bleton, G. Cornic, F. Badeck and J. Ghashghaie, Metabolic origin of carbon isotope composition of leaf dark-respired CO2 in French bean, Plant Physiol., 2003, 131(1), 237–244 CrossRef CAS PubMed; (d) M. Dieuaide-Noubhani, P. Canioni and P. Raymond, Sugar-Starvation-Induced Changes of Carbon Metabolism in Excised Maize Root Tips, Plant Physiol., 1997, 115(4), 1505–1513 CAS.
- F. F. Calegario, R. G. Cosso, F. V. Almeida, A. E. Vercesi and W. F. Jardim, Determination of the respiration rate of tomato fruit using flow analysis, Postharvest Biol. Technol., 2001, 22(3), 249–256 CrossRef.
- O. Lamikanra and S. H. Imam, Produce Degradation: Pathways and Prevention, Taylor & Francis, 2005 Search PubMed.
- (a) T. Frosch, D. Yan and J. Popp, Ultrasensitive Fiber Enhanced UV Resonance Raman Sensing of Drugs, Anal. Chem., 2013, 85(13), 6264–6271 CrossRef CAS PubMed; (b) S. Hanf, R. Keiner, D. Yan, J. Popp and T. Frosch, Fiber-enhanced Raman multigas spectroscopy: a versatile tool for environmental gas sensing and breath analysis, Anal. Chem., 2014, 86(11), 5278–5285 CrossRef CAS PubMed; (c) T. Frosch and J. Popp, Structural analysis of the antimalarial drug halofantrine by means of Raman spectroscopy and density functional theory calculations, J. Biomed. Opt., 2010, 15(4), 041516 CrossRef PubMed; (d) T. Frosch and J. Popp, Relationship between molecular structure and Raman spectra of quinolines, J. Mol. Struct., 2009, 924–926, 301–308 CrossRef CAS PubMed; (e) T. Frosch, S. Koncarevic, K. Becker and J. Popp, Morphology-sensitive Raman modes of the malaria pigment hemozoin, Analyst, 2009, 134(6), 1126–1132 RSC; (f) S. Hanf, T. Boegoezi, R. Keiner, T. Frosch and J. Popp, Fast and highly sensitive fiber enhanced Raman spectroscopic monitoring of molecular H2 and CH4 for point-of-care diagnosis of malabsorption disorders in exhaled human breath, Anal. Chem., 2015, 87(2), 982–988 CrossRef CAS PubMed.
- (a) R. Keiner, T. Frosch, T. Massad, S. Trumbore and J. Popp, Enhanced Raman multigas sensing - a novel tool for control and analysis of (13)CO2 labeling experiments in environmental research, Analyst, 2014, 139(16), 3879–3884 RSC; (b) R. Keiner, T. Frosch, S. Hanf, A. Rusznyak, D. M. Akob, K. Kusel and J. Popp, Raman Spectroscopy-An Innovative and Versatile Tool To Follow the Respirational Activity and Carbonate Biomineralization of Important Cave Bacteria, Anal. Chem., 2013, 85, 8708–8714 CrossRef CAS PubMed; (c) R. Keiner, M. Herrmann, K. Kuesel, J. Popp and T. Frosch, Rapid monitoring of intermediate states and mass balance of nitrogen during denitrification by means of innovative cavity enhanced Raman multi-gas sensing, Anal. Chim. Acta, 2015, 864, 39–47 CrossRef CAS PubMed; (d) T. Jochum, B. Michalzik, A. Bachmann, J. Popp and T. Frosch, Microbial respiration and natural attenuation of benzene contaminated soils investigated by cavity enhanced Raman multi-gas spectroscopy, Analyst, 2015, 140(9), 3143–3149 RSC; (e) R. Keiner, M. C. Gruselle, B. Michalzik, J. Popp and T. Frosch, Raman Spectroscopic Investigation of 13CO2 Labeling and Leaf Dark Respiration of Fagus sylvatica L. (European Beech), Anal. Bioanal. Chem., 2015, 407, 1813–1817 CrossRef CAS PubMed.
- T. Frosch, R. Keiner, B. Michalzik, B. Fischer and J. Popp, Investigation of gas exchange processes in peat bog ecosystems by means of innovative Raman gas spectroscopy, Anal. Chem., 2013, 85(3), 1295–1299 CrossRef CAS PubMed.
- M. Raessler, B. Wissuwa, A. Breul, W. Unger and T. Grimm, Chromatographic analysis of major non-structural carbohydrates in several wood species – an analytical approach for higher accuracy of data, Anal. Methods, 2010, 2(5), 532 RSC.
- J. T. Sullivan, The Estimation of Starch, Ind. Eng. Chem., Anal. Ed., 1935, 7(5), 311–314 CrossRef CAS.
- M. Eggstein and E. Kuhlmann, Triglyceride und glycerin, Methoden enzym. Anal., 1974, 2, 1871–1877 CAS.
- H. Lambers and M. Ribas-Carbo, Plant Respiration: From Cell to Ecosystem, Springer, 2006 Search PubMed.
- J. Flexas, J. Bota, J. Galmes, H. Medrano and M. Ribas-Carbó, Keeping a positive carbon balance under adverse conditions: responses of photosynthesis and respiration to water stress, Physiol. Plant., 2006, 127(3), 343–352 CrossRef CAS PubMed.
- H. Hartmann, W. Ziegler, O. Kolle and S. Trumbore, Thirst beats hunger – declining hydration during drought prevents carbon starvation in Norway spruce saplings, New Phytol., 2013, 200(2), 340–349 CrossRef CAS PubMed.
- (a) H. E. Howard-Lock and B. P. Stoicheff, Raman intensity measurements of the Fermi diad ν1, 2ν2 in 12CO2 and 13CO2, J. Mol. Spectrosc., 1971, 37(2), 321–326 CrossRef CAS; (b) S. Montero, Raman intensities of Fermi diads. I. Overtones in resonance with nondegenerate fundamentals, J. Chem. Phys., 1983, 79(9), 4091–4100 CrossRef CAS PubMed.
| This journal is © The Royal Society of Chemistry 2015 |