 Open Access Article
DESI MS based screening method for phthalates in consumer goods
Sabine
Schulz
*a,
Sebastian
Wagner
a,
Stefanie
Gerbig
a,
Herbert
Wächter
b,
Detlef
Sielaff
c,
Dieter
Bohn
d and
Bernhard
Spengler
a
aInstitute of Inorganic and Analytical Chemistry, Justus Liebig University Giessen, Germany. E-mail: sabine.schulz@anorg.chemie.uni-giessen.de
bBavarian State Laboratory for Health and Food safety, Erlangen, Germany
cState Laboratory of Rhineland-Palatinate, Koblenz, Germany
dHesse State Laboratory, Giessen, Germany
First published on 25th March 2015
Abstract
Phthalates are used as plasticizes in many everyday items, but some of them are known as hormone disruptors, being especially harmful during childhood. The European Union therefore restricted their application in children's toys and certain food packaging to 0.1%w. Due to the ever increasing number of plastic-containing consumer goods, rapid screening methods are needed to ensure and improve consumer safety in the future. In this study we evaluated the performance of desorption electrospray ionization (DESI) mass spectrometry (MS) for rapid quantitative screening of phthalates in toys. DESI allowed for direct surface sampling of the toys under atmospheric conditions with minimal sample preparation, while the high performance mass spectrometer used provided a high sensitivity and reliable identification via accurate mass measurements, high mass resolving power and MS/MS capabilities. External calibration curves for six banned phthalates (DBP, BBP, DEHP, DNOP, DINP and DIDP) were obtained from matrix-matched reference materials. Coefficients of determination were greater than 0.985, LOQs ranged from 0.02%w (DIDP) to 2.26%w (DINP) and the relative standard deviation of the calibration curve slope was less than 7.8% for intraday and 11.4% for interday comparison. The phthalate contents of eleven authentic samples were determined in a proof-of-concept approach using DESI MS and results were compared to those from confirmatory methods. The phthalate content was correctly assigned with relative deviations ranging from −20% to +10% for the majority of samples. Given further optimization and automation, DESI MS is likely to become a useful tool for rapid and accurate phthalate screening in the future.
Introduction
Phthalates are used in many applications to soften polyvinylchloride (PVC) polymers. In 2012 the world production of phthalate anhydride was 4.3 million tons.1 When mixed with PVC powder a gel-like plastisol is formed which can be solidified to any desired shape by heating. The flexibility of the resulting product is dependent on the phthalate content, generally ranging from 5–40%w. This effect is based on the incorporation of phthalates into the polymeric structure of PVC weakening the dipole forces between the chains. Since phthalates are not covalently bound, they tend to leak out of the PVC into the environment. Although they are not acutely toxic, they are recognized as hormone disruptors, being especially harmful to male unborn children, babies and infants.2–5 Phthalates are incorporated into the body mainly orally via food or inhalation, but also dermally via personal care products, and during medical treatment. Babies and infants generally have considerably higher urinary phthalate concentrations than adults due to mouthing of e.g. toys and closer contact to the flooring.6 To address possible endocrine risks related to phthalates the European Union (EU) established a maximum limit of 0.1%w for several phthalates in toys (DECISION 1999/815/EG) and of 0.05–0.1%w in food contact materials (DIRECTIVE 2007/19/EC). The regulated phthalates are dibutyl phthalate (DBP), diethylhexyl phthalate (DEHP) diisononylphthalate (DINP), diisodecyl phthalate (DIDP), di-n-octyl phthalate (DNOP) and benzyl butyl phthalate (BBP). Since then continual analyses of products on the European market have been performed. Nevertheless still more than 40% of the entries (184 out of 412) listed in the European rapid alert system for consumer goods (RAPEX), containing chemical hazards, are related to phthalates (2012).7 Considering that sampling is performed in a random manner, the number of phthalate-containing products entering the market is probably much higher than the detected number listed in RAPEX. Methods for routine analysis of phthalates are time-consuming and typically involve sample extraction followed by chromatography and mass spectrometric, UV/Vis spectroscopic or flame ionization detection.8–10 The most accepted rapid screening method is attenuated total reflection infrared spectroscopy (ATR-IR).11,12 This method allows the determination of the total phthalate content in a couple of minutes. Detection and quantification limits range from <0.1%w to 2.5%w depending on the instrument. Reliable identification of phthalate species or mixtures, however, is hard to achieve with ATR-IR due to the strong interferences with PVC background signals and the relatively subtle spectral differences of phthalate species. Recently several mass spectrometric methods using ambient ionization such as Direct Analysis in Real Time (DART),13–15 Direct Inlet Probe-Atmospheric Pressure Chemical Ionization (DIP-APCI)16 and Flowing Afterglow Atmospheric Pressure Glow Discharge (FA-APGD)17 have been suggested for rapid screening of phthalates in solid samples. These surface sampling methods do not need a time-consuming sample preparation; they work under atmospheric pressure and allow for sensitive and reliable identification within less than a minute, due to mass spectrometric detection. The quantitative performance of these ambient ionization methods, however, has just started to be explored, and no methods for phthalate quantification in authentic samples have been published so far. In this study we evaluated the performance of another MS-based ambient ionization technique, Desorption Electrospray Ionization (DESI), for the identification and quantification of phthalates in consumer goods. DESI was first described in 200418 and utilizes a spray of charged droplets (electrospray) to extract, desorb and ionize analytes from a sample surface. Using external calibration curves from matrix-matched reference materials we determined the phthalate content in authentic samples and compared the results with values from confirmatory methods. We report limits of detection (LOD) and of quantification (LOQ) for the six regulated phthalates as well as quantification errors for authentic samples. Furthermore we discuss the compliance of the method to the performance guidelines for analytical methods, used in controls of food contact materials.Experimental
Chemicals
Diisodecyl phthalate (DIDP), di-n-octyl phthalate (DNOP), benzyl butyl phthalate (BBP) were purchased from Tokyo Chemical Industry Co., Ltd (Tokoy, Japan). Dibutyl phthalate (DBP), diisononylphthalate (DINP) and water (LC grade) were purchased from Sigma Aldrich Chemie GmbH (Steinheim, Germany). Diethylhexyl phthalate (DEHP) was purchased from Bernd Kraft GmbH (Duisburg, Germany). Methanol was purchased in Uvasol quality from Merck KGaA (Darmstadt, Germany). Hexamoll DINCH (1,2-cyclohexane dicarboxylic acid diisononyl ester) was kindly provided by Combi GmbH (Mönchengladbach, Germany). Polyvinyl chloride powder Vinnolit P 70 was kindly provided by Vinnolit GmbH & Co. KG (Burghausen, Germany).Sample preparation
Plastisols with varying concentrations of phthalates were produced as authentic standards for the generation of calibration curves. For each phthalate, 12 plastisols were made, containing 0, 0.01, 0.1, 1, 5, 10, 15, 20, 25, 30, 35 and 40%w of the phthalate. Each plastisol was prepared by mixing PVC powder, the desired amount of phthalate standard and a calculated amount of DINCH in a glass vial until a homogenous paste was formed. The amount of DINCH was calculated to obtain a total amount of plasticizer (DINCH + phthalate) of 40%w in the prepared plastisols. The paste was then filled into an aluminium mold containing wells of 6 mm in diameter and 2 mm in height and kept in an oven for 15–20 min at 200 °C. After this solidification step flexible plastisol discs were removed from the aluminium mold. Discs were then fixed onto a glass plate or to the backside of an aluminium plate using double sided adhesive tape.Authentic samples were kindly provided by the Hesse State Laboratory (Giessen, Germany), the State Laboratory of Rhineland-Palatinate (Koblenz, Germany) and the Bavarian State Laboratory for Health and Food Safety (Erlangen, Germany). Phthalate content of the samples was first determined using the validated methods of the state laboratories before they were analyzed with DESI MS. Validated methods included gas chromatography (GC) coupled to flame ionization detection (FID) or mass spectrometric detection (MS) and high performance liquid chromatography coupled to diode array detection (DAD). For DESI MS a small piece was cut from the real sample (approximately 5 × 5 mm) and fixed to a glass plate or the backside of an aluminium plate using double sided adhesive tape.
DESI MS measurement
DESI MS experiments were carried out with a home-built DESI ion source coupled to an orbital trapping mass spectrometer (Exactive, Thermo Fisher Scientific GmbH, Bremen, Germany). The DESI ion source was operated at 2.5 kV spray voltage, a nitrogen pressure of 6 bar and a solvent flow rate of 5 μl min−1. A mixture of methanol–water 9![[thin space (1/6-em)]](https://www.rsc.org/images/entities/char_2009.gif) :
:![[thin space (1/6-em)]](https://www.rsc.org/images/entities/char_2009.gif) 1 was used as solvent. The sample-to-sprayer distance was about 2 mm, the distance between sprayer and MS inlet was about 3–5 mm and the spray angle was 65° to the sample surface. The source was equipped with a computer-controlled moving stage manufactured by Danaher Precision Systems (NH, USA). The stage was operated by Servo Design Kit software V 5.22 by Galil Motion Control (CA, USA) triggering also the mass spectrometric measurement. The mass spectrometric analysis was performed in positive ion mode in a mass-to-charge range of 150 to 500. The mass resolution was set to 50
1 was used as solvent. The sample-to-sprayer distance was about 2 mm, the distance between sprayer and MS inlet was about 3–5 mm and the spray angle was 65° to the sample surface. The source was equipped with a computer-controlled moving stage manufactured by Danaher Precision Systems (NH, USA). The stage was operated by Servo Design Kit software V 5.22 by Galil Motion Control (CA, USA) triggering also the mass spectrometric measurement. The mass spectrometric analysis was performed in positive ion mode in a mass-to-charge range of 150 to 500. The mass resolution was set to 50![[thin space (1/6-em)]](https://www.rsc.org/images/entities/char_2009.gif) 000 at m/z 200, and the obtained mass accuracy was better than ±4 ppm. In order to measure a calibration curve the sample holder with the plastisol discs was moved with a fixed speed of 500 μm s−1, exposing each plastisol disc to the DESI spray for a defined time. Mass spectra were recorded continuously with a fixed ion injection time of 500 ms.
000 at m/z 200, and the obtained mass accuracy was better than ±4 ppm. In order to measure a calibration curve the sample holder with the plastisol discs was moved with a fixed speed of 500 μm s−1, exposing each plastisol disc to the DESI spray for a defined time. Mass spectra were recorded continuously with a fixed ion injection time of 500 ms.
Authentic samples were measured the same way as the calibration curves. Both were analysed in triplicate. Reproducibility was checked on three different days. For spatially resolved DESI MS analysis the whole surface of the disc was scanned line by line. Identities of isomeric phthalates were determined via MS/MS experiments.
Data analysis
Results
Method development and validation
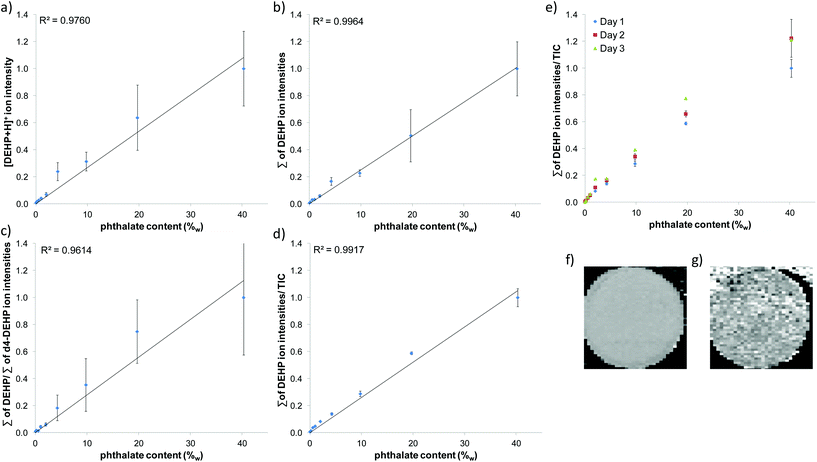
Measurement parameters such as spray voltage, solvent composition, flow rate, measurement geometry and scan speed were optimized using SPE frits (6 mm in diameter) which were loaded with 20 μl of phthalate solution with varying concentrations and fixed to a glass plate. DESI solvent and sample holder material were recognized as the most critical parameters in order to achieve good limits of detection (LOD). Due to their intensive use in PVC plastics and their properties to adsorb to dust, phthalates are ubiquitous and can be detected from every surface and solvent. Therefore care needs to be taken to use only solvents which feature low contamination by phthalates, to obtain low background signals. Best practice was to avoid plastic containers and decanting from manufacturer solvent bottles where possible. Sample holders made of glass and aluminium featured low phthalate background after cleaning, but poly(methyl methacrylate) gave high background signals even after cleaning. The geometry of the DESI setup, solvent flow rate and spray voltage were chosen in a way that a stable spray or signal was only maintained on the SPE frits and later the plastisol surface. It dropped considerably in intensity when the sprayer moved away from the frit/plastisol discs due to the height difference between SPE/plastisol surface and sample holder. This facilitated the data interpretation by reducing the phthalate background signal derived from the sample holder. Size and thickness of plastisol discs were optimized. A diameter of 6 mm and a height of 2 mm allowed for best handling and appropriate measurement time. For further reduction of background signals and signal variations due to small sample height differences, an aluminium plate with holes (3 mm in diameter) was used as a mask. Plastisol discs and authentic samples were fixed in the holes from the backside of the aluminium plate, while the DESI sprayer was moved along the front side. This resulted in distinct peaks whenever a sample was hit by the DESI spray (Fig. 1). Fig. 1 shows the DESI MS raw data collected from the plastisol standards which were prepared to obtain a calibration curve for DBP. Fig. 1a) shows the ion chronogram of DBP. Each peak in the chronogram corresponds to one plastisol standard. The DBP content in the plastisol standards was increasing as depicted in the figure. Total measurement time for the generation of a calibration curve with 12 points was 3.3 min. Fig. 1b) shows the DESI mass spectrum obtained from the 15%w plastisol. Generally plasticizer signals and signals originating from the DESI spray dominated the mass spectra, and only low background signals were observed from PVC. For DINCH and DBP the protonated ion as well as the ions corresponding to sodium and potassium adducts were detected with high mass accuracy. Different types of data analysis and normalization were tested in order to obtain best linearity and reproducibility (Fig. 2). Furthermore the addition of a deuterated standard to the DESI solvent and normalization to it were tested.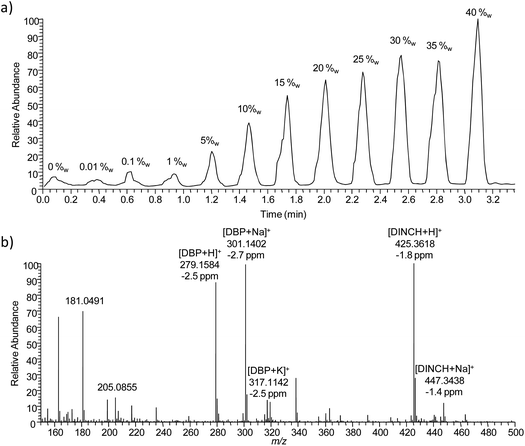 | ||
| Fig. 1 (a) DESI MS ion chronogram of protonated DBP measured from the 12 plastisol calibration standards with increasing concentrations, (b) DESI mass spectrum of the 15%w DBP plastisol. | ||
In order to determine the distribution of the phthalate in the prepared plastisol discs, the plastisol disc containing 5%w of DEHP was subjected to laterally resolved DESI MS analysis. The resulting DESI MS images are shown in Fig. 2f for DINCH and Fig. 2g for DEHP. Both images show a homogenous distribution of the plasticizers in the plastisol disc. DEHP signal was also recorded in low intensity from the sample holder in the upper part of the image. This signal became artificially elevated through the normalization to a low TIC in this area.
A reasonably good fit of a linear regression curve was obtained (R2 = 0.976), when plotting the protonated phthalate ion intensity against the phthalate content (Fig. 2a). The fit of the regression curve was improved (R2 = 0.9964) by plotting the sum of protonated phthalate ion, sodium adduct ion and potassium adduct ion against the phthalate concentration (Fig. 2b). Normalization of the sum of phthalate ion intensities to the sum of the same ion intensities of the deuterated standard resulted in a worse fit (R2 = 0.9614, Fig. 2c), most likely because the standard was not incorporated into the plastisol discs, but added to the DESI solvent. Normalization of the sum of phthalate ion intensities to the total ion current (TIC) did not improve the quality of the regression curve fit (Fig. 2d), but greatly improved intra- and inter-day reproducibility (Fig. 2e).
For inter-day reproducibility, three calibration curves were measured on two consecutive days and another one was measured two days later using the same plastisol discs. Slopes of the regression curves obtained on the three days showed a standard deviation of 11% from the mean value. This demonstrates that the plastisol discs are reusable for the measurement of 7–10 calibration curves without considerable loss of intensity. Through automation it was possible to measure and analyze data for three replicate calibration curves in 10 min.
| Phthalate | R 2 | LOD (%w) | LOQ (%w) | Slope std. dev. (%) | Max. residue (%) |
|---|---|---|---|---|---|
| a Second highest residue level given in brackets. | |||||
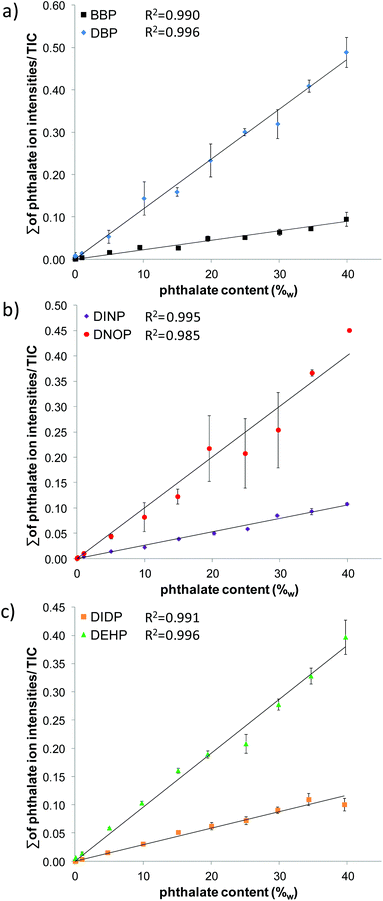
| DBP | 0.996 | 0.80 | 1.35 | 3.6 | 20 |
| DEHP | 0.996 | 0.62 | 0.86 | 4.7 | 47 (23)a |
| DNOP | 0.985 | 0.07 | 0.17 | 4.8 | 18 |
| DINP | 0.995 | 1.19 | 2.26 | 3.6 | 15 |
| BBP | 0.990 | 0.28 | 1.28 | 7.8 | 70 (44)a |
| DIDP | 0.991 | 0.01 | 0.02 | 5.6 | 29 (16)a |
A coefficient of determination >0.99 was achieved for all phthalates except for DNOP (0.985), indicating that the fit of the linear calibration curve is appropriate for quantification. Also the standard deviation of the slopes, determined from three replicate measurements of the calibration curves, in all cases was below 8% as suggested from “Guidelines for performance criteria and validation procedures of analytical methods used in controls of food contact materials”.21
Maximum residue levels, however, are above the recommended level21 of 15% (for values >LOQ) in all cases except for DINP. For DINP, DBP and DNOP, maximum residue levels are <25%. This is also true for DEHP and DIDP, if the concentration value closest to LOD is neglected. Only BBP shows high maximum residue levels at phthalate contents up to 15%w. A LOD below 0.1%w (the limit given by legislation) was determined for DNOP and DIDP. LODs for the other phthalates were found in the range between 0.28–1.19%w. A LOQ below 0.1%w (the limit given by legislation) was determined for DIDP. LOQs for the other phthalates ranged from 0.17–2.26%w. DINP featured the highest LOD and LOQ as regularly observed also from confirmatory methods. Taking into account that typically 5–40%w of phthalate are added to PVC to obtain the desired flexibility, LOQs of the DESI MS method seem to be appropriate for the intended task as a screening method.
Authentic samples
Performance of the DESI MS method was evaluated using eleven authentic samples provided by the state laboratories of Rhineland-Palatinate and Bavaria. Samples were analyzed in parallel with confirmatory methods such as GC-FID, GC-MS and HPLC-DAD. Results from confirmatory method and DESI MS are given in Table 2.| Authentic sample | Phthalate | Confirm. method (%w) | DESI MS method (%w) | Rel. dev. (%) |
|---|---|---|---|---|
| a Quantitation and identification via HPLC-DAD, sample from the Bavarian State Laboratory for Health and Food safety (Erlangen, Germany). b Quantitation via GC-FID, identification via GC-MS, sample from State Laboratory of Rhineland-Palatinate (Koblenz, Germany). | ||||
| False teeth | DBP | 16.4b | 22.5 ± 5.7 | +37 |
| Scoubidou strings | DBP | 22.3a | 19.8 ± 3.3 | −11 |
| Carnival mask | DBP | 21b | 18.2 ± 1.1 | −13 |
| Dolphin swimming aid | DEHP | 20a | 27.2 ± 1.9 | +36 |
| Pidgin swimming aid | DEHP | 24.7a | 28.6 ± 1.5 | +16 |
| Puppet | DEHP | 25.9a | 34.4 ± 2.9 | +33 |
| Swim ring | DEHP | 28b | 22.5 ± 1.2 | −20 |
| Stethoscope (toy) | DEHP | 31b | 33.9 ± 8.4 | +9 |
| Catering glove | DNOP | 6.2b | 5.5 ± 0.8 | −12 |
| Bat (toy) | DINP | 30.5a | 31.4 ± 14.0 | +3 |
| Beach ball | DINP | 31.5a | 25.6 ± 2.6 | −19 |
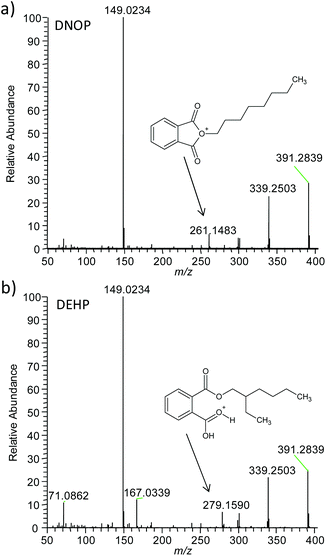
Four phthalates (DBP, DEHP, DNOP and DINP) were found in the authentic samples via the confirmatory methods with contents ranging from 6.2 to 31.5%w. The same phthalates were detected without sample preparation directly from the sample surface with DESI MS. Mass spectra recorded from authentic samples featured dominant phthalate signals with low background similar to the plastisols (Fig. 4). Higher abundances of the sodium and potassium adducts compared to the protonated ion, however, were observed for some authentic samples, which is most likely related to the natural salt abundance present at the production site. Phthalate identity was confirmed via accurate mass and MS/MS analysis. MS/MS information was used to differentiate between the structural isomers DNOP and DEHP (see Fig. 5). In the DESI MS/MS experiments DNOP and DEHP showed characteristic fragment ions at m/z = 261.148 for DNOP and at m/z = 279.159 for DEHP using either in-source collision induced dissociation (in-source CID, Fig. 5) or higher-energy collisional dissociation (HCD, data not shown) at a Thermo Exactive instrument. In ESI MS/MS experiments, however, using collision induced dissociation (CID) at a FT ion cyclotron resonance instrument (Thermo Fisher Scientific GmbH, Bremen, Germany) it was found that DEHP produced fragment ions at m/z = 261.148 and m/z = 275.159, while DNOP produced only fragment ions at m/z = 261.148. Therefore the ability of the method to differentiate stereoisomers in mixtures might be depend on the instrument, fragmentation method and fragmentation energy used.
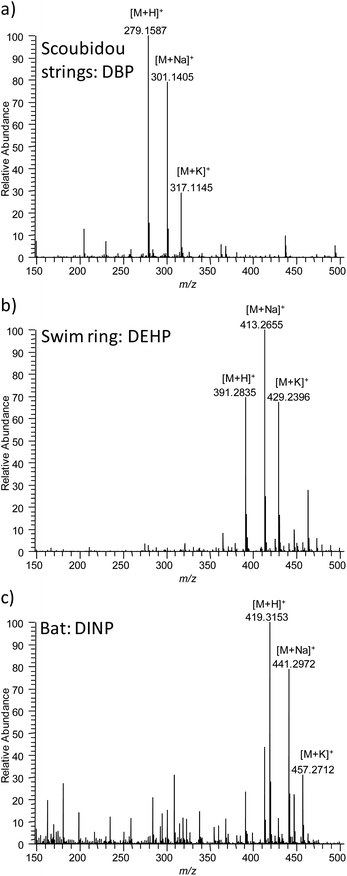 | ||
| Fig. 4 DESI mass spectra obtained from authentic samples. (a) DBP from Scoubidou strings, (b) DEHP from swim ring and (c) DINP from bat (toy). | ||
The mean relative measurement error of the DESI MS method for quantitation was ±14.6% as calculated from the absolute measurement error (range: 5.2–44.4%, values not listed in Table 2). Assuming that the confirmatory method is providing the true value, the relative deviation of phthalate content values determined with the DESI MS method were in the range of −20 to +10% as recommended by European research centre21 for seven samples. One sample was marginally out of range (+ 16%) and three samples showed a relative deviation of +33 to +37%. Overall, a good correlation was observed between DESI MS and confirmatory methods.
Given the great difference in sample preparation and analysis between the confirmatory methods and the DESI MS method, a certain deviation between the values was expected. The sampling area for DESI MS was about 5 × 5 mm. A larger piece is usually used for homogenization and extraction in confirmatory methods. Sampling in both cases is user-dependent, since the user defines which small proportion of the sample is subjected to analysis. Hence values can vary by analyzing different areas of the same sample. This is a likely scenario, if the sample is composed of several (differently colored) parts. Here we tried to sample the same area as used for the confirmatory analysis. Prints on top of the sample can be another explanation for observed differences between DESI MS and confirmatory methods. For DESI MS we analyzed the non-printed (original) parts of the sample, while for some confirmatory results the printed parts were included. Since DESI MS is a surface sensitive method, surface texture and overall hardness of the sample has an influence on the results. The extent of this influence has to be evaluated systematically in future studies and might provide an explanation for the observed differences.
Discussion
DESI MS allows for reliable identification of phthalates based on accurate mass and MS/MS analysis providing a very similar specificity as confirmatory methods. Mixtures of phthalates do not represent a problem. Mixtures of stereoisomers can be identified based on characteristic fragment ions and their ion ratios under optimized fragmentation conditions. Differentiation of stereoisomers in mixtures, however, could be further improved by the application of ion mobility mass spectrometry which allows for gas phase separation of isomeric compounds prior to MS analysis. DESI MS can provide quantitative results which are close to results from confirmatory methods, but the DESI MS method, as presented here, features inferior accuracy and LOQ. Accuracy and LOQ might be improved by further automation and optimization of measurement parameters and sampling. DESI MS provides much faster identification and quantification than confirmatory methods, since calibration curves can be obtained in three minutes, no sample preparation is necessary and sample analysis is performed in less than a minute.Compared to DART MS, DESI MS features similar quality of identification and measurement speed. LOD values obtained for DART MS are lower than LOD values reported for DESI MS here, but both methods suffer from the phthalate background of the lab and atmosphere. Calibration curves from standards indicate that DART MS should be useable for quantification, but quantification of phthalates in authentic samples has not been demonstrated yet. Both ionization methods are typically lab-based, but have been shown to also work in the field with portable mass spectrometers.22,23 Both methods are working under non-destructive conditions; DART MS however might result in melting of the sample, if operated at high temperatures.
Compared to ATR-IR, the most accepted screening method, DESI MS provides a more reliable identification at a similar measurement speed. ATR-IR usually determines the total phthalate content. Although each phthalate features a distinct profile, polymer background interferences hamper a correct identification, and ATR-IR spectra of mixtures are difficult to interpret. LOQ of 0.1%w can be achieved for authentic samples, depending on the ATR-IR instrument used and portable instruments are commercially available. While DESI MS has the potential to develop into a rapid confirmatory method or a field screening method, the limitation of ATR-IR to be unable to analyze compound mixtures, complicates its application as a confirmatory method.
Conclusions
In this study a DESI MS method for rapid identification and quantification of phthalates in consumer goods was developed. Reliable identification of phthalates was based on accurate mass measurements and MS/MS analysis. Calibration curves were obtained from matrix-matched reference materials with coefficients of determination >0.985. Measurements of calibration curves (12 points) were achieved in three minutes. Sample preparation for authentic samples involved simply the attachment of a small piece to a sample holder and analysis took less than a minute. Eleven authentic samples were directly analyzed with DESI MS, and results were found to be in good agreement with results from confirmatory methods for the majority of samples (7 out of 11). DESI MS combines the simplicity of ambient ionization with the high performance of mass spectrometry in terms of reliable identification and quantification. Hence, DESI MS has the potential to develop into a field screening method for phthalates via miniaturization of the instrumental setup or to become an accurate confirmatory method by standardization of measurement protocols and implementation of ion mobility for the separation of stereo isomers.Acknowledgements
The author would like to thank Combi GmbH and Vinnolit GmbH & Co. KG for providing Hexamoll DINCH standard and Polyvinyl chloride powder Vinnolit P 70. Financial support by the State of Hesse (LOEWE Research Focus ‘Ambiprobe’) and by the Justus Liebig University (research grant for junior academic staff) is gratefully acknowledged.Notes and references
- TransparencyMarketResearch, http://www.transparencymarketresearch.com/phthalic-anhydride.html, 2013.
- S. H. Swan, Environ. Res., 2008, 108, 177–184 CrossRef CAS PubMed.
- J. M. Braun, S. Sathyanarayana and R. Hauser, Curr. Opin. Pediatr., 2013, 25, 247–254 CrossRef CAS PubMed.
- R. U. Halden, Ann. Rev. Public Health, 2010, 31, 179–194 CrossRef PubMed.
- U. Heudorf, V. Mersch-Sundermann and J. Angerer, Int. J. Hyg. Environ. Health, 2007, 210, 623–634 CrossRef CAS PubMed.
- H. M. Koch, H. Drexler and J. Angerer, Int. J. Hyg. Environ. Health, 2004, 207, 15–22 CrossRef CAS PubMed.
- E. Commission, 2012 Annual Report on the operation of the Rapid Alert System for non-food dangerous products - RAPEX, 2013.
- X.-L. Cao, Compr. Rev. Food Sci. Food Saf., 2010, 9, 21–43 CrossRef CAS PubMed.
- A. O. Earls, I. P. Axford and J. H. Braybrook, J. Chromatogr. A, 2003, 983, 237–246 CrossRef CAS.
- J. H. Petersen and L. K. Jensen, Food Addit. Contam., 2010, 27, 1608–1616 CrossRef CAS PubMed.
- F. Higgins, Rapid and reliable phthalate screening in plastics by portable FTIR spectroscopy, Agilent Technologies, USA, 2013, pp. 1–8 Search PubMed.
- S. Lowry, Spectroscopy, 2011, 24–25 Search PubMed.
- K. Akos, N. Lajos, Z. Miklos and K. Sandor, Int. J. Mass Spectrom., 2011, 303, 225–228 CrossRef PubMed.
- T. Rothenbacher and W. Schwack, Rapid Commun. Mass Spectrom., 2010, 24, 21–29 CrossRef CAS PubMed.
- T. Rothenbacher and W. Schwack, Rapid Commun. Mass Spectrom., 2009, 23, 2829–2835 CrossRef CAS PubMed.
- S. Krieger and O. J. Schmitz, Rapid Commun. Mass Spectrom., 2014, 28, 1862–1870 CrossRef CAS PubMed.
- M. C. Jecklin, G. Gamez and R. Zenobi, Analyst, 2009, 134, 1629–1636 RSC.
- Z. Takats, J. M. Wiseman, B. Gologan and R. G. Cooks, Science, 2004, 306, 471–473 CrossRef CAS PubMed.
- T. Schramm, A. Hester, I. Klinkert, J. P. Both, R. M. A. Heeren, A. Brunelle, O. Laprevote, N. Desbenoit, M. F. Robbe, M. Stoeckli, B. Spengler and A. Rompp, J. Proteomics, 2012, 75, 5106–5110 CrossRef CAS PubMed.
- C. Paschke, A. Leisner, A. Hester, K. Maass, S. Guenther, W. Bouschen and B. Spengler, J. Am. Soc. Mass Spectrom., 2013, 24, 1296–1306 CrossRef CAS PubMed.
- S. Bratinova, B. Raffael and C. Simoneau, Publ. Off. Eur. Union, 2009, 1–74, DOI:10.2788/49046.
- L. Gao, A. Sugiarto, J. D. Harper, R. G. Cooks and Z. Ouyang, Anal. Chem., 2008, 80, 7198–7205 CrossRef CAS PubMed.
- J. Wells, M. Roth, A. Keil, J. Grossenbacher, D. Justes, G. Patterson and D. Barket, J. Am. Soc. Mass Spectrom., 2008, 19, 1419–1424 CrossRef CAS PubMed.
| This journal is © The Royal Society of Chemistry 2015 |

