
 Open Access Article
 This Open Access Article is licensed under a
 Creative Commons Attribution 3.0 Unported Licence
Quantifying BTEX in aqueous solutions with potentially interfering hydrocarbons using a partially selective sensor array†
J. S.
Cooper
*a,
H.
Kiiveri
b,
L. J.
Hubble
a,
E.
Chow
a,
M. S.
Webster
a,
K.-H.
Müller
a,
A.
Sosa-Pintos
a,
A.
Bendavid
a,
B.
Raguse
a and
L.
Wieczorek
a
aCSIRO Manufacturing Flagship, PO Box 218, Lindfield, NSW 2070, Australia. E-mail: james.cooper@csiro.au; Tel: +61 2 9413 7143
bCSIRO Computational Informatics, 65 Brockway Road, Floreat WA 6014, Australia
First published on 9th March 2015
Abstract
Partially selective gold nanoparticle sensors have the sensitivity and selectivity to discriminate and quantify benzene, toluene, ethylbenzene, p-xylene and naphthalene (BTEXN) at concentrations relevant to the US Environmental Protection Agency. In this paper we demonstrate that gold nanoparticle chemiresistors can do so in the presence of 16 other hydrocarbons and that they did not reduce the discriminating power of the array. A two-level full factorial designed experiment was performed on unary, binary, ternary, quaternary, quinary combinations of BTEXN analytes with and without the possibly interfering hydrocarbons. The nominal component concentration of the mixtures was 100 μg L−1, equivalent to approximately 100 parts per billion (ppb). Concentrations predicted with the random forests method had an average root mean square error of 10–20% of the component concentrations. This level of accuracy was achieved regardless of whether or not the 16 possibly interfering hydrocarbons were present. This work shows that the sensitivity and selectivity of gold nanoparticles chemiresistor sensors towards BTEXN analytes are not unduly affected by the other hydrocarbons that are expected to be present at a petroleum remediation site.
Introduction
As of September 2013 there were 577![[thin space (1/6-em)]](https://www.rsc.org/images/entities/char_2009.gif) 981 active underground Storage Tanks (UST's) in the US that are regulated by the US Environmental Protection Agency (EPA) and are required to have an active leak detection system.1 Groundwater monitoring is one way to detect whether an UST is leaking. Groundwater monitoring involves taking water samples from wells located near the site of interest and testing those samples for possible pollutants. The process is labor intensive, slow and expensive. A better alternative would be to have automated sensor systems located in the wells that periodically check the water quality.
981 active underground Storage Tanks (UST's) in the US that are regulated by the US Environmental Protection Agency (EPA) and are required to have an active leak detection system.1 Groundwater monitoring is one way to detect whether an UST is leaking. Groundwater monitoring involves taking water samples from wells located near the site of interest and testing those samples for possible pollutants. The process is labor intensive, slow and expensive. A better alternative would be to have automated sensor systems located in the wells that periodically check the water quality.
Partially selective sensor arrays may become an attractive alternative to monitor groundwater. There are several partially selective sensing platforms that have been used to directly detect petroleum products in soil and water: fluorescent DNA-based chemosensors,2 bacterial bioreporting assay sensors,3 luminescence monitoring of interpenetrating metal organic frameworks (MOF),4 preconcentration and chemicapacitive polymer detectors,5 polymer coated thickness shear-mode resonators,6,7 polymer coated surface acoustic wave (SAW) sensors,8,9 siloxane clad optical fibre sensors,10 polymer chemiresistors,11 and graphene, carbon nanotube or gold nanoparticle chemiresistors.12,13 These partially selective sensors must be deployed in arrays to discriminate and quantify the chemicals that they detect. There are many criteria that the sensors would have to meet to be suitable for groundwater monitoring; predominantly they must be sensitive and selective enough to detect the analytes of interest at relevant concentrations and discriminate those analytes of interest from each other and from any other possibly interfering compounds that may be present.14
There are potentially hundreds of hydrocarbon compounds that can simultaneously dissolve into water from a gasoline or diesel source.15 One study found that although gasoline could contain more than 12000 compounds, the majority was made up of just 42 contributors that accounted for 74.2% of the total volume.15 Amongst the many possible compounds that can be present in gasoline, the concentration present when dissolved into water will depend upon their solubility. A sensor that is sensitive to recognised pollutant compounds (e.g. benzene, toluene, ethylbenzene, xylenes (BTEX)) may also be sensitive to any of these other compounds too. Ensuring that a sensor can identify and quantify BTEX in the presence of these other compounds is critical if it is to be deployed as a groundwater monitoring device.
As hydrocarbons are reversibly absorbed by gold nanoparticle chemiresistors they change electrical resistivity of the sensors.16 The thiol compounds that coat the nanoparticles in protective self assembled monolayers define the concentration that an external species will partition into the gold nanoparticle chemiresistor and thus the sensitivity and specificity of the sensor to different analytes.17 We have previously shown that gold nanoparticle chemiresistor sensors can quantify mixtures of BTEX at concentrations of 1000 μg L−1 (ref. 18) and at 100 μg L−1,19 demonstrating that mixtures of at least five chemically similar compounds could be discriminated and quantified with a partially selective sensor array. We now present the improvements to the sensitivity and selectivity of the sensor arrays such that they can discriminate and quantify the five compounds at the concentration of 100 μg L−1 and in the presence of 16 other hydrocarbons. This work is a proof of concept that the gold nanoparticle chemiresistor sensor array can function in the presence of interfering compounds and a progression towards testing with real groundwater samples.
Experimental
All chemicals were at least reagent grade, and were used as received from Sigma Aldrich. Solutions were prepared using a Milli-Q A-10 Advantage deionised water system with a VOC-Pak filter on the outlet (>18.0 MΩ cm and, <4 ppb trace organics Millipore, Australia). A synthetic “BTEX Free” gasoline mixture was prepared from the 16 other components; five straight chain aliphatic alkanes: n-pentane, n-hexane, n-heptane, cyclohexane, and n-octane; five branched aliphatic alkanes: isopentane, 2-methylpentane, 3-methylpentane, isooctane, methylcyclopentane; five aromatics: 1,2,4-trimethyl-benzene, 1-methyl-3-ethylbenzene, 1,3,5-trimethylbenzene, 1-methyl-4-ethylbenzene, 1,2,3-trimethylbenzene; and one alkene: hexene. A table showing the volume percent of each of the component compounds that made up the gasoline mixture is presented in the ESI.† The constituent components of the synthetic gasoline mixture were partitioned into water by the slow stirring method.20 Briefly a sealed 250 mL bottle containing 200 mL of water and 10 mL of the synthetic gasoline mixture was stirred gently for 24 hours. This allowed for the hydrocarbons to partition into the water and reach equilibrium as defined by their solubility. The water was then decanted and stored at 4 °C in 40 mL amber vials until it was needed as a component in a test sample. Multiple samples of the water soluble fraction were measured by the National Measurement Institute – Organics Laboratory, Sydney Aus. to quantify the hydrocarbons that were present.A typical sensor consisted of a gold microelectrode (30 interdigitated ring-like fingers, 900 μm diameter of the outside fingers, 5 μm wide, with a 5 μm gap). On the microelectrode a 1% (w/v) aqueous solution of gold nanoparticles stabilized with 4-(dimethylamino)pyridine and N-methyl-2-pyrrolidone was printed and then dried to leave a circular film.21 The film of nanoparticles was functionalized16 by incubation in an acetonitrile solution with 10 mM of a thiol for 1 hour. During incubation the thiol replaces the weakly bonded 4-(dimethylamino)pyridine from the surface of the gold nanoparticles. The array of printed gold nanoparticle films were functionalized with a variety of thiols: 1-hexanethiol (HEXT), 1,10-decanedithiol (1-10-DDT), 1,2-benzenedimethylthiol (1-2-BDMT), 2,4-dichlorobenzenethiol (2-4-DCBT), 2-amino-thiophenol (2-ATP), 4-bromobenzylmercaptan (4-BBM), 4-nitrobenzylmercaptan (4-NBM), 1,6-hexanedithiol (HDT), 1-heptanethiol (1-HEPTT), 4-nitrophenyl disulphide (4-NPDS), 4-chlorobenzenethiol (4-CBT), 2-(trimethylsilyl)ethanethiol (2-TMSET), 4-methylbenzenethiol (4-MBT), 3-ethoxythiophenol (3-ETP), and 4-methoxybenzylmercaptan (MOB). Following the incubation, the gold nanoparticle films were rinsed with acetonitrile and water and the baseline resistance measured to confirm the organic layer coating the nanoparticles had changed.
To assess whether the compounds would interfere with the sensor array's accuracy at predicting the concentrations of benzene (B), toluene (T), ethylbenzene (E) p-xylene (X), and naphthalene (N), a full factorial design of experiment (DOE) was performed. The design was similar to earlier work18 except a sixth component was introduced: the water soluble fraction of the synthetic gasoline referred to as Interferent (I). The full factorial DOE covers the entire mixture space with every possible combination of BTEXNI. There were 64 different combinations, consisting of one blank (O), six unary mixtures (B, T, E, X, N, and I), 15 binary mixtures (BE, BN, BT, BX, BI, EN, EX, EI, TE, TN, TX, TI, XN, XI, NI), 20 ternary combinations (BEI, TXN, XNI, BTE, etc.), 15 quaternary combinations (BENI, TEXI, EXNI, BXNI, etc.), 6 quinary combinations (BEXNI, BTENI, BTEXI, BTEXN, BTXNI, TEXNI) and one senary (six components) combination (BTEXNI). The nominal concentration of the B, T, E, X, and N components in all of these mixtures was 100 μg L−1 (approximately 100 parts per billion (ppb)). The total recoverable hydrocarbon concentration of the interferents solution in the mixtures was 180 μg L−1. Further information regarding the composition of the interferent solution is presented in the next section. Two additional mixtures were prepared with the same components as BTEXN and BTEXNI but at half concentrations (nominally 50 μg L−1 for B, T, E, X and N, and 90 μg L−1 for I), which were referred to as MID and MIDI respectively.
The mixtures were prepared and exposed to the sensor as described previously.18 The 32 samples that did not contain any interferents were exposed to the sensor in random order. Following that, the 32 samples that also contained interferents were then exposed to the sensor array in the same order. Each exposure lasted for 120 s and was then followed by 180 s where the array was flushed with analyte free water, the typical responses of a sensor are shown in Fig. 1. The baseline corrected maximum relative resistance change was calculated from the response curves and used in the quantification analysis. The statistical method random forests was used to predict the concentration of BTEXN in the samples based upon the sensor response patterns.18 It was run in R using tree = 3000 trees and with the number of variables (sensors) randomly sampled as candidates at each split set to the default value of 5. The sensor responses and the predictions from the random forests analysis are available in the ESI.†
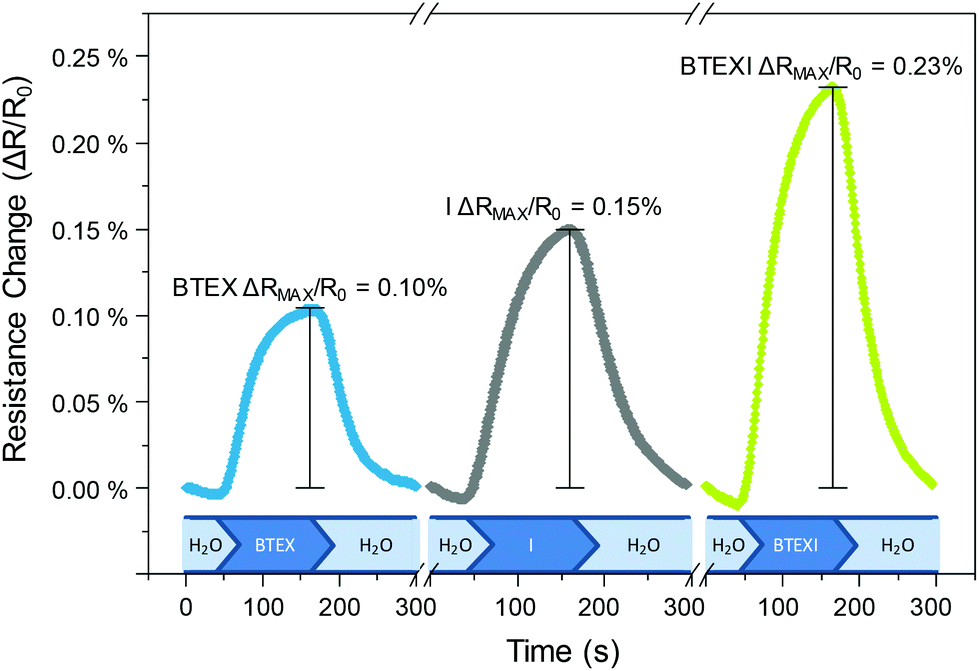 | ||
| Fig. 1 Example of how a sensor's resistance changes with time when exposed to analytes where each line is the ensemble average of 12 different exposures. This sensor was functionalized with 3-ETP and the mixtures were BTEX, I, and BTEXI. The indicated maximum relative resistance changes (ΔRMAX/R0) were used for data analysis (0.1% for BTEX, 0.15% for I and 0.23% for BTEXI). | ||
Results and discussion
Gasoline or diesel could not be used to provide the interfering compounds because the local sources were found to contain BTEX. Instead, a synthetic “BTEX Free” gasoline mixture was prepared. This synthetic gasoline mixture contained 16 components (other than BTEX) that have been found in the groundwater at a remediation site. The independently measured total recoverable hydrocarbon (TRH) including C5 to C10 of the water soluble fraction of the synthetic gasoline samples was 18000 μg L−1. The most soluble components were present in the water at the highest concentrations; 25% and 32% of the total hydrocarbons were 1,3,5-trimethylbenzene (4600 μg L−1) and 1,2,4-trimethylbenzene (5900 μg L−1) respectively. Traces of BTEX were also present but at concentrations less than 0.1%; 2 μg L−1, 4.8 μg L−1, 6.2 μg L−1, and 12 μg L−1 for benzene, toluene, ethylbenzene, and m,p-xylene respectively. If naphthalene and o-xylene were present their concentrations were lower than the instrument's reportable value of 1 μg L−1. The most likely source for these trace levels of BTEX was from contaminations in the original hydrocarbon stocks. The water soluble fraction was diluted by 1:100 before it was used in experiments which would have reduced the TRH concentration to 180 μg L−1 and reduced the BTEX concentration below the detection limit of the sensor array. An example of the GC-MS spectra for the water soluble fraction of the synthetic gasoline is presented in the ESI† Fig. S-1.
The electrical resistance of the sensors increased when they were exposed to a water sample that contained any hydrocarbons. This resistance increase would plateau at a maximum as depicted in Fig. 1. The maximum resistance change divided by the baseline resistance ((RMAX − R0)/R0) as illustrated in Fig. 1 was defined as the sensor's response to an analyte and used in all of the following analyses. The sensor responses to the interferent solution varied depending upon the presence of other hydrocarbons. Generally, when BTEX or N were present with the interferent solution the sensors would give a lower than expected response. This can be seen in Fig. 1 where the 3-ETP functionalised sensor's response to the BTEX mixture was 0.10% and the response to the Interferent solution was 0.15%. Ideally the sensors would behave additively e.g. for the 3-ETP sensor the response to the BTEXI mixture would be 0.10% + 0.15% = 0.25%. However, the response to the BTEXI mixture was 0.23%, which is less than the ideal additive response. Responses that were less than ideal were observed for all of the sensors, regardless of their functionalisation. This implies that the presence of the interferents solution would reduce sensor sensitivity to BTEX.
Each analyte generated a different response pattern from the sensor array as can be observed in Fig. 2. Generally benzene and toluene generated small responses and naphthalene and the interferents solution generated strong responses. The response patterns of Ethylbenzene and p-xylene were similar in shape and magnitude. The pattern of response defines the selectivity of the sensor array and whether the responses can be used to identify and quantify the analytes. A linear discriminant analysis of the response patterns (normalized to unit length) is shown in Fig. 3. It shows that the array response patterns were different from each other. The strong selectivity from the sensors is further evidenced by there being no misclassifications in the confusion matrix of the discriminant analysis. This shows that the individual analytes could be identified by the sensor system, the next challenge was to quantify the components in mixtures.
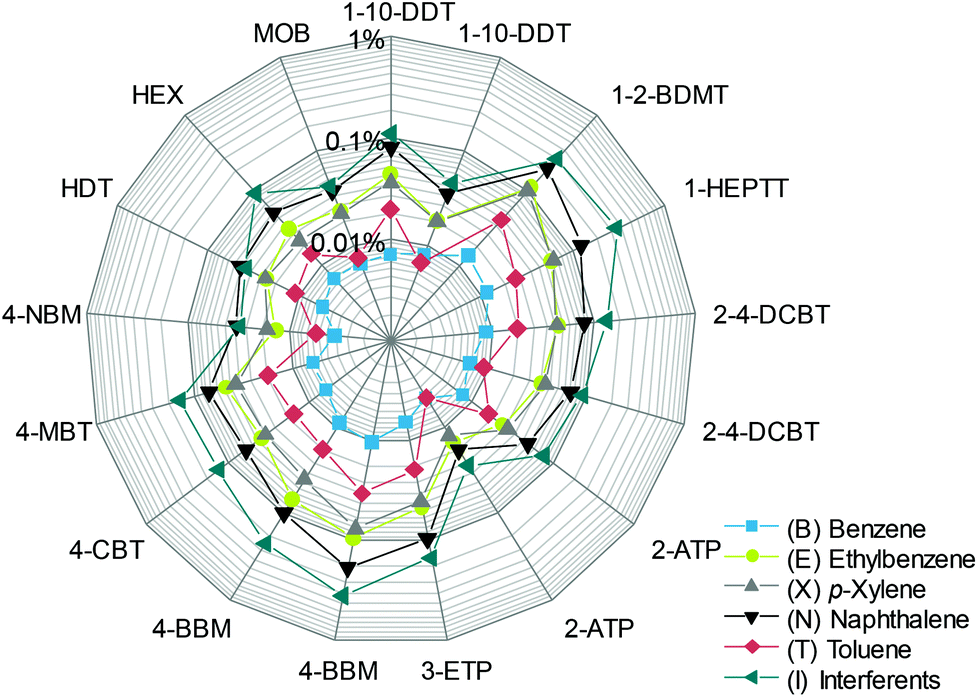 | ||
| Fig. 2 Response pattern of the 17 sensors to 84 μg L−1 benzene, 110 μg L−1 toluene, 67 μg L−1 ethylbenzene, 94 μg L−1p-xylene, 140 μg L−1 naphthalene and 180 μg L−1 (TRH) interferents solution. Concentrations were measured independently by GC-MS. Axis of the polar graph is the sensor response (maximum resistance change ΔRMAX/R0 as shown in Fig. 1). | ||
 | ||
| Fig. 3 Linear discriminant analysis of response patterns that are shown in Fig. 2. Ellipses are from the 90% confidence interval and centroids of the groups are indicated with stars. | ||
The sensor array responses were used with the random forests statistical method to predict the analyte concentrations in the various mixtures. This was done with the data set that did not include any interferents as well as the complete data set. An example of the output, the predicted concentration of benzene in mixtures that did not contain interferents is shown in Fig. 4a and the predicted concentration of benzene in mixtures that did contain interferents is shown in Fig. 4b. As can be seen in the Figure more than 80% of the predictions are within 20 μg L−1 of the true concentration. The average root mean square error for all of the predictions without the potentially interfering hydrocarbons was 17.3 μg L−1 and the same error for the prediction of benzene in mixtures that also contained the potentially interfering hydrocarbons was 17.7 μg L−1. This demonstrates that there was very little difference in the average prediction accuracy of the gold nanoparticle chemiresistor arrays, whether or not the interferents were present.
 | ||
| Fig. 4 Concentration of benzene independently measured by GC-MS (black line) and predicted from the sensor array responses (blue diamonds) for mixtures that (a) did not contain any additional potentially interfering compounds and (b) with potentially interfering compounds. The mixtures were tested randomly but have been arranged on the x-axis by increasing complexity; from the blank and single components to the five component mixtures MID and BTEXN. | ||
As seen previously there was no correlation between the mixture complexity (i.e. the number of components in the mixture) and the accuracy of the predictions made with the random forests method.18 The average root mean square error of the predictions remains a fairly unbiased indicator of the method's accuracy at making predictions. Fig. 5 shows the root mean squared error for the sensor array to predict the concentration of analytes in the presence and absence of compounds that may possibly interfere with the sensor. The accuracy of the predictions generally coincides with the sensitivity and selectivity that the sensors display for the same analyte. Benzene generally elicits weaker responses from the sensor array than naphthalene and as a result there were greater errors in the benzene predictions than in the Naphthalene predictions. The root mean square errors of 10–20 μg L−1 for mixtures that had nominal component concentrations of 100 μg L−1 gives relative root mean square errors of approximately 10–20%. This was consistent with work that was done without interferents at the higher concentration of 1000 μg L−1.18 From the perspective of the requirements for a groundwater device there is no practical difference in the accuracy of the predictions in the presence or absence of the interfering hydrocarbons. That is, considering the EPA safe drinking limits for toluene, xylenes, and ethylbenzene is 1000, 10000, and 700 μg L−1 and the device can measure concentrations of 100 μg L−1 with an accuracy of ±20 μg L−1, this gives a sufficiently large buffer, such that the device would be highly unlikely to misclassify a potentially unsafe sample.
 | ||
| Fig. 5 Root mean square error of the predicted concentration of the analytes of interest in mixtures with and without potentially interfering hydrocarbons, lines provided as a guide to the eye only. | ||
Another way to examine the output from the sensor array is to use the predictions as a binary classifier as to whether the analyte of interest is present. In this way the data can be plotted in receiver operator curves (ROC) that can demonstrate the tradeoffs between sensitivity and specificity for the sensor arrays. The ROC for benzene without any possibly interfering hydrocarbons and also with interfering hydrocarbons is shown in Fig. 6. The area under the curve for the samples without interferents was 0.97 and the area under the curve for the samples with interferents was 0.95. This shows that although there was a slight loss of accuracy for the predictions that contained potentially interfering hydrocarbons there is very little practical difference between the two scenarios. The ROC curves for the other analytes (toluene, ethylbenzene, p-xylene, naphthalene) which showed even better specificity and selectivity than benzene can be viewed in the ESI.†
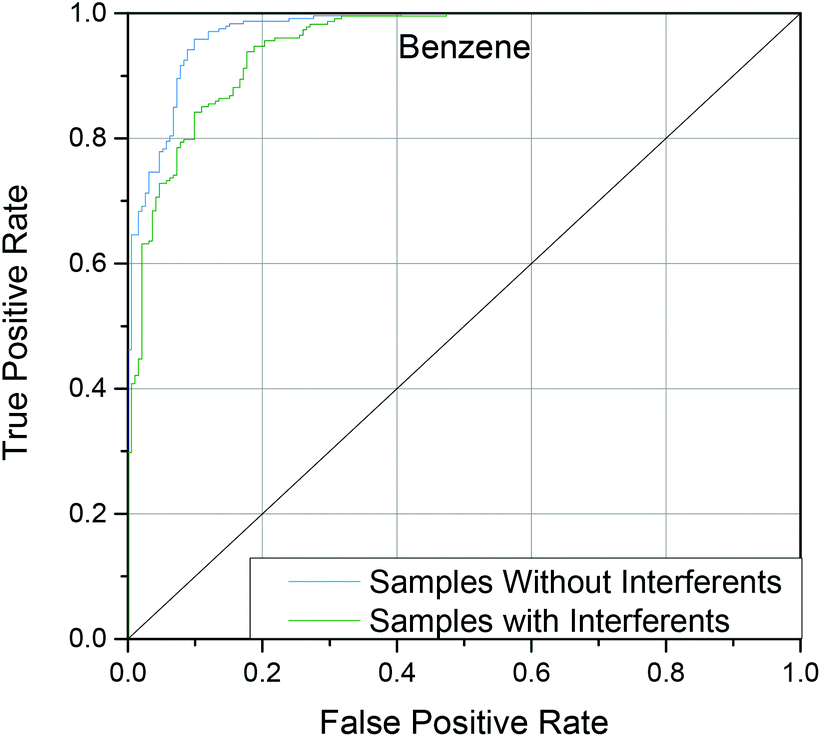 | ||
| Fig. 6 Receiver operator curves for benzene measurements with and without possibly interfering hydrocarbons with False Positive Rate (FPR) vs. True Positive Rate (TPR). The area under the curve (AUC) for the measurements without the interferents was 0.97 and the AUC for the measurements of samples that contained interferents was 0.95. | ||
Partially selective sensor arrays have started to show limits of detection at the 100 μg L−1 level,5,19 but work has only been relatively clean systems that are free of possibly interfering compounds until now. Applebee et al.6 used thickness shear mode resonator sensors to examine petroleum hydrocarbons in water with a variety of possibly interfering compounds. They were measuring the total concentration and the sensors performed exceptionally well with fresh samples but lost accuracy with weathered samples that did not match their calibration sets. Pejcic et al. have shown good discrimination of benzene, toluene, ethylbenzene, xylene and naphthalene in water with four polymer coated quartz crystal microbalances22 and improved limits of detection, between 400 and 4000 μg L−1 by altering the plasticizers.7 They have also used MOF's to probe mixtures, but in neat solutions.4 A biologically based sensor array that used fluorescent Escherichia coli discriminated between BTEX and other pollutants at concentrations of 44000–220000 μg L−1.3 Josse et al. used three shear horizontal surface acoustic wave sensors with thin polymer coatings to quantify benzene in the presence of other hydrocarbons.8 They have promising detection limits, 320 μg L−1 for benzene, and their estimates of benzene concentration were within ±500 μg L−1 in binary mixtures that contained 1000–5000 μg L−1 benzene and toluene or benzene and ethylbenzene.8 Experimentally this was most similar to our previous work where we predicted the concentration of benzene within ±200 μg L−1 for binary, ternary, quaternary and quinary combinations of benzene, toluene, ethylbenzene, xylene and naphthalene each present at the 1000 μg L−1 level.18 This work which quantified up to five component mixtures at 100 μg L−1 in the presence of possibly interfering hydrocarbons demonstrates the potential of partially selective sensor arrays operating in complex and challenging media.
Conclusions
Partially selective, gold nanoparticle chemiresistor sensor arrays are poised to leave the laboratory and probe groundwater at remedial sites. These locations will contain an unlimited variety of compounds, any of which could potentially interfere with the sensors. In this work we have shown that the sensors will respond to the other hydrocarbons that are likely to be present at a gasoline spill, but those compounds did not diminish the sensor array's accuracy at quantifying benzene, toluene, ethylbenzene, p-xylene, or naphthalene. This is a promising step towards deploying the sensor array in the field where a broader range of interfering compounds will be present.Funding sources
This work was partly funded by Chevron Energy Technology Pty Ltd. through the West Australian Energy Research Alliance (WAERA), Project Number AES 09 P3SR-053.Acknowledgements
The authors are grateful to R. Chai for fabricating electrodes, J. Myers for synthesizing gold nanoparticles, and M. Roberts for building the electrical testing instrumentation.References
- EPA, Semiannual Report Of UST Performance Measures - End Of Fiscal Year 2013 (October 1, 2012 – September 30, 2013), US EPA, Washington, DC, 2013.
- W. Jiang, S. L. Wang, L. H. Yuen, H. K. Kwon, T. Ono and E. T. Kool, Chem. Sci., 2013, 4, 3184–3190 RSC.
- T. Elad and S. Belkin, Water Res., 2013, 47, 3782–3790 CrossRef CAS PubMed.
- M. Myers, A. Podolska, C. Heath, M. V. Baker and B. Pejcic, Anal. Chim. Acta, 2014, 819, 78–81 CrossRef CAS PubMed.
- S. T. Hobson, S. Cemalovic and S. V. Patel, Analyst, 2012, 137, 1284–1289 RSC.
- M. S. Applebee, J. D. Geissler, A. P. Schellinger, R. J. Jaeger and D. T. Pierce, Environ. Sci. Technol., 2004, 38, 234–239 CrossRef CAS.
- B. Pejcic, E. Crooke, L. Boyd, C. M. Doherty, A. J. Hill, M. Myers and C. White, Anal. Chem., 2012, 84, 8564–8570 CrossRef CAS PubMed.
- F. Bender, R. E. Mohler, A. J. Ricco and F. Josse, Anal. Chem., 2014, 86, 1794–1799 CrossRef CAS PubMed.
- C. K. Ho, E. R. Lindgren, K. S. Rawlinson, L. K. McGrath and J. L. Wright, Sensors, 2003, 3, 236–247 CrossRef CAS PubMed.
- L. I. B. Silva, A. V. Panteleitchouk, A. C. Freitas, T. A. P. Rocha-Santos and A. C. Duarte, Anal. Methods, 2009, 1, 100–107 RSC.
- C. K. Ho and R. C. Hughes, Sensors, 2002, 2, 23–34 CrossRef CAS PubMed.
- J. S. Cooper, B. Raguse, E. Chow, L. Hubble, K.-H. Müller and L. Wieczorek, Anal. Chem., 2010, 82, 3788–3795 CrossRef CAS PubMed.
- J. Cooper, M. Myers, E. Chow, L. Hubble, J. Cairney, B. Pejcic, K.-H. Müller, L. Wieczorek and B. Raguse, J. Nanopart. Res., 2014, 16, 1–13 CrossRef.
- B. Pejcic, P. Eadington and A. Ross, Environ. Sci. Technol., 2007, 41, 6333–6342 CrossRef CAS.
- W. G. Domask, in Advances in modem environmental toxicology. Vol. VII: Renal effects of petroleum hydrocarbons, ed. M. A. Mehlman, G. P. Hemstreet, J. J. Thorpe and N. K. Weaver, Princeton Scientific Publishers, Inc., Princeton, NJ, 1984, pp. 1–23 Search PubMed.
- B. Raguse, E. Chow, C. S. Barton and L. Wieczorek, Anal. Chem., 2007, 79, 7333–7339 CrossRef CAS PubMed.
- E. Chow, K.-H. Müller, E. Davies, B. Raguse, L. Wieczorek, J. S. Cooper and L. J. Hubble, J. Phys. Chem. C, 2010, 114, 17529–17534 CAS.
- J. S. Cooper, H. Kiiveri, E. Chow, L. J. Hubble, M. S. Webster, K.-H. Müller, B. Raguse and L. Wieczorek, Sens. Actuators, B, 2014, 202, 279–285 CrossRef CAS PubMed.
- L. J. Hubble, J. S. Cooper, A. Sosa-Pintos, H. Kiiveri, E. Chow, M. S. Webster, L. Wieczorek and B. Raguse, ACS Comb. Sci., 2015, 17, 120–129 CrossRef CAS PubMed.
- D. A. Lang, T. P. Bastow, B. G. K. Van Aarssen, B. Warton, G. B. Davis and C. D. Johnston, GroundWater Monit. Rem., 2009, 29, 85–93 CrossRef CAS PubMed.
- E. Chow, J. Herrmann, C. S. Barton, B. Raguse and L. Wieczorek, Anal. Chim. Acta, 2009, 632, 135–142 CrossRef CAS PubMed.
- C. White, B. Pejcic, M. Myers and X. B. Qi, Sens. Actuators, B, 2014, 193, 70–77 CrossRef CAS PubMed.
Footnote |
| † Electronic supplementary information (ESI) available. See DOI: 10.1039/c5an00223k |
| This journal is © The Royal Society of Chemistry 2015 |