 Open Access Article
Creative Commons Attribution 3.0 Unported Licence
Non-derivatized glycan analysis by reverse phase liquid chromatography and ion mobility-mass spectrometry†
Nichole M.
Lareau
,
Jody C.
May
and
John A.
McLean
*
Department of Chemistry, Center for Innovative Technology, Institute of Chemical Biology, and Institute for Integrative Biosystems Research and Education, Vanderbilt University, 7330 Stevenson Center, Nashville, TN 37235, USA. E-mail: john.a.mclean@vanderbilt.edu; Fax: +1 615-343-1234; Tel: +1 615-322-1195
First published on 23rd February 2015
Abstract
A simple method for the analysis of non-derivatized glycans using a reverse phase column on a liquid chromatography-ion mobility-mass spectrometry (LC-IM-MS) instrument. The methodology supports both glycomic and proteomic work flows without the necessity of switching columns.
Structural analysis of N-linked glycan and glycan conjugates is challenging due to the high level of heterogeneity of glycan isomers and the corresponding difficulty of separation.1 The study of non-derivatized (native) glycans poses additional challenges due to their low abundance and the inherent preference of sodium-coordinated glycans in endogenous biological matrices containing salts which partitions analyte signal into multiple ion channels and contributes to interfering chemical noise. Liquid chromatography (LC) and mass spectrometry (MS) techniques are frequently used for rapid characterization of carbohydrate samples, but commonly require extensive sample preparation and purification as well as multi-stage fragmentation analysis (tandem MS) in order to gleam structural information.1,2
Ion mobility-mass spectrometry (IM-MS) addresses several analytical challenges related to the complex heterogeneity of glycans through rapid gas-phase separations based on structurally selective IM, which is complementary to MS.3,4 The IM-MS separation improves analytical sensitivity by partitioning signals of interest from endogenous or exogenous chemical noise. Furthermore, structural information can be derived from mobility measurements that are specific to isomeric species. The methodologies described in this report have been developed for the analysis of native or non-derivatized glycans using LC-IM-MS. With minimal sample preparation and no prior purification necessary, this robust methodology can be applied to various complex glycan samples.
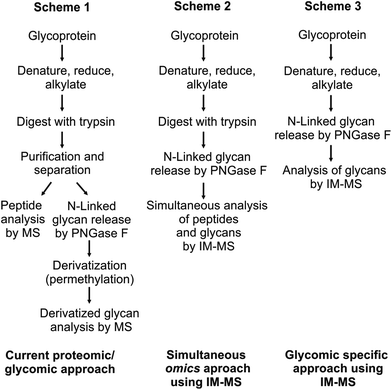
Initial motivation for this study was to develop methodologies for integrating multiple omics workflows (glycomics and proteomics) towards a comprehensive IM-MS-based structural analysis of glycoproteins.3 To minimize time and cost, a single stage of liquid chromatography was utilized, and a method was optimized wherein both proteins and non-derivatized glycans could be fractionated on the same reverse-phase (RP) column. Typical glycoproteomics workflows target either peptides or glycans, but rarely both in the same experiment. For many research facilities that address a wide spectrum of samples (e.g., omics cores and systems-based centers) it would be advantageous in terms of cost, time, sample comparability, and consumption to conduct proteomic, glycomic and glycoproteomic studies on the same LC-MS platform. The ability to utilize the same RP column for both analyses results from adjusting solvent gradients such that glycan studies are carried out under normal phase solvent conditions. This combination of a RP column with a normal phase gradient allows for the stabilization of non-derivatized glycans and produces primarily protonated and minor sodium coordinated glycan signals. This results in the observance of predominately protonated carbohydrate ions within the IM-MS spectra. While this convention is not necessary in some cases, many studies benefit from native glycan analysis. Three different approaches for glycan analysis by MS methods are described in Fig. 1.
 | ||
| Fig. 1 (Scheme 1) A standard protocol for glycoprotein analysis. Purification and derivatization (permethylation) methods are commonly necessary to increase analytical sensitivity, resulting in a time consuming and complex procedure.5 (Scheme 2) Previously reported protocol for the simultaneous omics approach using IM-MS.3 This protocol allows both peptides and N-linked glycans to be simultaneously analyzed with minimal sample preparation. Sensitivity gains are afforded by the use of IM-MS. (Scheme 3) The protocol describes the separation and analysis of carbohydrates without modification by IM-MS. In this scheme, glycoproteins are subjected to denaturing by heat followed by PNGase F enzyme incubation prior to analysis. This procedure simplifies the interpretation of carbohydrates without derivatization or further purification. | ||
The traditional biochemistry approach for glycoprotein analysis by MS is described in Scheme 1 in which glycoproteins are denatured, reduced, and alkylated followed by digestion with trypsin. Samples are separated such that proteomic analysis is carried out independent from glycomics analysis.1,5,6 Enzymes such as PNGaseF are utilized to cleave glycans from the peptide backbone. In this context, glycans are typically derivatized, commonly by permethylation, or fluorescently tagged, to affect glycan separation and/or enhance detection. Although the separation and detection capacity of the presently reported strategy may be reduced over those of labeling, labeling methodologies require extensive separation and purification in addition to alteration of the free glycan structure through derivatization. The present methodology obviates the need for, and addresses challenges of labeling, including perturbation and potential contamination of the sample, as well as increases throughput by not requiring different LC column technologies between proteomics and glycomics.7 Fenn et al. published a simultaneous glycoproteomics protocol in which glycoprotein samples are sequentially processed with trypsin and PNGase F in the same vial which simplifies purification requirements while eliminating the sample fractionation step.3 IM-MS was then utilized to simultaneously acquire both proteomic and glycomic information from the same sample. These analyses were carried out using either matrix assisted laser desorption/ionization (MALDI) or direct infusion electrospray ionization (ESI) sources. In order to batch process samples with ESI and obtain an additional dimension of pre-ionization separation through LC, the techniques originally developed by Fenn and co-workers were further optimized for the studies presented here using bovine fetuin as a biological standard.
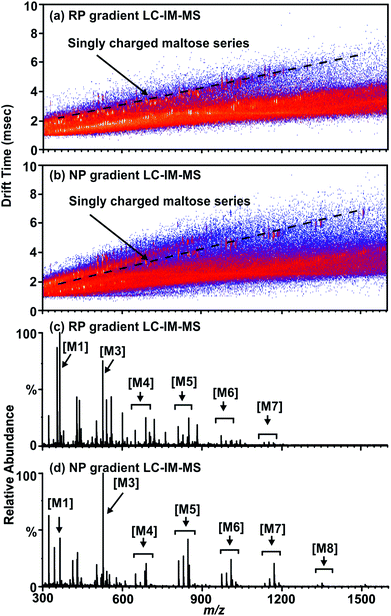
Non-derivatized free glycans elute with the initial aqueous solvent plug in typical RP-LC separations, thus optimization focused on procedures amenable to the separation of free glycans with a RP column. By running a normal phase gradient (organic to aqueous) over a RP C-18 column, separation conditions are created which extends the retention time of carbohydrates disparate from the initial solvent plug as observed in Fig. 2(b) and (d). In this mode, non-derivatized glycans are retained by the column and elute at approximately 6 minutes into the 20 minute chromatographic run. While the chromatographic separation observed is not as well separated as in other methods (such as hydrophilic interaction LC (HILIC)), the addition of LC to previously reported IM-MS based glycoproteomics protocols further increases peak capacity and allows separation of non-derivatized glycans on a RP column. This is demonstrated in Fig. 2(a) and (c) as a series of maltose standards elute in the solvent plug of a reverse phase gradient resulting in lower ion intensity when compared to (b) and (d) which were separated by a normal phase gradient on the same C18 column. Impurities in the sample (such as the presences of maltooctaose (M8)) appear in (b) and (d), illustrating the increased sensitivity of the chromatographic separation for higher mass carbohydrates. Additionally, the lower abundance of signal in (c) in comparison to (d) supports this claim. This allows glycan analysis to be conducted on a standard MS instrument platform fitted with an RP column, such that both glycomic- and proteomic-based samples can be prepared and batch processed with the auto-sampler and conventional RP column of the LC system.
Another consequence of this approach is that glycans are predominately ionized as protonated glycans (M + H) in contrast to MALDI and direct infusion ESI where glycans are predominately ionized as alkali metal-coordinated (M + Na or M + K) species. It should be noted that this LC-IM-MS analysis of non-derivatized glycans with a RP column also creates alkali metal-coordinated ions as minor products (Fig. S1†) which can be utilized to compare previously published glycan MS results, where these species are more typical. As MALDI-MS is considered a gold standard due to high sensitivity for carbohydrate analysis,5,6,8 LC-IM-MS data obtained in this study were evaluated with respect to data obtained by MALDI-IM-MS by the previously published methodology described in Fig. 1, Scheme 2 in further detail in the ESI.†![[thin space (1/6-em)]](https://www.rsc.org/images/entities/char_2009.gif) 3
3
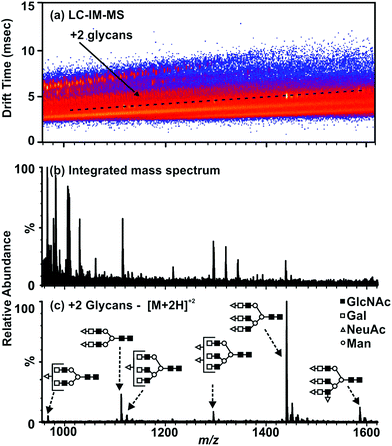
The utility of IM-MS separations for glycan analysis is further illustrated by Fig. 3. The integrated mass spectrum (panel b) represents the data as would be obtained by conventional ESI-MS analysis alone. A region of mobility space occupied by fetuin carbohydrate species is selected (annotated in Fig. 3(a)). Thus, subsequent data-analysis discrimination of the chemical noise produces an enhanced mass spectrum representative of the doubly charged, non-derivatized glycan species (Fig. 3(c)).
 | ||
| Fig. 3 LC-ESI-IM-MS plot and extracted mass spectra from bovine fetuin deglycosylated using PNGase F (protocol from Scheme 3, Fig. 1). (a) A 2-D IM-MS spectrum corresponding to the analysis of carbohydrates from a model glycoprotein (fetuin). Selected region for +2 glycans represent the extracted mass spectrum (c). (b) An integrated mass spectrum illustrating the chemical and chemical noise which would be present without the use of the mobility separation where the base peak intensity is 1.15 × 10⁴ counts. (c) Extracted mass spectrum of free N-linked glycans from fetuin where the base peak intensity is 6.57 × 10³ counts. Carbohydrate structures are represented here and elsewhere by the annotations in (c) as follows: ○ – mannose, Δ – sialic acid, ■ – N-acetylglucosamine, and □ – galactose. LC separations are performed on a RP column under normal-phase gradient conditions which give rise to an ionization preference for protonated carbohydrate ions. | ||
The methodology described herein is readily amenable to LC systems with RP columns allowing for simultaneous omics experiments (proteomics and glycomics) to be conducted on the same analytical platform. To further confirm the effectiveness of the LC methodology for N-linked glycan analysis, studies can be optimized in a mode which obtains MS/MS spectra simultaneously. In this manner, we can begin to assemble comprehensive and multi-dimensional datasets of a suite of biomolecules obtained from minimally processed samples (see ESI†).9
Financial support for this work was provided by Vanderbilt University (Center for Innovative Technology), the Vanderbilt Institute of Chemical Biology, the Vanderbilt Institute for Integrative Biosystems Research and Education, the National Institutes of Health (R01GM092218), and the NIH supported Vanderbilt Chemical Biology Interface training program (5T32GM065086).
Notes and references
- D. J. Harvey, Proteomics, 2001, 1, 311–328 CrossRef CAS.
- W. Morelle, K. Canis, F. Chirat, V. Faid and J. C. Michalski, Proteomics, 2006, 6, 3993–4015 CrossRef CAS PubMed; D. J. Harvey, Expert Rev. Proteomics, 2005, 2, 87–101 CrossRef PubMed; M. Wuhrer, A. R. de Boer and A. M. Deelder, Mass Spectrom. Rev., 2009, 28, 192–206 CrossRef PubMed; J. Bones, S. Mittermayr, N. O. Donoghue, A. Guttman and P. M. Rudd, Anal. Chem., 2010, 82, 10208–10215 CrossRef PubMed; J. Bones, S. Mittermayr, N. Mcloughlin, M. Hilliard, K. Wynne, G. R. Johnson, J. H. Grubb, W. S. Sly and P. M. Rudd, Anal. Chem., 2011, 83, 5344–5352 CrossRef PubMed; S. C. Klapoetke, J. Zhang and S. Becht, J. Pharm. Biomed. Anal., 2011, 56, 513–520 CrossRef PubMed; A. Knežević, J. Bones, S. K. Kračun, O. Gornik, P. M. Rudd and G. Lauc, Analyst, 2011, 136, 4670–4673 RSC; T. Kurihara, J. Z. Min, A. Hirata, T. Toyo'oka and S. Inagaki, Biomed. Chromatogr., 2009, 23, 516–523 CrossRef PubMed.
- L. S. Fenn and J. A. McLean, Mol. BioSyst., 2009, 5, 1298–1302 RSC.
- C. W. N. Damen, W. Chen, A. B. Chakraborty, M. van Oosterhout, J. R. Mazzeo, J. C. Gebler, J. H. M. Schellens, H. Rosing and J. H. Beigen, J. Am. Soc. Mass Spectrom., 2009, 20, 2021–2033 CrossRef CAS PubMed; M. D. Plasencia, D. Isailovic, S. I. Merenbloom, Y. Mechref and D. E. Clemmer, J. Am. Soc. Mass Spectrom., 2008, 19, 1706–1715 CrossRef PubMed; L. S. Fenn and J. A. McLean, Chem. Commun., 2008, 5505–5507 RSC.
- D. J. Harvey, Mass Spectrom. Rev., 1999, 18, 349–450 CrossRef CAS.
- D. J. Harvey, Mass Spectrom. Rev., 2011, 30, 1–100 CrossRef CAS PubMed.
- G. Alvarez-Manilla, N. L. Warren, T. Abney, J. Atwood, P. Azadi, W. S. York, M. Pierce and R. Orlando, Glycobiology, 2007, 17, 677–687 CrossRef CAS PubMed; I. Ciucanu, Anal. Chim. Acta, 2006, 576, 147–155 CrossRef PubMed; P. Kang, Y. Mechref and M. V. Novotny, Rapid Commun. Mass Spectrom., 2008, 22, 721–734 CrossRef PubMed; Y. Mechref, P. Kang and M. V. Novotny, Methods in Molecular Biology Glycomics: Methods and Protocols, Humana Press, Totowa, NJ, 2009, vol. 534, pp. 53–64 CrossRef PubMed; N. P. J. Price, Appl. Biochem. Biotechnol., 2008, 148, 271–276 CrossRef PubMed.
- D. J. Harvey, Mass Spectrom. Rev., 2012, 31, 183–311 CrossRef CAS PubMed.
- C. S. Hoaglund-Hyzer, J. Li and D. E. Clemmer, Anal. Chem., 2000, 72, 2737–2740 CrossRef CAS; K. M. Hines, B. R. Ballard, D. R. Marshall and J. A. McLean, Mol. BioSyst., 2014, 10, 2827–2837 RSC.
Footnote |
| † Electronic supplementary information (ESI) available: Experimental details and additional figures are provided. See DOI: 10.1039/c5an00152h |
| This journal is © The Royal Society of Chemistry 2015 |

