 Open Access Article
Creative Commons Attribution 3.0 Unported Licence
DNA/RNA chimera templates improve the emission intensity and target the accessibility of silver nanocluster-based sensors for human microRNA detection†
Pratik
Shah‡
a,
Suk Won
Choi‡
b,
Ho-jin
Kim‡
b,
Seok Keun
Cho
a,
Peter Waaben
Thulstrup
c,
Morten Jannik
Bjerrum
c,
Yong-Joo
Bhang
b,
Jong Cheol
Ahn
b and
Seong Wook
Yang
*a
aUNIK Center for Synthetic Biology, University of Copenhagen, Thorvaldsensvej 40, DK-1871 Frederiksberg C, Copenhagen, Denmark. E-mail: swyang@life.ku.dk
bSeoulin Bioscience Co. Ltd. 4F. #A, Korea Bio Park, 700, Daewangpangyo-ro, Bundang-gu, Seongnam-si, Gyeonggi-do, Korea
cDepartment of Chemistry, University of Copenhagen, Universitetsparken 5, DK-2100, Copenhagen, Denmark
First published on 25th February 2015
Abstract
In recent years microRNAs (miRNAs) have been established as important biomarkers in a variety of diseases including cancer, diabetes, cardiovascular disease, aging, Alzheimer's disease, asthma, autoimmune disease and liver diseases. As a consequence, a variety of monitoring methods for miRNAs have been developed, including a fast and simple method for miRNA detection by exploitation of the unique photoluminescence of DNA-templated silver nanoclusters (DNA/AgNCs). To increase the versatility of the AgNC-based method, we have adopted DNA/RNA chimera templates for AgNC-based probes, allowing response from several human miRNAs which are hardly detectable with DNA-based probes. Here, we demonstrate in detail the power of DNA/RNA chimera/AgNC probes in detecting two human miRNAs, let-7a and miR-200c. The DNA/RNA chimera-based probes are highly efficient to determine the level of miRNAs in several human cell lines.
Introduction
MicroRNAs are short non-coding RNA strands that modulate expression of thousands of genes at the level of post-transcriptional regulation in eukaryotes.1,2 According to their roles in a variety of biological processes, the levels of miRNAs are dynamically changed in response to cellular and environmental signals.3–5 In humans, the dysregulation of miRNAs has been highlighted in many diseases such as cancer, diabetes, cardiovascular disease and Alzheimer's disease.6–8 Thus, miRNAs are considered useful markers and therapeutic targets for disease diagnosis, prognosis, and treatment.6,9,10 For instance, the expression levels of the miRNA let-7 are frequently low in many cancers but much higher in more differentiated tumors.11–14 Let-7a is also a very attractive potential therapeutic target.12 By modulating the expression of let-7a, tumorigenesis and angiogenesis can be blocked, typically in cancers with low levels of let-7a.15,16 The miR-200 family consists of miR-200a, miR-200b, miR-200c, miR-141, and miR-429. This group of miRNAs is known to suppress cancer metastasis by inhibiting the epithelial–mesenchymal transition (EMT)17,18 and is linked to many cancers such as bladder, breast, melanoma, ovarian, pancreatic, prostate, stomach, lung, and colorectal cancers.18–24In order to efficiently monitor the varying levels of miRNAs, many detection methods have been extensively developed by adopting cutting-edge technologies.25 Currently, conventional or high-tech methods are available for practical use, including small RNA blot analysis,26 microarray-based,27 QRT-PCR-based, amplification-based, immunoblot assay-based, and deep sequencing-based methods.27 Nanotechnology-based strategies have been developed for miRNA detection such as Electrocatalytic Nanoparticle Tags (ENT),28 gold-nanoparticle-based arrays, Surface Plasmon Resonance Imaging (SPRI),29 Surface Enhanced Raman Scattering (SERS)-based assays,30 and Inductively Coupled Plasma Mass Spectrometry (ICP-MS)-based methods.31 Although these methods have robust advantages in target specificity, sensitivity, and multiplicity, the methods have some drawbacks in practical applications such as high running costs, the necessity of sophisticated instruments, and complex procedures with difficult processing steps.
Recently, DNA stabilized silver nano-clusters (AgNCs) have been increasingly used to create nanoscale bio-sensing systems for selective and specific detection of bio-molecules relying on their attractive optical properties such as brightness, tunable emission wavelengths and photo-stability.32–36 By adopting the optical properties of AgNCs, we previously reported a rapid method for miRNA detection.37 In the presence of target miRNA, the bright red fluorescence of DNA/AgNCs is immediately diminished or extinguished in a concentration dependent manner. Therefore, by simply monitoring the emission profile, we can determine the level of target miRNA within an hour. To generalize the DNA/AgNC-based method, we further investigated the mechanism underlying the emission of strong fluorescence and optimized it under buffer conditions.38,39 Furthermore, we showed that multiplex detection of miRNAs in solution is highly feasible using different DNA/AgNC sensors with different emission spectra.40 In fact, we demonstrated that the method is practical enough for screening a novel mutant plant, whose miRNA biogenesis pathway is notably compromised or disrupted.41
Based on these findings, we expanded our study to develop sensors targeting human miRNAs. While testing sensors, we found that several DNA/AgNC sensors for human miRNAs are neither competent to exhibit strong fluorescence nor to detect target miRNAs, as exemplified in this paper by let-7a and miR-200c, respectively. We consider that this behavior may be due to the characteristics of the target miRNA sequences, yielding unfavorable secondary structures for embedding emissive AgNCs, as can be seen in ESI† Fig. S1. To overcome the problems, we utilized an RNA backbone as well as DNA/RNA chimeras in templates for highly emissive AgNC encapsulation and efficient target recognition. Interestingly, when the target sensing part of two non-functional DNA/AgNC sensors was substituted with an RNA sequence to make DNA/RNA chimera templates, one of the sensors became highly emissive and the other showed an improved sensitivity towards its target. Here, we present this new strategy by which the design of nucleic acid-templated AgNC sensors can be further established for specific target miRNAs.
Materials and methods
DNA/RNA chimera probes and desalted miRNA targets were obtained from IDT (Integrated DNA Technologies, BVBA. Interleuvenlaan 12A, 3001 Leuven, Belgium). The synthesis of emissive AgNCs was carried out using AgNO3 (99.9999%) and NaBH4 (99.99%) from Sigma Aldrich. Tris-acetate buffer (pH 7, 0.5 M) was prepared with TRIZMA® acetate salt (≥99.0%, from Sigma Aldrich) in pure Milli-Q water (18.2 MΩ cm). A NaCl (5 mM) solution was prepared with NaCl salt (≥98.0%, from Sigma Aldrich) in pure Milli-Q water.Synthesis of DNA/RNA-chimera/AgNC probes and detection of synthetic target miRNAs
The DNA, DNA/RNA chimera and miRNA sequences used in the publication are described in Fig. 1A, 4A and ESI Fig. S2.† Fluorescent nucleic acid/AgNCs for all the probes with the let-7a target sensing sequence were prepared by incubating nucleic acids (15 μM) with 10 mM Tris-acetate buffer and 0.5 mM NaCl. Fluorescent nucleic acid/AgNCs for all the probes with the miR-200c target sensing sequence were prepared by incubating nucleic acids (15 μM) with 20 mM Tris acetate buffer. NaCl addition does not affect fluorescence emission from miR-200c target sensing probes but enhanced emission was observed for nucleic acid probes with let-7a target sensing sequences. Nucleic acids mixed with buffer were denatured by incubating at 95 °C for 10 minutes. The solutions were then incubated at 25 °C for 20 minutes. The denaturation step was followed by an addition of AgNO3 (250 μM) and NaBH4 (250 μM) (1![[thin space (1/6-em)]](https://www.rsc.org/images/entities/char_2009.gif) :
:![[thin space (1/6-em)]](https://www.rsc.org/images/entities/char_2009.gif) 17
17![[thin space (1/6-em)]](https://www.rsc.org/images/entities/char_2009.gif) :
:![[thin space (1/6-em)]](https://www.rsc.org/images/entities/char_2009.gif) 17) to obtain a final volume of 50 μl. All the nucleic acid/AgNCs were incubated for 1 h at 25 °C and diluted with 450 μl of distilled water just before measurements on a fluorimeter (Horiba Jobin Yvon, Fluoromax-4) in a 10 mm disposable cuvette. We here indicate the concentrations of nucleic acids and buffer in the 50 μl reaction mixture.
17) to obtain a final volume of 50 μl. All the nucleic acid/AgNCs were incubated for 1 h at 25 °C and diluted with 450 μl of distilled water just before measurements on a fluorimeter (Horiba Jobin Yvon, Fluoromax-4) in a 10 mm disposable cuvette. We here indicate the concentrations of nucleic acids and buffer in the 50 μl reaction mixture.
For the miRNA detection assay, we added a fixed amount of specific or non-specific target miRNAs (15 μM) to the DNA/RNA chimera sensors (15 μM) at the given concentrations of Tris-acetate buffer with or without NaCl. This was followed by the subsequent incubation at 95 °C for 10 minutes and at 25 °C for 20 minutes. Then, AgNO3 (250 μM) and NaBH4 (250 μM) were added to the DNA/RNA chimera and miRNA mixtures to obtain a final volume of 50 μl. All the DNA/RNA chimera/AgNCs were incubated for 1 h at 25 °C and diluted with 450 μl of distilled water before measurements using a fluorimeter (Horiba Jobin Yvon, Fluoromax-4) in a 10 mm disposable cuvette. We here indicate the concentrations of nucleic acids, buffer and salts in the reaction volume (50 μl). Before measuring the fluorescence, the volume was increased from 50 μl to 500 μl for all RNA-miRNAs.
The overall scheme is as follows, also see ESI† Fig. S5:
(1) Mix and anneal all nucleic acid components in buffer.
(2) Add AgNO3 and NaBH4 and incubate for 1 h.
(3) Dilute and measure fluorescence.
Detection of miRNA in biological samples
Total RNA was isolated from HT-29, HEK-293T, HepG2, and MDA-MB-231, PANC-1 and MIA-PACA2 cell lines using a TRI Reagent Solution (Ambion). RNA concentrations were measured using a NanoDrop ND 1000 spectrophotometer. The small RNA sample (5 μg) from each cell line was mixed with 5 μl of gel loading buffer (Ambion) and resolved on denaturing 15% polyacrylamide gels containing 7.5 M urea. The separated RNA samples were transferred onto a positively charged Amersham Hybond-N+ nylon membrane (GE Healthcare) using a trans-blot SD semi-dry electrophoretic transfer cell (Bio-Rad). Next, the membranes were further crosslinked using UV irradiation. Before hybridization, the membranes were pre-hybridized for at least 30 minutes at 40 °C in ULTRAhyb®-oligo hybridization buffer (Ambion). Next, the biotin-labeled probes (complementary to target miRNAs) were added to the hybridization buffer. The membranes were hybridized for 12 to 16 hours at 40 °C with gentle shaking and subsequently rinsed with washing buffer (1× SSC, 0.1% SDS) 3 times for approximately 15 minutes at room temperature. The biotin-labeled probes were detected using a chemiluminescent nucleic acid detection module kit (Thermo Scientific, USA). After rinsing, the membranes were blocked again with blocking buffer for 15 minutes with gentle shaking at room temperature followed by incubation for an additional 15 minutes with hybridization buffer containing the stabilized streptavidin–HRP conjugate. After washing 3 times, the membranes were equilibrated in substrate equilibration buffer for 5 minutes. Finally, the membranes were placed in a clean container, covered completely with a working solution, and incubated for 5 minutes in the dark. A working solution was prepared with a luminol/enhancer solution and a stable peroxide solution. The membranes were placed in a cassette with X-ray films and exposed for different periods of time (depending on the desired signal intensity). For miRNA detection using the DNA/RNA chimera, 5 μg of total RNA (total RNA was dissolved in RNAse free distilled water, instead of a 50% formamide solution, in the final step of purification) was incubated with the respective DNA/RNA chimera (15 μM). This was followed by incubation at 95 °C for 10 minutes, which was followed by the same AgNC formation procedure as described previously.37,39Results and discussion
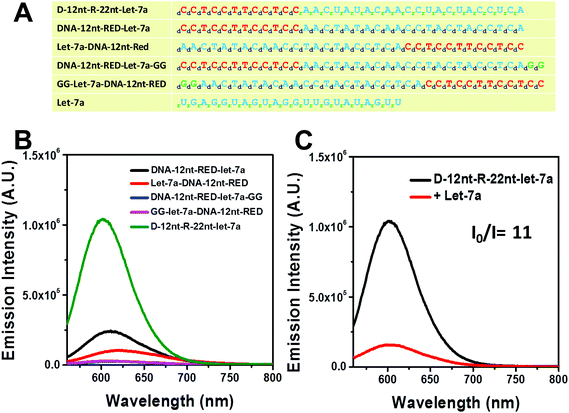
For plant miRNA detection, we have successfully shown the functionality of self-structured DNA/AgNC sensors.37,39 Similar to the designed sensors for plant miRNAs, we primarily designed DNA/AgNC sensors against many human miRNAs with self-forming structures. Unexpectedly, we found that some of the designed DNA/AgNC sensors were unable to encapsulate highly emissive AgNC species, even though the reconstitution of sequences and subsequent embedment of secondary structures were implemented following our previous strategy. As shown in Fig. 1A, four sensors against let-7a gave disappointing results as DNA-12nt-RED-let-7a/AgNCs emitted red fluorescence with an intensity around 2 × 10⁵ which is not sufficient for their practical use as sensors for miRNA detection. Thus, similar to our previous work39 we attempted to enhance the emission intensity by switching the position of target sensing sequences with the DNA-12nt-RED scaffold or by adding extra GG sequences to stimulate G/C pairs. However, we were unable to observe any fluorescence from DNA-templated AgNC sensors for let-7a. We believe that the sensors failed because they were not able to form an adequate secondary structure for AgNC encapsulation (Fig. 1B). We explored this hypothesis by predicting the secondary structure of the DNA/AgNC sensors: DNA-12nt-RED-let-7a and Let-7a-DNA-12nt-RED prefer to form a lump-like no-stem-hair-pin structure that contains three cytosines. Furthermore, DNA-12nt-RED-let-7a-GG shows a hair-pin structure at the end of 3-termini and GG-Let-7a-DNA-12nt-RED forms a perfect stem and loop structure with a large loop that may be incompetent to tightly hold silver clusters by C–Ag–C bridges (ESI† Fig. 1S). If we add serial guanines (e.g. GGGGG), a feasible structure for AgNC encapsulation can be generated but the expanded sequence possibly compromises the target specificity of the sensor. Therefore, we found that we could not design a satisfactory sensor for let-7a using a DNA backbone. These results exemplify that not all of the hugely diverse miRNA sequences in humans can be fully adapted to our previous strategy.Very recently, Shultz and Gwinn reported that RNA-based structures can be good templates for highly emissive AgNCs with different physical and chemical features towards DNA.42 In addition, we also recently reported that RNA or DNA/RNA chimera sequences can be excellent templates for encapsulating emissive AgNCs.43 In order to generate a highly bright let-7a sensor, we adopted the physical and chemical features of RNA – rotational freedom of the backbone that forms unusual secondary structures – to allow AgNC encapsulation. The DNA nucleotides of target recognition sequences against let-7a were substituted with RNA nucleotides and named D-12nt-R-22nt-let-7a. Fig. 1A shows the sequences of D-12nt-R-22nt-let-7a that was used. After labeling of D-12nt-R-22nt-let-7a it immediately displayed a very bright red fluorescence from the encapsulated AgNCs. Fig. 1B shows the strong red fluorescence (620 nm) of D-12nt-R-22nt-let-7a (green curve) when it is excited at 520 nm. Compared to the four DNA/AgNC sensors for let-7a, the emission intensity of D-12nt-R-22nt-let-7a was increased about 10-fold. As a plausible model for the significant signal induction, we previously interpreted that the flexibility of RNA backbones forming C–Ag+–C structures via transient pockets can be the reason of the strong fluorescence emission in the D-12nt-R-22nt-let-7a sensor.43 Although we presented here only one type of DNA/RNA chimera template for let-7a detection, three DNA/RNA chimera sensors – D-22nt-R-12nt-let-7a, D-17nt-R-17nt-let-7a, and D-12nt-R-22nt-let-7a – were tested to establish the correlation between the ratios of RNA versus DNA bases.43 Among the three DNA/RNA sensors, we selected D-12nt-R-22nt-let-7a for further experiments.
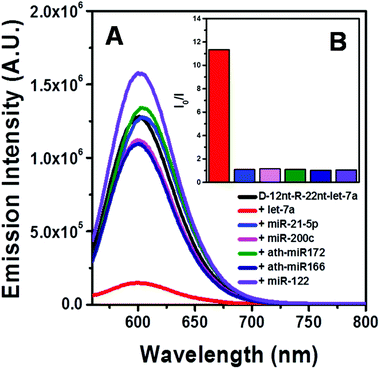
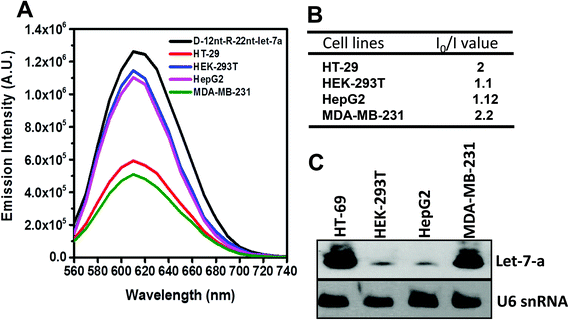
To be an efficient miRNA sensor, not only must the emission of strong fluorescence be occurring, but also the target recognition is essential. Therefore, we here investigated whether D-12nt-R-22nt-let-7a can be used for let-7a detection by monitoring the drop in the emission intensity. As shown in Fig. 1C, the emission drops by an order of magnitude (from 1.0 × 10⁶ to 9.0 × 10⁴) as can clearly be seen by addition of target let-7a (red curve). This shows that this DNA/RNA chimera-templated AgNC sensor is competent to detect its target. Next, we investigated whether the D-12nt-R-22nt-let-7a sensor specifically recognizes its target, let-7a, in competition with non-specific targets. In contrast to the emission drop in the presence of let-7a, the other non-specific targets, miR-21, miR-200c, ath-miR166, and ath-miR172, were unable to extinguish the strong red fluorescence (Fig. 2A, see the sequence information at ESI† Fig. S2). As shown in the inset of Fig. 2B, the D-12nt-R-22nt-let-7a probe displays an I0/I value of 11 in the presence of let-7a. Besides, the D-12nt-R-22nt-let-7a probe displays an I0/I value of 0.8–1.2 in the presence of non-specific miRNAs, showing the high specificity of the D-12nt-R-22nt-let-7a probe. These results clearly demonstrate that this DNA/RNA chimera sensor successfully distinguishes its specific target, let-7a, from non-specific targets. Furthermore, to confirm the practical functionality of the D-12nt-R-22nt-let-7a probe, we analyzed the level of let-7a in several cancer cell lines. First, we extracted total RNA from HT-29, HEK-293T, HepG2, and MDA-MB-231 cell lines and determined the level of let-7a using small RNA blot analysis. HT-29 originated from colorectal adenocarcinoma. HEK-293T is a human embryonic kidney cell line that has generally been used as a control against cancer cell lines. HepG2 and MDA-MB-231 are a type of liver and breast cancer cell lines, respectively. As shown in Fig. 3C, the expression levels of let-7a were highly variable amongst the cancer cell lines; let-7a was highly accumulated in HT-29 and MDA-MB-231 cell lines, while HEK-293T and HepG2 cell lines showed only a trace amount of let-7a. Through the quantification of let-7a based on the small RNA blot experiment, we confirmed that let-7a is highly expressed in colorectal adenocarcinoma and breast cancer cell lines. To test whether these differential expression patterns can be detected with the D-12nt-R-22nt-let-7a sensor, by adding the same amount of total RNA (5 μg) used for small RNA blot analysis, we monitored the red fluorescence of D-12nt-R-22nt-let-7a/AgNCs. The emission intensity of the let-7a sensor was notably dropped to half-intensity (Fig. 3A, B), when the total RNA from HT-29 or MDA-MB-231 was added. In contrast, the fluorescence was not significantly disrupted by addition of the total RNA from HEK-293T or HepG2. This result clearly shows that the D-12nt-R-22nt-let-7a sensor is able to read out the levels of endogenous let-7a in the tested cancer cell lines, and that the response is consistent with the result of small RNA blot analysis.
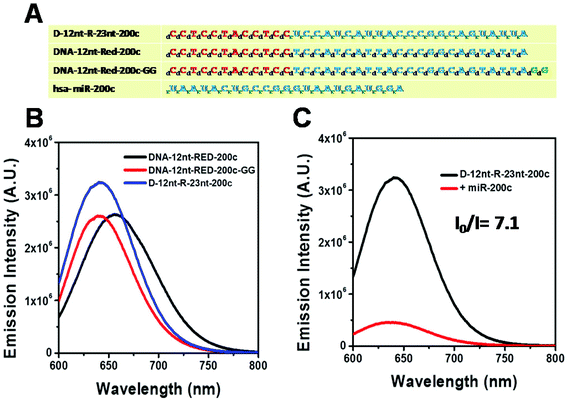
Relying on the positive result of the chimera sensor for let-7a, we further applied chimera templates to redesign a miR-200c sensor. In contrast to the case of let-7a, two DNA/AgNC sensors for miR-200c were competent to encapsulate highly emissive AgNC species (Fig. 4A, B). Those two DNA sensors, named DNA-12nt-RED-200c and DNA-12nt-RED-200c-GG, showed strong red fluorescence at 620 nm (2.5 × 10⁶) and at 640 nm (2.5 × 10⁶), respectively. But the strong red fluorescence of DNA/AgNC sensors was not dramatically diminished in the presence of miR-200c, implying their insensitivity to the target (ESI† Fig. S3). We assumed that the structural stability of the DNA/AgNC sensors could be so high that target hybridization was not favorable. As we previously proposed, a DNA/RNA chimera sensor may have two-stepwise processes – kinetic trap formation and C–Ag+–C bridging – when encapsulating emissive AgNCs. The kinetic trap can be thought of as a transient structure or a transient pocket facile for AgNC encapsulation. The stability of such a transient structure should be much weaker than a fully hybridized structure formed between a chimera sensor and its target. Thus, by adjusting the structural stability of a transient pocket, we attempted to balance two factors: the formation of a target hybridized structure and the adequate stability of a transient structure for encapsulation of emissive AgNCs.
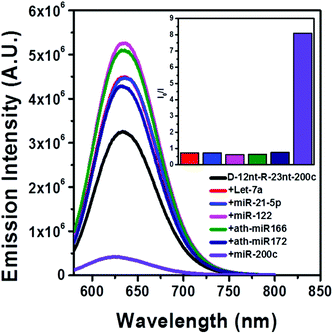
The DNA nucleotides of target recognition sequences against miR-200c were substituted with RNA nucleotides and named D-12nt-R-23nt-200c (Fig. 4A). Unlike D-12nt-R-22nt-let7a, the emission intensity of D-12nt-R23nt-200c was not notably increased as compared to its DNA/AgNC type sensors. As shown in Fig. 4B, D-12nt-R23nt-200c shows red fluorescence up to 3.2 × 10⁶ while the two DNA/AgNC sensors also reach 2.6 × 10⁶ (23% improvement). Accordingly, without further change of the design, we tested whether D-12nt-R-23nt-200c is able to recognize the target miR-200c. With the substitution of DNA with RNA in the backbone of the target complementary sequence, the strong red fluorescence significantly diminished in the presence of miR-200c, showing the functionality of D-12nt-R23nt-200c (Fig. 4C). These results confirm the previous notion that the emission intensity is dependent on the secondary structure of templated nucleic acids and the hybridization of target miRNA disrupts the secondary structure of a given sensor, resulting in the characteristic emission drop. As mentioned above, the target accessibility is highly dependent on the thermodynamic stability of the secondary structure of sensors. Therefore, we tested whether the D-12nt-R-23nt-200c/AgNC chimera is thermodynamically less stable than the other DNA/AgNC sensors. Indeed, the emission intensity of D-12nt-R-23nt-200c/AgNCs was dramatically influenced at 75 °C (dropped 10 fold) while the strong fluorescence of the DNA/AgNC sensor decreased about 2 fold. This result implied that the secondary structure of D-12nt-R-23nt-200c is more fragile than that of two DNA/AgNC sensors. We interpret this in the sense that the relatively lower thermodynamic stability of the chimera may enhance the target sensitivity (ESI† Fig. S3). In fact, compared to the stable hair-pin structure of DNA-12nt-RED-200c, the actual structure of D-12nt-R23nt-200c cannot be clearly predicted by prevailing models because of its characteristics as a DNA/RNA chimera. Similar to the specificity test for the D-12nt-R-22nt-let-7a sensor, we further investigated the target specificity of the D-12nt-R-23nt-200c sensor. As shown in the inset of Fig. 5, the D-12nt-R-23nt-200c probe displays an I0/I value of 8 when it encounters miR-200c. In contrast, the D-12nt-R-23nt-200c probe displays I0/I values below 1 in the presence of non-specific miRNAs, showing a high specificity of the D-12nt-R23nt-200c sensor. Notably, all the tested non-specific targets, let-7a, miR-21-5p, miR-122, ath-miR166, and ath-miR172, rather increased the emission intensity when they were mixed with D-12nt-R-23nt-200c. We previously suggested that this interesting phenomenon may be derived from the formation of an as of yet unknown structure in solution, possibly a partially hybridized triple stranded structure.44 At the moment, we do not have a clear answer for the cause of this phenomenon; however the observations we made clearly confirm that our method is applicable for practical use, as only a specific target is able to extinguish the fluorescence of the sensor.
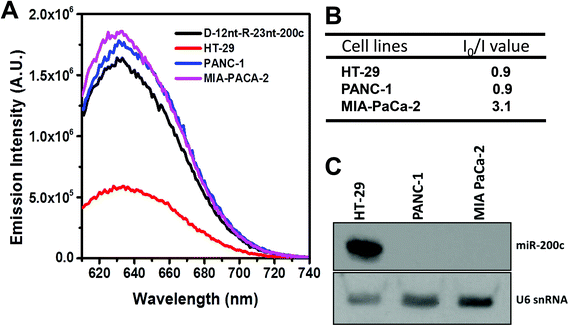
To further confirm the practical functionality of the D-12nt-R-23nt-200c probe, we analyzed the level of miR-200c in several cancer cell lines. It has been reported that the expression level of miR-200c is highly up-regulated in HT-29 cell lines. For the cell line verification, using small RNA blot analysis, we determined the level of miR-200c in HT-29 together with two negative control lines, PANC-1 and MIA-PACA-2. Indeed, HT-29 cells accumulated a high amount of miR-200c while the other two control lines showed no expression of miR-200c. By applying the same amount of total RNA (5 μg) used for small RNA blot analysis, we monitored the red fluorescence of D-12nt-R-23nt-200c. Interestingly, the emission intensity of the miR-200c sensor was notably diminished when the total RNA from HT-29 was added. In contrast, the fluorescence increased by addition of the total RNA from PANC-1 or MIA-PACA-2 (Fig. 6A). These results clearly demonstrate that the DNA/RNA chimera probe for miR-200c successfully distinguished its specific target miR-200c from thousands of non-specific small RNA target molecules including miRNAs, siRNAs, and piRNAs.
As is well-known, there are two major differences between DNA and RNA, the former contains the sugar deoxyribose, while the latter is composed of ribose with a hydroxyl group at the 2′ position of the sugar. DNA contains adenine, cytosine, guanine and thymine but RNA contains uracil, instead of thymine. Because of the differences, the chemical and physical features of RNA are greatly distinguished from those of DNA. By combining RNA and DNA in a single strand, unique chemical and physical properties can be achieved and such DNA/RNA chimeras have been employed for many biological and medical approaches.45,46 For instance, a DNA/RNA chimera was developed to correct frame-shift mutation in episomal or chromosomal copies of genes, emerging as a potential method for gene therapy.46–50 DNA/RNA chimeras have frequently been used for in vitro experiments such as isothermal linear nucleic acid amplification, site-specific mutagenesis, and quantitative RT-PCR.51,52 Recently, a DNA/RNA chimera was used as a molecular beacon to quantify nucleic acids, single nucleotide polymorphisms (SNP), and nucleic acid damage.53
We have here for the first time shown how DNA/RNA chimera templates can be used as miRNA target recognizing AgNC-based biosensors with improved properties. By exploiting their distinct chemical and physical features, we have here demonstrated that DNA/RNA chimera templates have untapped potential for use as novel AgNC-based biosensors, as we proved how the simple substitution of DNA with RNA bases in the target sensing sequence enhanced both the fluorescence and target sensitivity of the miRNA sensors. Furthermore, the DNA/RNA chimera sensors, D-12nt-R-22nt-let-7a and D-12nt-R-23nt-200c, displayed strong functionality in detecting – within an hour – their specific targets in the presence of the total RNA from cancer cell lines. Considering the unfavorable performance of some pure DNA-templated AgNC sensors, especially for let-7a and miR-200c, it has been shown that the feasibility of DNA/RNA chimera sensors for practical use is highly promising. Although we have shown the novel strategy that remedies the shortcomings of some DNA/AgNC sensors, the overall strategy of DNA/AgNC sensors for miRNA detection should not be depreciated; numerous additional DNA/AgNC sensors have been successfully designed in our laboratory, which are effective in detecting plant miRNAs37,39,40 and human miRNAs (data not published yet). Our study suggests that the design of AgNC-based sensors should consider an expanded choice of templates: DNA, RNA, and DNA/RNA chimeras. Furthermore, we envisage a diverse utilization of DNA/RNA chimera templates in AgNC-based bio-molecular sensing. For example, DNA/RNA chimeras could be used for the SNP analysis method using DNA/AgNC sensors that were recently developed by Yeh et al.33
Conclusions
DNA/AgNC sensors are highly convenient and rapid in producing reliable results in detecting the presence of miRNA compared to northern blot analysis of miRNAs, even in a complex nucleic acid mixture. However, a problem encountered by us with DNA/AgNC sensors is that not all the systematically designed DNA/AgNC sensors are functional to detect miRNAs. In order to overcome this problem, we have investigated DNA/RNA chimeras as a new type of nucleic acid-template for AgNC encapsulation. Previously, we reported that DNA/RNA chimeras can be useful templates for embedding emissive AgNC species. By introducing the rotational freedom of the sugar backbone in RNAs, we could enhance both the emission intensity and target sensitivity of pure DNA-based miRNA sensors. Our results here demonstrate the detection of two human miRNAs, let-7a and miR-200c, in human cell lines that proves that DNA/RNA chimeras can be reliable and efficient templates for AgNC-based sensors.References
- V. Ambros, Nature, 2004, 431, 350 CrossRef CAS PubMed.
- D. P. Bartel, Cell, 2004, 116, 281 CrossRef CAS.
- G. Stefani and F. J. Slack, Nat. Rev. Mol. Cell Biol., 2008, 9, 219 CrossRef CAS PubMed.
- K. Kruszka, M. Pieczynski, D. Windels, D. Bielewicz, A. Jarmolowski, Z. Szweykowska-Kulinska and F. Vazquez, J. Plant Physiol., 2012, 169, 1664 CrossRef CAS PubMed.
- B. Khraiwesh, J.-K. Zhu and J. Zhu, Biochim. Biophys. Acta, 2012, 1819, 137 CrossRef CAS PubMed.
- N. Yanaihara, N. Caplen, E. Bowman, M. Seike, K. Kumamoto, M. Yi, R. M. Stephens, A. Okamoto, J. Yokota, T. Tanaka, G. A. Calin, C. G. Liu, C. M. Croce and C. C. Harris, Cancer Cell, 2006, 9, 189 CrossRef CAS PubMed.
- R. Natarajan, S. Putta and M. Kato, J. Cardiovasc. Transl. Res., 2012, 5, 413 CrossRef PubMed.
- S. Fichtlscherer, S. De Rosa, H. Fox, T. Schwietz, A. Fischer, C. Liebetrau, M. Weber, C. W. Hamm, T. Roxe, M. Muller-Ardogan, A. Bonauer, A. M. Zeiher and S. Dimmeler, Circ. Res., 2010, 107, 677 CrossRef CAS PubMed.
- N. Rosenfeld, R. Aharonov, E. Meiri, S. Rosenwald, Y. Spector, M. Zepeniuk, H. Benjamin, N. Shabes, S. Tabak, A. Levy, D. Lebanony, Y. Goren, E. Silberschein, N. Targan, A. Ben-Ari, S. Gilad, N. Sion-Vardy, A. Tobar, M. Feinmesser, O. Kharenko, O. Nativ, D. Nass, M. Perelman, A. Yosepovich, B. Shalmon, S. Polak-Charcon, E. Fridman, A. Avniel, I. Bentwich, Z. Bentwich, D. Cohen, A. Chajut and I. Barshack, Nat. Biotechnol., 2008, 26, 462 CrossRef CAS PubMed.
- O. Kovalchuk, J. Filkowski, J. Meservy, Y. Ilnytskyy, V. P. Tryndyak, V. F. Chekhun and I. P. Pogribny, Mol. Cancer Ther., 2008, 7, 2152 CrossRef CAS PubMed.
- Q. Xu, Q. G. Dong, L. P. Sun, C. Y. He and Y. Yuan, BMC Clin. Pathol., 2013, 13, 11 CrossRef CAS PubMed.
- S. Lyu, Q. Yu, G. Ying, S. Wang, Y. Wang, J. Zhang and Y. Niu, Int. J. Oncol., 2014, 44, 229 CAS.
- C. Luu, E. L. Heinrich, M. Duldulao, A. K. Arrington, M. Fakih, J. Garcia-Aguilar and J. Kim, PLoS One, 2013, 8, e70604 CAS.
- E. Erturk, G. Cecener, U. Egeli, B. Tunca, G. Tezcan, S. Gokgoz, S. Tolunay and I. Tasdelen, Mol. Cell. Biochem., 2014, 395, 77 CrossRef CAS PubMed.
- Z. Zhang, L. Huang, Z. Yu, X. Chen, D. Yang, P. Zhan, M. Dai, S. Huang, Z. Han and K. Cao, DNA Cell Biol., 2014, 33, 136 CrossRef CAS PubMed.
- F. Wang, P. Zhang, Y. Ma, J. Yang, M. P. Moyer, C. Shi, J. Peng and H. Qin, Cancer Lett., 2012, 314, 223 CrossRef CAS PubMed.
- L. Adam, M. Zhong, W. Choi, W. Qi, M. Nicoloso, A. Arora, G. Calin, H. Wang, A. Siefker-Radtke, D. McConkey, M. Bar-Eli and C. Dinney, Clin. Cancer Res., 2009, 15, 5060 CrossRef CAS PubMed.
- M. Pichler, A. L. Ress, E. Winter, V. Stiegelbauer, M. Karbiener, D. Schwarzenbacher, M. Scheideler, C. Ivan, S. W. Jahn, T. Kiesslich, A. Gerger, T. Bauernhofer, G. A. Calin and G. Hoefler, Br. J. Cancer, 2014, 110, 1614 CrossRef CAS PubMed.
- V. P. Tryndyak, F. A. Beland and I. P. Pogribny, Int. J. Cancer, 2010, 126, 2575 CAS.
- Y. Li, T. G. VandenBoom 2nd, D. Kong, Z. Wang, S. Ali, P. A. Philip and F. H. Sarkar, Cancer Res., 2009, 69, 6704 CrossRef CAS PubMed.
- D. Kong, Y. Li, Z. Wang, S. Banerjee, A. Ahmad, H. R. Kim and F. H. Sarkar, Stem Cells, 2009, 27, 1712 CrossRef CAS PubMed.
- D. L. Gibbons, W. Lin, C. J. Creighton, Z. H. Rizvi, P. A. Gregory, G. J. Goodall, N. Thilaganathan, L. Du, Y. Zhang, A. Pertsemlidis and J. M. Kurie, Genes Dev., 2009, 23, 2140 CrossRef CAS PubMed.
- I. Elson-Schwab, A. Lorentzen and C. J. Marshall, PLoS One, 2010, 5 Search PubMed.
- S. Ali, A. Ahmad, S. Banerjee, S. Padhye, K. Dominiak, J. M. Schaffert, Z. Wang, P. A. Philip and F. H. Sarkar, Cancer Res., 2010, 70, 3606 CrossRef CAS PubMed.
- M. de Planell-Saguer and M. C. Rodicio, Anal. Chim. Acta, 2011, 699, 134 CrossRef CAS PubMed.
- S. Streit, C. W. Michalski, M. Erkan, J. Kleeff and H. Friess, Nat. Protoc., 2009, 4, 37 CrossRef CAS PubMed.
- C. C. Pritchard, H. H. Cheng and M. Tewari, Nat. Rev. Genet., 2012, 13, 358 CrossRef CAS PubMed.
- Z. Gao and Z. Yang, Anal. Chem., 2006, 78, 1470 CrossRef CAS PubMed.
- S. Fang, H. J. Lee, A. W. Wark and R. M. Corn, J. Am. Chem. Soc., 2006, 128, 14044 CrossRef CAS PubMed.
- J. D. Driskell and R. A. Tripp, Chem. Commun., 2010, 46, 3298 RSC.
- T. C. de Bang, P. Shah, S. K. Cho, S. W. Yang and S. Husted, Anal. Chem., 2014, 86, 6823 CrossRef CAS PubMed.
- J. T. Petty, B. Giri, I. C. Miller, D. A. Nicholson, O. O. Sergev, T. M. Banks and S. P. Story, Anal. Chem., 2013, 85, 2183 CrossRef CAS PubMed.
- H. C. Yeh, J. Sharma, M. Shih Ie, D. M. Vu, J. S. Martinez and J. H. Werner, J. Am. Chem. Soc., 2012, 134, 11550 CrossRef CAS PubMed.
- J. Sharma, H. C. Yeh, H. Yoo, J. H. Werner and J. S. Martinez, Chem. Commun., 2011, 47, 2294 RSC.
- H. C. Yeh, J. Sharma, J. J. Han, J. S. Martinez and J. H. Werner, Nano Lett., 2010, 10, 3106 CrossRef CAS PubMed.
- W. Guo, J. Yuan, Q. Dong and E. Wang, J. Am. Chem. Soc., 2010, 132, 932 CrossRef CAS PubMed.
- S. W. Yang and T. Vosch, Anal. Chem., 2011, 83, 6935 CrossRef CAS PubMed.
- P. Shah, S. K. Cho, P. W. Thulstrup, Y. J. Bhang, J. C. Ahn, S. W. Choi, A. Rorvig-Lund and S. W. Yang, Nanotechnology, 2014, 25, 045101 CrossRef PubMed.
- P. Shah, A. Rorvig-Lund, S. B. Chaabane, P. W. Thulstrup, H. G. Kjaergaard, E. Fron, J. Hofkens, S. W. Yang and T. Vosch, ACS Nano, 2012, 6, 8803 CrossRef CAS PubMed.
- P. Shah, P. W. Thulstrup, S. K. Cho, Y. J. Bhang, J. C. Ahn, S. W. Choi, M. J. Bjerrum and S. W. Yang, Analyst, 2014, 139, 2158 RSC.
- S. K. Cho, S. B. Chaabane, P. Shah, C. P. Poulsen and S. W. Yang, Nat. Commun., 2014, 5, 5867 CrossRef PubMed.
- D. Schultz and E. Gwinn, Chem. Commun., 2011, 47, 4715 RSC.
- P. Shah, P. W. Thulstrup, S. K. Cho, M. J. Bjerrum and S. W. Yang, Chem. Commun., 2014, 50, 13592 RSC.
- L. Feng, Z. Huang, J. Ren and X. Qu, Nucleic Acids Res., 2012, 40, e122 CrossRef CAS PubMed.
- P. R. Beetham, P. B. Kipp, X. L. Sawycky, C. J. Arntzen and G. D. May, Proc. Natl. Acad. Sci. U. S. A., 1999, 96, 8774 CrossRef CAS.
- H. B. Gamper, H. Parekh, M. C. Rice, M. Bruner, H. Youkey and E. B. Kmiec, Nucleic Acids Res., 2000, 28, 4332 CrossRef CAS PubMed.
- H. Kotani and E. B. Kmiec, Mol. Cell. Biol., 1994, 14, 6097 CrossRef CAS.
- H. Kotani, M. W. Germann, A. Andrus, R. Vinayak, B. Mullah and E. B. Kmiec, Mol. Gen. Genet., 1996, 250, 626 CrossRef CAS.
- P. A. Havre and E. B. Kmiec, Mol. Gen. Genet., 1998, 258, 580 CrossRef CAS.
- L. W. Lai and Y. H. Lien, Kidney Int., 2002, 61, S47 CrossRef PubMed.
- O. Peleg, G. Baneth, O. Eyal, J. Inbar and S. Harrus, Appl. Environ. Microbiol., 2009, 75, 6393 CrossRef CAS PubMed.
- N. Kurn, P. Chen, J. D. Heath, A. Kopf-Sill, K. M. Stephens and S. Wang, Clin. Chem., 2005, 51, 1973 CAS.
- A. F. El-Yazbi and G. R. Loppnow, Anal. Chem., 2013, 85, 4321 CrossRef CAS PubMed.
Footnotes |
| † Electronic supplementary information (ESI) available. See DOI: 10.1039/c5an00093a |
| ‡ Equal contributions. |
| This journal is © The Royal Society of Chemistry 2015 |

