
 Open Access Article
 This Open Access Article is licensed under a
 Creative Commons Attribution 3.0 Unported Licence
Correction: Imaging mass spectrometry of a mouse brain by tapping-mode scanning probe electrospray ionization
Yoichi
Otsuka
*a,
Junpei
Naito
a,
Shuya
Satoh
a,
Masafumi
Kyogaku
a,
Hiroyuki
Hashimoto
a and
Ryuichi
Arakawa
b
aFrontier Research Center, Canon Inc., 30-2 Shimomaruko 3-chome, Ohta-ku, Tokyo 146-8501, Japan. E-mail: otsuka.yoichi@canon.co.jp; Tel: +81-3-3758-2111
bDepartment of Chemistry and Materials Engineering, Faculty of Chemistry, Materials, and Bioengineering, Kansai University, 3-3-35 Yamatecho, Suita, Osaka 564-8680, Japan. E-mail: arak@kansai-u.ac.jp; Tel: +81-6-6368-0781
First published on 14th January 2015
Abstract
Correction for ‘Imaging mass spectrometry of a mouse brain by tapping-mode scanning probe electrospray ionization’ by Yoichi Otsuka et al., Analyst, 2014, 139, 2336–2341.
On pp. 2338 and 2339, there are errors in the captions to Fig. 2 and Table 1, where the ion images and assignments for the major ion peaks shown, respectively, are identified as being obtained from a rat brain section. This is not correct and we would like to confirm that the images and peak data were obtained from a mouse brain section. Correct versions of Fig. 2 and Table 1 are shown here below.
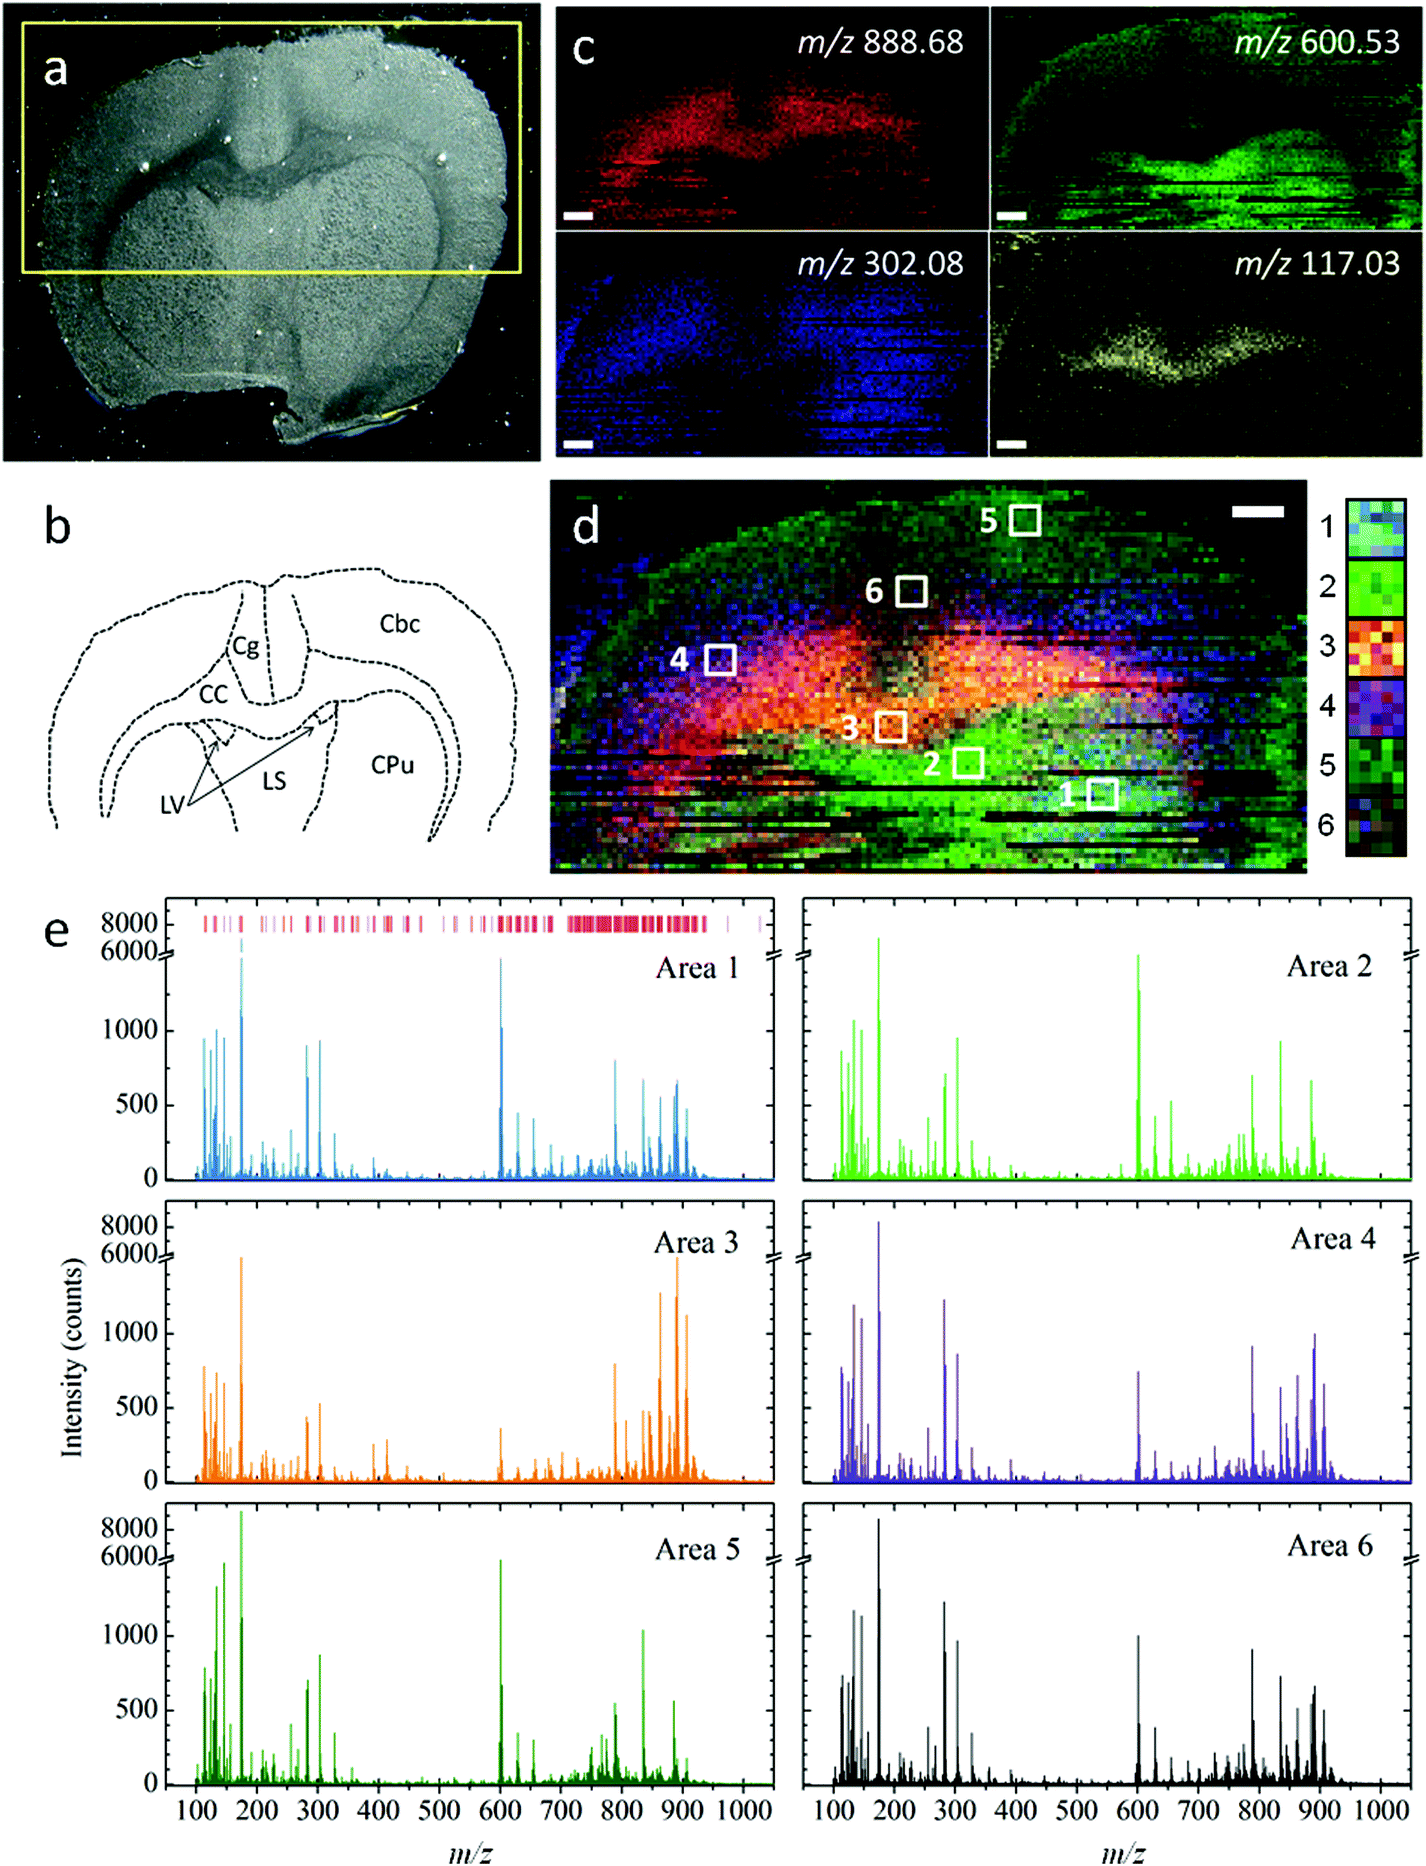 | ||
| Fig. 2 Negative-ion mode SPESI-MS of the mouse brain section. (a) Optical image of a coronal mouse brain section. (b) Diagram delineates the major brain anatomical regions such as corpus callosum (cc), cerebral cortex (Cbc), caudate putamen (CPu), lateral septum (LS), lateral ventricle (LV) and cingulate cortex (Cg). (c) Selected ion images of specific molecules at the area of t-SPESI measurement. The m/z for each image is noted inside. (d) An overlaid image of 4 images in (c). Six regions of interest (ROI) were selected for the comparison of mass spectra. All ROI were magnified as shown on the right side. (e) SPESI mass spectra of six ROI. The ions derived from the brain sections are shown as the red line in the mass spectrum of area 1. Scale bar: 1 mm. | ||
| Measured mass | Molecular species | Ion type | Exact mass | Error ppm | A | B | C | D |
|---|---|---|---|---|---|---|---|---|
| a (A) Tentatively assigned form database. (B) Peaks reported by Wiseman et al. (ref. 15). (C) Peaks reported by Eberlin et al. (ref. 14). (D) Peaks reported by Janfelt et al. (ref. 16). Cer, ceramide; DG, diacylglycerols; FA, fatty acid; PE, phosphoethanolamine; PS, phosphoserine; ST, sulfatide; TG, triacylglycerols. | ||||||||
| 117.03 | Succinic acid | [M − H]− | 117.0193 | 49 | * | |||
| 133.03 | FA; 2,3-dihydroxy-valeric acid | [M − H]− | 133.0506 | 192 | * | |||
| 146.08 | Glutamic acid | [M − H]− | 146.0456 | 201 | * | |||
| 174.08 | FA; 2-amino-3-oxo-hexanedioic acid | [M − H]− | 174.0408 | 197 | * | |||
| 255.23 | Palmitic acid | [M − H]− | 255.233 | 31 | * | * | * | |
| 281.28 | Octadecenoic acid | [M − H]− | 281.2486 | 94 | * | * | * | |
| 283.28 | Stearic acid | [M − H]− | 283.2643 | 38 | * | * | * | |
| 303.28 | Arachidonic acid | [M − H]− | 303.233 | 139 | * | * | * | * |
| 327.23 | Docosatriynoic acid | [M − H]− | 327.233 | 24 | * | * | * | * |
| 391.28 | CPA (16![[thin space (1/6-em)]](https://www.rsc.org/images/entities/char_2009.gif) :0) :0) |
[M − H]− | 391.2255 | 127 | * | |||
| 413.28 | Ascorbyl palmitate | [M − H]− | 413.2545 | 50 | * | |||
| 446.38 | TG (55:5) |
[M − 2H]− | 446.3765 | 7 | * | |||
| 600.53 | Cer (37:1) |
[M + Na–2H]− | 600.4667 | 6 | * | |||
| 628.58 | Cer (39:1) |
[M + Na–2H]− | 628.565 | 16 | * | |||
| 654.58 | Cer (40:0) |
[M − H]− | 654.6042 | 45 | * | |||
| 657.58 | DG (49:4) |
[M − H]− | 657.5464 | 43 | * | |||
| 679.53 | TG (13:0/13:0/13:0) |
[M − H]− | 679.5882 | 93 | * | |||
| 682.63 | Cer (42:0) |
[M − H]− | 682.6355 | 15 | * | |||
| 701.53 | PE–Cer (37:1) |
[M − H]− | 701.5603 | 50 | * | |||
| 726.58 | Plasmenyl-PE (36:2) |
[M − H]− | 726.589 | 19 | * | * | ||
| 750.58 | Plasmenyl-PE (37:5) |
[M − H]− | 750.589 | 19 | * | * | * | |
| 766.58 | PE (38:4) |
[M − H]− | 766.5392 | 47 | * | * | * | |
| 774.58 | PE (40:6) |
[M − H]− | 774.5443 | 40 | * | * | * | |
| 788.58 | PS (36:1) |
[M − H]− | 788.5236 | 65 | * | * | ||
| 806.58 | ST (18:0) |
[M − H]− | 806.5458 | 36 | * | * | * | |
| 834.58 | PS (40:6) |
[M − H]− | 834.5771 | 3 | * | * | * | * |
| 844.68 | PS (40:1) |
[M − H]− | 844.6073 | 80 | * | |||
| 862.68 | ST (22:0) |
[M − H]− | 862.6084 | 77 | * | * | * | |
| 878.63 | ST (h22:0) |
[M − H]− | 878.6033 | 25 | * | * | * | |
| 885.58 | PI (38:4) |
[M − H]− | 885.5499 | 28 | * | * | * | * |
| 888.68 | ST (24:1) |
[M − H]− | 888.624 | 57 | * | * | * | |
| 890.68 | ST (24:0) |
[M − H]− | 890.6397 | 40 | * | * | * | |
| 904.68 | ST (h24:1) |
[M − H]− | 904.6189 | 62 | * | * | * | |
| 906.68 | ST (h24:0) |
[M − H]− | 906.6346 | 45 | * | * | * | |
| 916.73 | ST (25:0) |
[M − H]− | 916.6731 | 57 | * | * | * | |
| This journal is © The Royal Society of Chemistry 2015 |