
 Open Access Article
 This Open Access Article is licensed under a
 Creative Commons Attribution 3.0 Unported Licence
Determination of selenium in serum in the presence of gadolinium with ICP-QQQ-MS
David P.
Bishop†
a,
Dominic J.
Hare†
 ab,
Fred
Fryer
c,
Regina V.
Taudte
a,
Barbara R.
Cardoso
bd,
Nerida
Cole
a and
Philip A.
Doble
*a
ab,
Fred
Fryer
c,
Regina V.
Taudte
a,
Barbara R.
Cardoso
bd,
Nerida
Cole
a and
Philip A.
Doble
*a
aElemental Bio-imaging Facility, University of Technology Sydney, Broadway, New South Wales 2007, Australia. E-mail: philip.doble@uts.edu.au; Fax: +61 2 9514 1460; Tel: +61 2 9514 1792
bThe Florey Institute of Neuroscience and Mental Health, The University of Melbourne, Parkville, Victoria, Australia
cAgilent Technologies, Mulgrave, Victoria, Australia
dFaculty of Pharmaceutical Sciences, Department of Food and Experimental Nutrition, University of São Paolo, Brazil
First published on 23rd February 2015
Abstract
Gadolinium (Gd)-based magnetic resonance imaging (MRI) contrasting agents interfere with the determination of selenium (Se) when analysed by single quadrupole inductively coupled plasma-mass spectrometry (ICP-MS). This paper demonstrates that an ICP-triple quadrupole-MS (ICP-QQQ-MS) with oxygen mass shift overcomes Gd++ interference on Se+ and mitigates typically encountered matrix and spectral based interferences. Normal human serum was diluted in a solution containing isopropanol, EDTA, NH4OH and Triton X-100. Samples were unspiked (control) serum; serum spiked with 0.127 μmol L−1 Se or 127 μmol L−1 Gd; and serum spiked with both 0.127 μmol L−1 Se and 127 μmol L−1 Gd. Consideration of collision/reaction gases and conditions for interference mitigation included helium (He); a ‘low’ and ‘high’ hydrogen (H2) flow, and oxygen (O2). The instrument tune for O2 was optimised for effective elimination of interferences via a mass shift reaction of Se+ to SeO+. The ICP-QQQ-MS was capable of detecting trace (>9.34 nmol L−1) levels of Se in serum in the presence of Gd in our simulated post-MRI serum sample. The multi-tune capabilities of the ICP-QQQ-MS may be adapted to eliminate other specific isobaric interferences that cause false positive results in other analyses where the analyte is confounded by doubly charged and/or polyatomic species.
1. Introduction
Selenium (Se) is an essential trace element that is incorporated into the amino acid backbone of proteins as selenocysteine. Selenium has structural and enzymatic roles in 25 known human selenoproteins.1–3 These proteins are antioxidants and required for the production of active thyroid hormone, but more recently roles in immune function, control of viruses such as HIV, prevention of cancer and reproductive health have been described.4–9 Selenium deficiency has been associated with diseases affecting nutrient absorption including coeliac disease, some types of cancer, restricted diets and Keshan disease.4,10–14 Additionally, a significant decline in blood Se levels with age has been reported.15 Stated serum levels vary geographically. For example, in healthy European populations levels ranged from around 0.5 to 1.2 μmol L−1 of Se.15–17 while levels as low as 0.34 μmol L−1 have been reported in populations where Keshan disease occurs.18Single quadrupole inductively coupled plasma-mass spectrometry (SQ-ICP-MS) is the preferred standard analytical method for analysis of most elements in biological fluids, and represents 95% of all commercial ICP-MS instruments.19 The two most abundant isotopes are 80Se and 78Se, with 82Se the preferred isotope for pre-collision cell technology along with interference equation correction, due to less isobaric interferences from the argon plasma and the sample matrix (Table 1), whilst 78Se is the preferred isotope when using collision cells. Gadolinium (Gd) is widely used in contrasting agents for magnetic resonance imaging (MRI) of the vasculature and tumours of the central nervous system,20 and interferes with the major isotopes of Se due to doubly charged Gd species.21–23
| Isotope | Natural abundance (%) | Potential molecular interferences |
|---|---|---|
| 74Se | 0.89 | 37Cl2+, 36Ar38Ar+, 38Ar36S+, 40Ar34S+ |
| 76Se | 9.37 | 40Ar36Ar+, 38Ar2+ |
| 77Se | 7.63 | 40Ar37Cl+, 36Ar40Ar1H+, 38Ar21H+, 12C19F14N16O2+, 154Gd++, 155Gd++ spread |
| 78Se | 23.8 | 40Ar38Ar+, 38Ar40Ca+, 78Kr+, 156Gd++, 157Gd++ spread |
| 80Se | 49.6 | 40Ar2+, 32S16O3+, 79Br1H+,80Kr+, 160Gd++ |
| 82Se | 8.73 | 12C35Cl2+, 34S16O3+, 40Ar21H2+ 81Br1H+, 82Kr+ |
Consequently, incorrect diagnosis of Se toxicity may arise from the presence of high levels of circulating Gd. Total elimination of circulating Gd may be in the order of days or longer for those with impaired renal function.24 For example, in 2008, a clinical urine sample measured by ICP-MS returned a Se concentration of 16.8 μmol L−1, a level associated with acute Se poisoning. This measurement was an artefact resulting from an MRI procedure performed on the day of testing using a Gd contrasting agent.22
Interference on Se is typically managed by a collision/reaction cell which removes polyatomic species with kinetic energy discrimination or by chemically induced dissociation, providing reduced backgrounds and improved limits of detection and quantification.21,25 The higher mass resolving power of double-focusing sector field mass-spectrometers (ICP-SF-MS) is an alternative to reducing the impact of polyatomic and isobaric interferences on mass measurements.26–28 However, ICP-SF-MS are costly, complex, and high resolution settings compromise the sensitivity of the analysis when resolving Ar dimers from Se. Comparisons of SQ-ICP-MS with a collision/reaction cell against a SF-ICP-MS demonstrated that 80Se+ could not be resolved from 40Ar2+ in the high-resolution SF-ICP-MS and the SQ-ICP-MS had superior isotope ratio precision and a lower LOD.30 Mathematical corrections may also be used to remove the signal from doubly charged31 and polyatomic species,32 but are less accurate than removing interfering species by physical methods.
The triple quadrupole ICP-MS (ICP-QQQ-MS) reduces interferences by operating in either standard single quadrupole (SQ) mode or tandem MS/MS. In the MS/MS mode a quadrupole (Q1) filters the mass-to-charge ratio (m/z) of interest prior to introduction into an ion-guide (Q2), which has the option to be filled with a collision and/or reaction gas. The final quadrupole (Q3) again filters the desired analyte, either on its original mass or the known reaction product.33 O2 may be used to react with kinetically favoured analytes to an MO+ mass filtered by Q3, removing all other interfering species. This approach was applied to the measurement of selenoproteins in rat serum by liquid chromatography (LC)-ICP-MS/MS34 and arsenic (As) and Se in food.35 This MO+ mass shift improved detection limits for phosphorus (P), sulfur (S) and silicon (Si) over those obtained from isotope dilution (ID)-ICP-SF-MS in both aqueous34 and organic matrices.34,36 However if O2 reaction has the potential to produce unwanted polyatomic species; then alternative reaction/collision gases may be used, e.g. NH3/He for the ultra-trace detection of titanium (Ti; as Ti(NH3)6+) in biological fluids.37
This paper describes the analysis of clinically relevant concentrations of Se in serum samples in the presence of Gd via an O2 mass shift approach.
2. Experimental
2.1 Instrumentation
All analyses were performed using an Agilent Technologies 8800 Series ICP-QQQ-MS (Mulgrave, Victoria, Australia). Four tune modes were evaluated; (tune mode 1) high energy helium (HE-He), 10 mL min−1 He flow; (tune mode 2) H2 at a low cell flow (low H2), 5 mL min−1 H2 flow; (tune mode 3) high flow H2 (high H2), 9 mL min−1 H2 flow; and (tune mode 4) O2, 0.28 mL min−1 O2 flow. Gd (m/z = 156, 157) was measured on mass for tune modes 1–3, Se m/z 77 and 78 were analysed for the HE-He tune, and Se m/z 77, 78 and 82 for the two H2 tune modes. The elements were measured with a 16O mass shift with the O2 tune (m/z 77 → 93, 78 → 94, 80 → 96, 82 → 98, 156 → 172, 157 → 173). The octopole bias (OctP Bias) and the energy discrimination were optimised for each tune mode (see Table 2).| Tune mode | Cell gas flow | OctP bias (V) | Energy discrimination (V) | ICP mode |
|---|---|---|---|---|
| HE-He | 10 mL min−1 | −100 | 7 | SQ |
| Low H2 | 5.0 mL min−1 | −18 | 1.5 | MS/MS |
| High H2 | 9.0 mL min−1 | −18 | 1.5 | MS/MS |
| O2 | 0.28 mL min−1 | −3 | −5 | MS/MS |
2.2 Reagents
Human serum, A.C.S.-grade EDTA-acid, Triton X-100 and NH4OH were obtained from Sigma Aldrich (Castle Hill, New South Wales, Australia). HPLC-grade isopropanol was purchased from Chem-Supply (Gilman, South Australia, Australia), 99.999% purity O2, He, and H2 from BOC (North Ryde, New South Wales, Australia), and high purity Se, Gd and tellurium (Te) standards from Choice Analytical (Thornleigh, New South Wales, Australia).2.3 Sample preparation
Sample preparation was modified from that described by Burri and Haldimann.38 Briefly, a diluent containing 4% isopropanol, 0.1% EDTA, 0.1% Triton X-100 and 2% NH4OH was prepared. Te was added to this solution as the internal standard to a final concentration of 0.130 μmol L−1 in the sample. 0.25 mL of serum was mixed with 2.5 mL of diluent, with the volume made to 5.0 mL with MilliQ water and element (Se/Gd) spike. Samples were spiked with an appropriate amount of Se to give a concentration of 0.127 μmol L−1, and Gd spiked at a concentration of 127 μmol L−1 (based on post-MRI serum Gd values reported by Brown et al.39). Four sample groups of 10 replicates each were prepared; a serum blank, Se, Gd, and Se + Gd spiked sample. The concentration of Se in our serum samples (0.127 μmol L−1) represented both Se-deficient adult or low-range infant serum Se concentrations.402.4 Data analysis
Following instrument calibration by standard addition, sample concentrations for each m/z in the 10 replicate samples was calculated using the Agilent ICP-MS MassHunter data analysis software. Statistical analysis (Student's t-test; p < 0.05) was performed in Prism 6 (GraphPad, La Jolla, California, United States of America).3. Results
3.1 Collision/reaction conditions
Four tune modes were examined for the determination of Se in human serum under conditions simulating those following the administration of a Gd MRI contrasting agent. The modes represented three commonly used methods of interference removal; kinetic energy discrimination (He), removal via reaction with hydrogen (H2), or adduct formation via reaction with O2.For tune mode 1, Q1 was set as an ion guide. Tune 1 (HE-He) used a high potential difference (the OctP bias) to accelerate incoming ions into the He-filled octopole cell for collisional induced dissociation of the ArAr dimer. Energy discrimination was optimised to reduce ions escaping the confines of the cell maintaining a low background. For tunes 2 and 3 (H2 tunes) the cell was optimised for reaction mode. To facilitate desirable in-cell reactions, a low negative voltage OctP bias accelerated ions into the cell, and a slight positive bias limited in-cell products from exiting the cell, providing more time for reaction. Tune mode 2 used an H2 flow rate of 5.0 mL min−1 (standard conditions for Se determination, to reduce the 40Ar38Ar+ dimer at m/z 78), and tune mode 3 used a higher flow rate (9.0 mL min−1), determined experimentally as the optimal rate to reduce 156Gd++ interference on m/z 78, whilst maintaining adequate sensitivity for 78Se+ (Fig. 1). In the case of tune mode 4 (O2 mass shift), the energy and cell gas flow was optimised to maximise the low yield endothermic Se+ + O → SeO+ reaction (δ 0.69 eV), and to minimise the exothermic reaction of Gd++ with O2 (Gd+ + O → GdO+, δ −2.39 eV). Energy discrimination of −5 V was experimentally determined to minimise 156Gd16O2++ and maximise 78Se16O+ passage through the collision/reaction cell and into Q3. The first mass filter (Q1) limited the transmission to the cell of plasma generated ions to the selected mass. The results are shown in Table 3.
 | ||
| Fig. 1 High H2 flow rate performance: ramp cell gas plots for high H2 (tune mode 3) reaction with m/z = 78 (a) and 156 (b). BEC = background equivalent concentration. Dashed grey line denotes selected H2 flow rate that maximises the signal of m/z 78 above the blank while reducing the signal of m/z 156. Blank contains 127 μmol L−1 Gd in serum, standard is 0.127 μmol L−1 Se in 127 μmol L−1 Gd in serum. At 9 mL min−1 H2 (dashed grey line) there is the greatest difference between the blank and the standard, while maintaining sufficient signal strength. | ||
| Serum blank | Gd | Se | Se + Gd | |
|---|---|---|---|---|
| 77Se HE-He | 0.0524 ± 0.0065 | 8.78 ± 0.58 | 0.166 ± 0.008 | 8.96 ± 0.39 |
| 78Se HE-He | 0.0528 ± 0.0061 | 32.6 ± 2.2 | 0.168 ± 0.007 | 32.8 ± 1.3 |
| 77Se Low H2 | 0.0405 ± 0.0051 | 0.546 ± 0.009 | 0.134 ± 0.009 | 0.627 ± 0.014 |
| 78Se Low H2 | 0.0445 ± 0.0046 | 0.546 ± 0.029 | 0.146 ± 0.008 | 0.627 ± 0.023 |
| 82Se Low H2 | 0.0506 ± 0.0050 | 0.0578 ± 0.0053 | 0.161 ± 0.009 | 0.171 ± 0.010 |
| 77Se High H2 | 0.0501 ± 0.0043 | 0.0631 ± 0.0052 | 0.159 ± 0.010 | 0.174 ± 0.011 |
| 78Se High H2 | 0.0478 ± 0.0046 | 0.0526 ± 0.0049 | 0.151 ± 0.010 | 0.158 ± 0.011 |
| 82Se High H2 | 0.0478 ± 0.0046 | 0.0526 ± 0.0055 | 0.151 ± 0.009 | 0.158 ± 0.009 |
| 77Se O2 | 0.0534 ± 0.0050 | 0.0581 ± 0.0056 | 0.170 ± 0.011 | 0.169 ± 0.010 |
| 78Se O2 | 0.0532 ± 0.0047 | 0.0604 ± 0.0052 | 0.168 ± 0.012 | 0.171 ± 0.010 |
| 80Se O2 | 0.0520 ± 0.0045 | 0.0576 ± 0.0054 | 0.165 ± 0.010 | 0.166 ± 0.009 |
| 82Se O2 | 0.0517 ± 0.0045 | 0.0546 ± 0.0053 | 0.163 ± 0.010 | 0.162 ± 0.009 |
3.2 Instrument performance
The amount of Se spiked into the serum standard was selected from typical ranges reported by Thomson.41 The limits of detection (LOD) and quantification (LOQ) (Table 4) were determined from the signal intensities using eqn (1), where y = 3 for LOD and 10 for LOQ. | (1) |
LOD and LOQ data were not acquired for 80Se for tune modes 1–3 due to inability of the ICP-QQQ-MS to discriminate m/z 80 for 80Se+ and 40Ar2+. Tune mode 4 permitted the monitoring of the 80Se+ isotope as 80Se16O+.
4. Discussion
The isotopes of Se that may be determined are shown in Table 1. The most commonly measured isotope is 78Se (23.8% NA), graphically represented in Fig. 2a–d for each tune mode. The presence of the Gd++ interference was not mitigated by the HE-He tune (tune mode 1), the low H2 tune (tune mode 2), or the high flow H2 tune (tune mode 3), with Se concentrations overestimated by up to 20 times. The O2-induced mass shift using tune mode 4 sufficiently removed doubly-charged Gd interference, which also allowed measurement of the more highly-abundant 80Se isotope by shifting the measured m/z away from the 40Ar2+ interference (Fig. 2e). The O2 mass shift (tune mode 4) was clearly the most accurate and precise method with recoveries of 99.7–101.8% for 77Se, 78Se, 80Se and 82Se from Se + Gd spiked serum samples.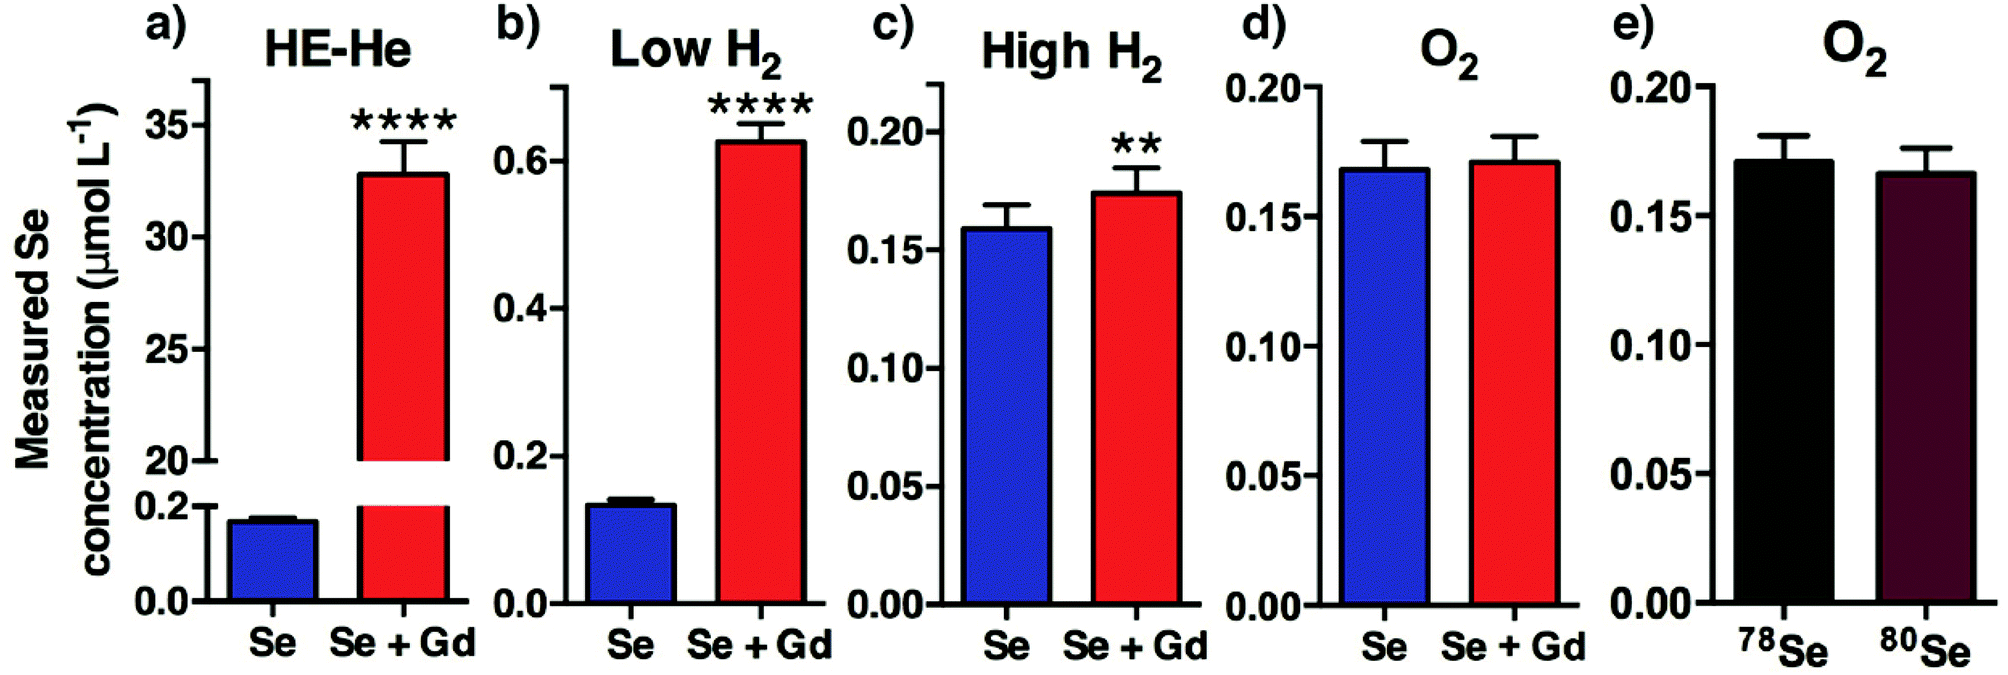 | ||
| Fig. 2 Gd++ interference removal efficiency: comparison of measured Se concentrations of Se spiked (blue) and Se + Gd spiked (red) samples. HE-He (a; tune mode 1), low H2 (b; tune mode 2) and high H2 (c; tune mode 3) were all unable to sufficiently remove 156Gd++ interference on 78Se+ (****p < 0.0001; **p < 0.01; n = 10). Measuring the mass shift of 78→94 (78Se16O+) resulting from reaction with O2 (d; tune mode 4) was able to adequately remove 156Gd++ interference (p = 0.535; n = 10). Furthermore, O2 mass shift permitted analysis of the higher NA isotope 80Se (NA 49.6%), with no significant difference in measured Se concentration observed between measured 78Se16O+ and 80Se16O+ masses (e; p = 0.316; n = 10). | ||
Helium is often used as a collision gas to reduce interferences on the majority of elements. Tune mode 1 (HE-He) removed the ArAr interference on 77,78Se+, however it did not eliminate the 154,156Gd++ signal. This tune did not remove the 40Ar40Ar+ interference on 80Se+, whilst 82Se+ was not examined due to the high number of polyatomic interferences arising from the biological matrix (Table 1).
Tune mode 2 (low H2) effectively removed the polyatomic interferences, but was unable to sufficiently reduce the interference caused by the Gd++ ions. Tune mode 3 (high H2) mitigated the polyatomic interferences on 77,78,82Se+ and eliminated the 154Gd++ (NA 2.18%) interference on 77Se+ (p < 0.05). Tune mode 3 failed to eliminate the 156Gd++ (NA 20.5%) interference on 78Se+. This contrasts with Harrington et al.21 who found that H2 in the collision cell with a flow rate of 3.26 mL min−1 removed Gd++ interference on the Se signal in serum due to the concentration of Se an order of magnitude higher than this study (0.127 μmol L−1vs. 1.01–3.56 μmol L−1). Similarly, Jackson et al.35 removed the interference of 156Gd++ on the measurement of 78Se+ with a H2 cell gas flow of 6 mL min−1 in food samples, also due to high to relatively high concentrations of Se; and a Gd spike 200 times lower than our simulation of post-MRI serum Gd concentration.
Other concerns with H2 as a reaction gas include patients with high levels of circulating bromine, arising from bromhexine hydrochloride, a common ingredient in expectorants. H2 reacts with 79Br+ and 81Br+ to form isobaric interferences on 80Se+ and 82Se+, respectively. Deuterium has been used to overcome BrH+ interferences,42 though high expense limits its practical usage.
Tune mode 4 maximised the formation of Se16O+ adducts and minimised the influence of doubly-charged Gd species on Se detection across all isotopes and was the superior method for Se determination, irrespective of isotope. Others have increased the yield of SeO+ with mixed gases of H2 and O2 in the collision cell.35 We also trialled mixed cell gases and did not observe any benefit.
Minimising unwanted masses entering, and preventing undesirable interactions, in the collision cell, is a significant feature of the ICP-QQQ-MS. For example S+ may be removed from the ion path before it reaches the collision cell, where it could potentially form kinetically favourable species such as 32S16O3+. The ICP-QQQ-MS may also find application in method validation strategies by ensuring isotopically pure signals particularly for analytes known to be confounded by polyatomic or isobaric interferences.
5. Conclusions
Gd-based MRI contrasting agents interfere with Se analyses by ICP-MS. Reaction with O2 using the ICP-QQQ-MS allowed a mass shift reaction of Se, which enabled detection of all major isotopes of Se with adequate sensitivity in the presence of Gd. Additionally, this approach overcame interferences from Ar dimers, further improving the sensitivity of the analysis. ICP-QQQ-MS has the unique capability to selectively isolate ions of interest from interferences or confounding signals at low concentrations, as demonstrated in this simulated scenario of Gd interference on serum Se levels.Notes and references
- G. V. Kryukov, Science, 2003, 300, 1439–1443 CrossRef CAS PubMed.
- S. J. Fairweather-Tait, Y. Bao, M. R. Broadley, R. Collings, D. Ford, J. E. Hesketh and R. Hurst, Antioxid. Redox Signaling, 2011, 14, 1337–1383 CrossRef CAS PubMed.
- K. M. Brown and J. R. Arthur, Public Health Nutr., 2007, 4 Search PubMed.
- D. L. Hatfield, P. A. Tsuji, B. A. Carlson and V. N. Gladyshev, Trends Biochem. Sci., 2014, 39, 112–120 CrossRef CAS PubMed.
- I. L. Heras, M. Palomo and Y. Madrid, Anal. Bioanal. Chem., 2011, 400, 1717–1727 CrossRef CAS PubMed.
- M. Roman, P. Jitaru, M. Agostini, G. Cozzi, S. Pucciarelli, D. Nitti, C. Bedin and C. Barbante, Microchem. J., 2012, 105, 124–132 CrossRef CAS PubMed.
- J. Salonen, G. Alfthan, J. Huttunen, J. Pikkarainen and P. Puska, Lancet, 1982, 320, 175–179 CrossRef.
- G. N. Schrauzer, D. A. White and C. J. Schneider, Bioinorg. Chem., 1977, 7, 23–34 CrossRef CAS.
- G. N. Schrauzer, D. A. White and C. J. Schneider, Bioinorg. Chem., 1978, 8, 387–396 CrossRef CAS.
- T. D. Shultz and J. E. Leklem, Am. J. Clin. Nutr., 1983, 37, 114–118 CAS.
- P. Collin, K. Kaukinen, M. Välimäki and J. Salmi, Endocr. Rev., 2002, 23, 464–483 CrossRef CAS PubMed.
- I. Hafström, B. Ringertz, A. Spångberg, L. von Zweigbergk, S. Brannemark, I. Nylander, J. Rönnelid, L. Laasonen and L. Klareskog, Rheumatology, 2001, 40, 1175–1179 CrossRef PubMed.
- M. A. Reeves and P. R. Hoffmann, Cell. Mol. Life Sci., 2009, 66, 2457 CrossRef CAS PubMed.
- J. Loscalzo, N. Engl. J. Med., 2014, 370, 1756–1760 CrossRef CAS PubMed.
- S. Letsiou, T. Nomikos, D. Panagiotakos, S. Pergantis, E. Fragopoulou, S. Antonopoulou, C. Pitsavos and C. Stefanadis, Biol. Trace Elem. Res., 2009, 128, 8–17 CrossRef CAS PubMed.
- M. P. Rayman, Lancet, 2000, 356, 233–241 CrossRef CAS.
- M. Rükgauer, J. Klein and J. D. Kruse-Jarres, J. Trace Elem. Med. Biol., 1997, 11, 92–98 Search PubMed.
- A. T. Diplock, Am. J. Clin. Nutr., 1993, 57, 256S–258S CAS.
- D. Potter, J. Anal. At. Spectrom., 2008, 23, 690–693 RSC.
- J. M. Idee, M. Port, I. Raynal, M. Schaefer, S. Le Greneur and C. Corot, Fundam. Clin. Pharmacol., 2006, 20, 563–576 CrossRef CAS PubMed.
- C. F. Harrington, A. Walter, S. Nelms and A. Taylor, Ann. Clin. Biochem., 2014, 51, 386–391 CrossRef CAS PubMed.
- A. Walter, S. Nelms, C. F. Harrington and A. Taylor, Ann. Clin. Biochem., 2011, 48, 176–177 CrossRef CAS PubMed.
- A. J. Steuerwald, P. J. Parsons, J. G. Arnason, Z. Chen, C. M. Peterson and G. M. B. Louis, J. Anal. At. Spectrom., 2013, 28, 821–830 RSC.
- S. Aime and P. Caravan, J. Magn. Reson. Imaging, 2009, 30, 1259–1267 CrossRef PubMed.
- L. Hinojosa Reyes, J. M. Marchante-Gayon, J. I. Garcia Alonson and A. Sanz-Medel, J. Anal. At. Spectrom., 2003, 18, 11–16 RSC.
- A. M. Featherstone, A. T. Townsend, G. A. Jacobson and G. M. Peterson, Anal. Chim. Acta, 2004, 512, 319–327 CrossRef CAS PubMed.
- C. S. Muniz, J. M. Larchante-Gayon, J. I. G. Alonso and A. Sanz-Medel, J. Anal. At. Spectrom., 1999, 14, 193–198 RSC.
- G. A. Jacobson, Y. C. Tong, A. T. Townsend, A. M. Featherstone, M. Ball, I. K. Robertson and G. M. Peterson, Eur. J. Clin. Nutr., 2007, 61, 1057–1063 CrossRef CAS PubMed.
- T. W. May and R. H. Wiedmeyer, At. Spectrosc., 1998, 19, 150–155 CAS.
- N. Elwaer and H. Hintelmann, Talanta, 2008, 75, 205–214 CAS.
- A. L. Gray and J. G. Williams, J. Anal. At. Spectrom., 1987, 2, 81–82 RSC.
- J. Goossens, L. Moens and R. Dams, Talanta, 1994, 41, 187–193 CrossRef CAS.
- L. Balcaen, G. Woods, M. Resano and F. Vanhaecke, J. Anal. At. Spectrom., 2013, 28, 33 RSC.
- Y. Anan, Y. Hatakeyama, M. Tokumoto and Y. Ogra, Anal. Sci., 2013, 29, 787–792 CrossRef CAS.
- B. P. Jackson, A. Liba and J. Nelson, J. Anal. Atom. Spectrom., 2015 10.1039/C4JA00310A.
- R. S. Amais, C. D. B. Amaral, L. L. Fialho, D. Schiavo and J. A. Nóbrega, Anal. Methods, 2014, 6, 4516–4520 RSC.
- L. Balcaen, E. Bolea-Fernandez, M. Resano and F. Vanhaecke, Anal. Chim. Acta, 2014, 809, 1–8 CrossRef CAS PubMed.
- J. Burri and M. Haldimann, Clin. Chem. Lab. Med., 2007, 45, 895–898 CrossRef CAS PubMed.
- J. J. Brown, M. R. Hynes, J. Wible and J. H, Am. J. Roentgenol., 2007, 189, 1539–1544 CrossRef PubMed.
- A. C. Muntau, M. Streiter, M. Kappler, W. Röschinger, I. Schmid, A. Rehnert, P. Schramel and A. A. Roscher, Clin. Chem., 2002, 48, 555–560 CAS.
- C. D. Thomson, Eur. J. Clin. Nutr., 2004, 58, 391–402 CrossRef CAS PubMed.
- Y. Ogra, K. Ishiwata and K. T. Suzuki, Anal. Chim. Acta, 2005, 554, 123–129 CrossRef CAS PubMed.
Footnote |
| † Equal first authors. |
| This journal is © The Royal Society of Chemistry 2015 |