
 Open Access Article
 This Open Access Article is licensed under a
 Creative Commons Attribution 3.0 Unported Licence
Fast IR laser mapping ellipsometry for the study of functional organic thin films
Andreas
Furchner
*a,
Guoguang
Sun
a,
Helge
Ketelsen
b,
Jörg
Rappich
c and
Karsten
Hinrichs
a
aLeibniz-Institut für Analytische Wissenschaften – ISAS – e. V., Schwarzschildstraße 8, 12489 Berlin, Germany. E-mail: andreas.furchner@isas.de; Fax: +49 231 1392-3544; Tel: +49 231 1392-3588
bSENTECH Instruments GmbH, Schwarzschildstraße 2, 12489 Berlin, Germany
cHelmholtz-Zentrum Berlin für Materialien und Energie GmbH, Institut für Silizium-Photovoltaik, Kekuléstraße 5, 12489 Berlin, Germany
First published on 12th January 2015
Abstract
Fast infrared mapping with sub-millimeter lateral resolution as well as time-resolved infrared studies of kinetic processes of functional organic thin films require a new generation of infrared ellipsometers. We present a novel laboratory-based infrared (IR) laser mapping ellipsometer, in which a laser is coupled to a variable-angle rotating analyzer ellipsometer. Compared to conventional Fourier-transform infrared (FT-IR) ellipsometers, the IR laser ellipsometer provides ten- to hundredfold shorter measurement times down to 80 ms per measured spot, as well as about tenfold increased lateral resolution of 120 μm, thus enabling mapping of small sample areas with thin-film sensitivity. The ellipsometer, equipped with a HeNe laser emitting at about 2949 cm−1, was applied for the optical characterization of inhomogeneous poly(3-hexylthiophene) [P3HT] and poly(N-isopropylacrylamide) [PNIPAAm] organic thin films used for opto-electronics and bioapplications. With the constant development of tunable IR laser sources, laser-based infrared ellipsometry is a promising technique for fast in-depth mapping characterization of thin films and blends.
1 Introduction
Thin organic films or hybrid films and related interfaces are playing important roles in optical devices, solar cells, as well as biomedical and sensor applications.1–6 In order to characterize thin films, film properties like inhomogeneity, chemical composition, crystallinity, surface morphology, and optical properties must be analyzed, the knowledge of which is required for the successful design and improvement of the respective device or surface.Various characterization techniques exist for organic films and surfaces, such as X-ray photoelectron spectroscopy, atomic force microscopy, X-ray diffraction, FT-IR, Raman spectroscopy, and ellipsometry in the ultraviolet–visible (UV–Vis) and IR range.7–11 Among these methods, IR-spectroscopic ellipsometry is a well-established non-contact and non-destructive method that allows for quantification of the optical film properties, which are related to thickness, chemistry, and structure.12–15
In our thin-film (i.e., monolayer) sensitive laboratory-based far-field IR ellipsometers, the size of the probed spot on the sample surface is typically a few ten mm2 at 65° incidence angle. The need to characterize sample areas with a higher lateral resolution calls for improving the optical set-up, without compromising the sensitivity. Possible technical solutions for better lateral resolution are employing a brilliant light source, such as a laser or synchrotron, or using an IR microscope.16–18 At the IRIS beamline at BESSY, for instance, a lateral resolution of 245 × 175 μm2 was reached at 65° incidence angle.19 IR microscopy with thin-film sensitivity18 was shown to be possible with spot sizes as small as 40 × 40 μm2 at a mean incidence angle of 16° defined by the microscope's Cassegrain objective. Beyond far-field spectroscopic techniques, near-field infrared microscopy20,21 might be used for studying chemical composition and molecular interactions at lateral resolutions in the nm range. Recently, synchrotron IR nanoscopy was demonstrated.22
For conventional FT-IR ellipsometry,12,23 the minimum measurement time per spot of a map is limited mainly by the time needed for moving internal mirrors in the interferometer, the time for moving external optical devices, such as polarizers, as well as the brilliance of the globar radiation. At 4 cm−1 resolution, thin-film sensitive single-spot ellipsometric measurements of organic films take at least 20 s,24 which is much too slow for mapping a larger number of spots.
In this work, an IR laser mapping ellipsometer was designed and developed, making use of a HeNe laser as a brilliant single-wavelength light source. The HeNe laser line at 2949 cm−1 was chosen because of its overlap with vibrational CH3 and CH2 bands of the studied thin-film polymer materials. Depending on the chemical composition of the films, other lasers might be considered that excite, for instance, characteristic C![[double bond, length as m-dash]](https://www.rsc.org/images/entities/char_e001.gif) O- or C
O- or C![[triple bond, length as m-dash]](https://www.rsc.org/images/entities/char_e002.gif) N-stretching modes. This increases the sensitivity of the ellipsometer, but can also provide deeper insights into film structure, anisotropy, and interactions.
N-stretching modes. This increases the sensitivity of the ellipsometer, but can also provide deeper insights into film structure, anisotropy, and interactions.
We applied the IR laser ellipsometer for the optical characterization of spin-coated polymer films, namely P3HT, a conducting polymer in opto-electronic devices,3 and PNIPAAm, a temperature-sensitive polymer with potential applications in the fields of biosensors6 and biomedicine.5,25,26 For materials with known refractive indices, our results show that the single-wavelength IR laser mapping ellipsometer is able to characterize inhomogeneities in thickness and/or chemical composition in small spatial domains with diameters as small as 120 μm in very short time scales.
2 Experimental set-up
Ellipsometry9,12,15,23 measures the change in polarization state of (linearly polarized) light upon interaction with a sample. For isotropic samples, this is expressed by the ratio of the complex reflection coefficients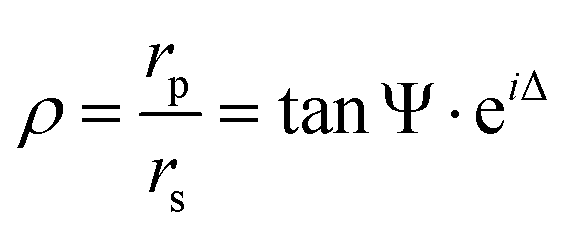 | (1) |
![[thin space (1/6-em)]](https://www.rsc.org/images/entities/char_2009.gif) Ψ and Δ respectively constitute the measured amplitude ratio and phase difference, both of which are related to the actual film properties. These properties, including film thickness and chemistry, are then determined by fitting simulated Ψ and Δ to the measured ones based on an optical model of the sample.
Ψ and Δ respectively constitute the measured amplitude ratio and phase difference, both of which are related to the actual film properties. These properties, including film thickness and chemistry, are then determined by fitting simulated Ψ and Δ to the measured ones based on an optical model of the sample.
Fig. 1 shows a schematic set-up of the developed multiple-angle rotating analyzer IR mapping ellipsometer. The ellipsometer is equipped with a HeNe laser (Multi IR Optoelectronics CO., Ltd) as light source, emitting at a wavelength of 3.39 μm (2949 cm−1), and an InAs detector with a detector area of 1 mm2. Samples can be measured under incidence angles between φ0 = 40° and 90°. Optional CaF2 micro focus lenses (acceptance angle = 2°) inserted in the optical train enable measurements with increased lateral resolution. A MgF2 zero-order retarder is used for accurate phase measurements Δ. An XY table is employed for mapping over a maximum sample area of 25 × 25 mm2.
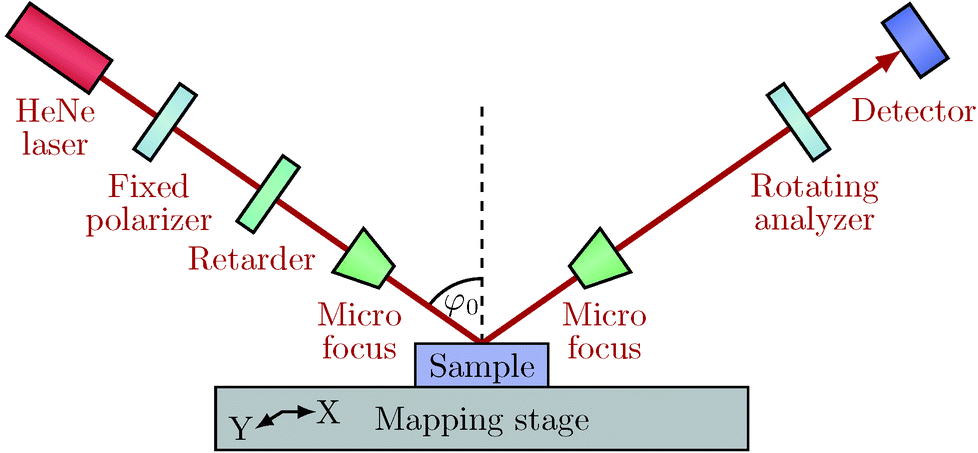 | ||
| Fig. 1 Schematic of the IR laser mapping rotating analyzer ellipsometer with variable incidence angle and optional micro focus lenses for increased lateral resolution. | ||
The measurement time of a single spot without averaging is 0.08 s without retarder. Positioning of and measuring with retarder requires additional 0.37 s + 0.08 s = 0.45 s. When averaging 10 repeated measurements with retarder, a total measurement time of 1.97 s per spot is required. In this case, the error in Δ is Δerr = ±0.4°, leading to a film-thickness sensitivity of about derr = ±1 nm for typical organic films with refractive indices around n = 1.5. The error in Ψ is Ψerr = ±0.04°.
Measurement times are also affected by the movement of the XY mapping table, which lasts 80 ms/100 μm. As a numerical example, mapping Ψ and Δ of 50 × 50 = 2500 spots in 100 μm steps takes approximately 85 min with retarder. However, full Δ maps are only necessary if cosΔ ≈ ±1 or if the phase is to be determined unambiguously between 0° and 360°. Otherwise, it is sufficient to map only Ψ and cosΔ without retarder, which is possible in about 7 min for 2500 spots.
We used the IR laser ellipsometer for mapping P3HT and PNIPAAm films prepared by spin-coating onto silicon (100) wafers with native oxide layer or onto gold substrates, respectively. Pre-characterization of the films was performed with UV–Vis ellipsometry (SE850, Sentech GmbH) to obtain average thicknesses at 5 × 2 mm2 spot size and with atomic force microscopy (XE100, Park Systems) to measure the film homogeneity on a sub-micrometer scale. With dP3HT = 57 nm and a surface roughness of Rrms = 3.7 nm, the P3HT film is microscopically more inhomogeneous than the PNIPAAm film with dPNIPAAm = 98 nm and Rrms = 1.1 nm. Compared to the probing wavelength in the mid-infrared, the surface roughnesses are small enough, though, that IR-ellipsometric data can be modeled with a single layer.
Standard IR-spectroscopic ellipsometry13,27 was employed to determine the macroscopic optical properties of the films. The refractive index n and the absorption coefficient k were fitted by minimizing the reduced χ2 of measured and simulated Ψ and Δ spectra8 at multiple incidence angles based on the optical layer model8,9 “Substrate/Film/Air”, in which the film dielectric functions ε = (n + ik)2 were modeled as sums of Lorentzian oscillators corresponding to the vibrational modes of the polymers.27
Ellipsometric IR laser mapping of the films was then carried out under an incidence angle of 65° without and with micro focus lenses. We mapped in XY steps of 0.5 mm, resulting in laterally non-overlapping, i.e., separated, measurement spots when using the micro focus. Film thicknesses for each spot of the maps were determined from Ψ and Δ using the same optical layer model “Substrate/Film/Air”, based on the previously determined film optical constants n and k.
3 Results and discussion
3.1 Lateral resolution
In order to determine the lateral resolution of the IR laser ellipsometer, we performed linescans without and with micro focus at 65° incidence angle over the edge between a 400 nm thick silicon-oxide film and silicon with native oxide layer (Fig. 2). Without micro focus lenses, the spot size is X × Y = 6.0 × 2.6 mm2. With micro focus, we achieve a lateral resolution of 250 × 120 μm2.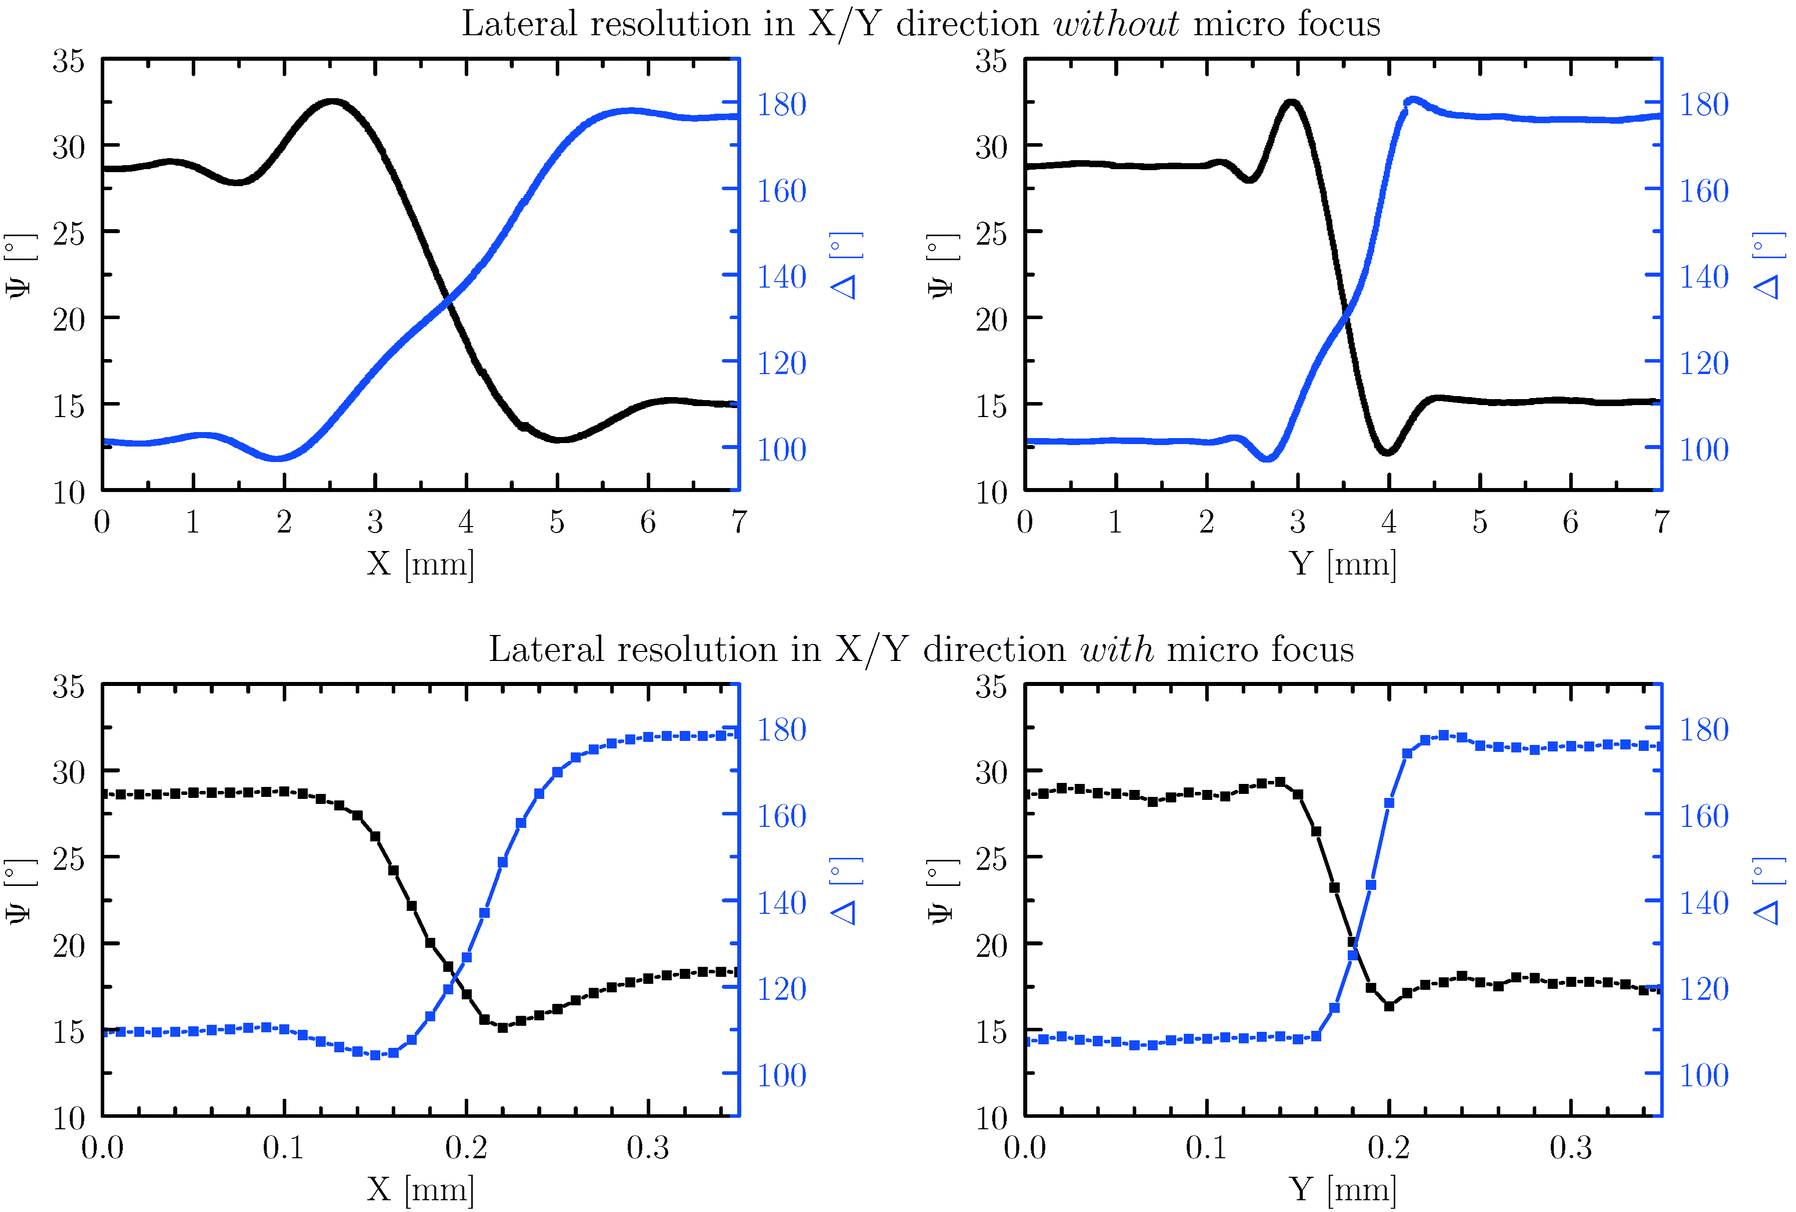 | ||
| Fig. 2 Lateral resolution of the IR laser mapping ellipsometer in X and Y direction. Ψ and Δ linescans without (top) and with (bottom) CaF2 micro focus lenses were obtained at 65° incidence angle on a Si wafer across the edge between a 400 nm thick SiO2 layer and the native 2 nm thick oxide layer. The film thickness calculated far off the edge is dIR = (398.0 ± 2.0) nm, which compares well to dVIS = (399.80 ± 0.02) nm measured with VIS ellipsometry. | ||
Inserting the micro focus lenses causes small incidence-angle deviations of up to ±2°. Those deviations are accounted for by a calibration measurement of φ0 using a known sample.
The high lateral resolution, combined with the fact that the laser excites vibrational resonances in the ν(CHx) region, renders the IR laser mapping ellipsometer extremely sensitive towards measuring organic thin films or CHx contaminations on the sample surface.
3.2 Optical constants
Fig. 3 shows the optical constants n and k of spin-coated P3HT and PNIPAAm films in the characteristic spectral range for stretching vibrations ν(CH3) and ν(CH2), as determined with standard IR-spectroscopic ellipsometry. With regard to the mapping ellipsometer, the P3HT optical constants at the HeNe laser wavelength of 2949 cm−1 are n = 1.586 ± 0.005 and k = 0.077 ± 0.005, and those of PNIPAAm are n = 1.4881 ± 0.0005 and k = 0.0321 ± 0.0005. The uncertainties reflect the errors of the film oscillator parameters due to variations of layer thickness and incidence angle within the probed spot. The different uncertainties in the measurements of P3HT and PNIPAAm hint at differences in film homogeneity at a sub-millimeter scale, as previously indicated by surface-roughness measurements.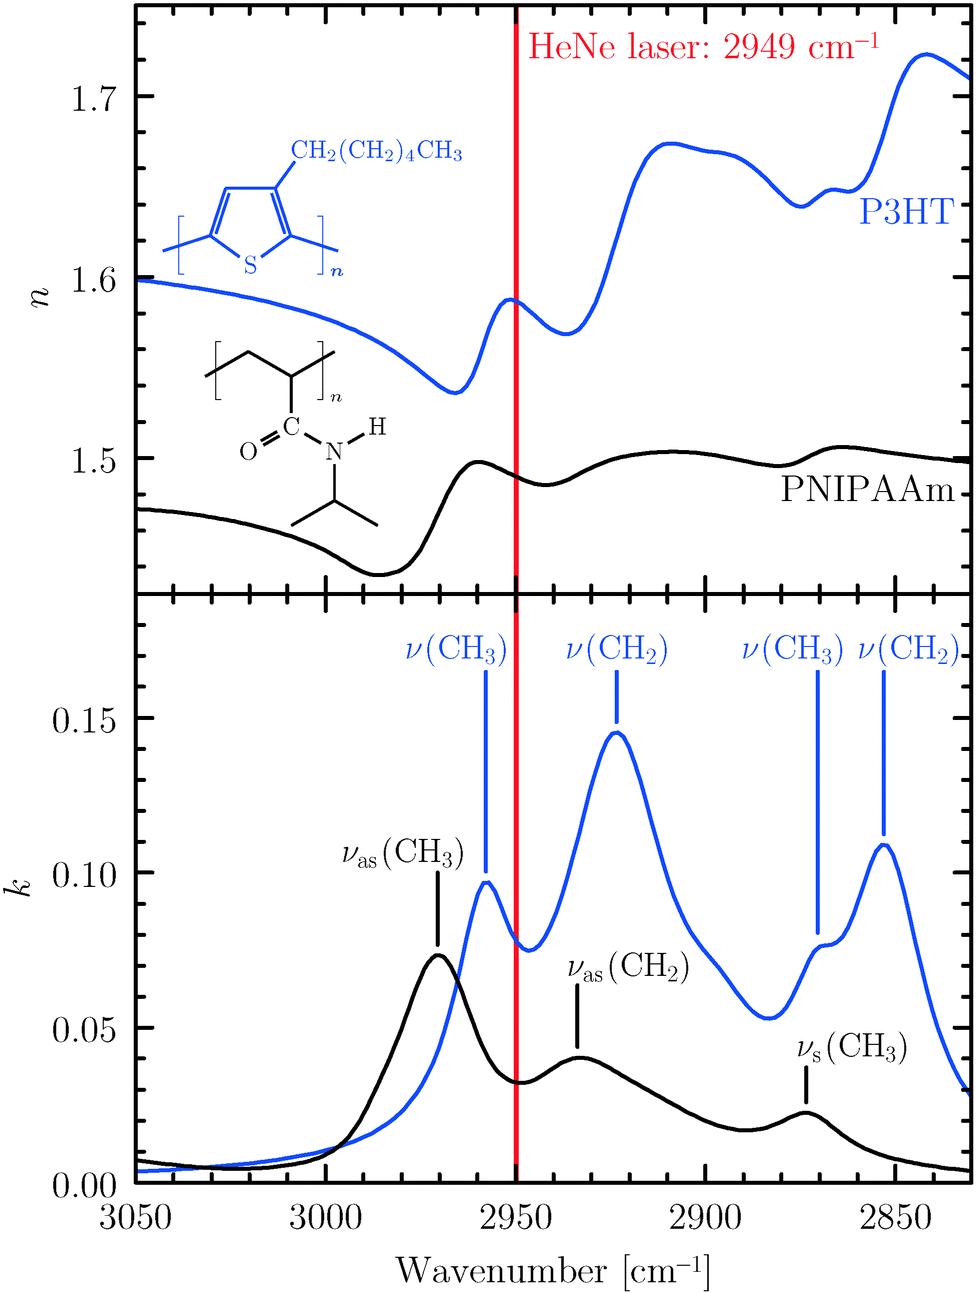 | ||
| Fig. 3 Optical constants n and k of spin-coated P3HT and PNIPAAm films in the vicinity of the HeNe laser wavelength at 2949 cm−1, determined with IR-spectroscopic ellipsometry. | ||
Ellipsometric measurements are very sensitive to film-thickness inhomogeneities via the phase Δ. Moreover, the infrared range is sensitive towards film chemistry via the vibrational modes of the polymer films, the corresponding signatures of which are predominantly observed in the ellipsometric angle Ψ and can be used to study material- and structure-dependent film properties.
3.3 Homogeneous and inhomogeneous PNIPAAm films
The maps in Fig. 4 show a partly homogeneous spin-coated PNIPAAm film that was modified by pipetting three drops of water onto different parts of the film. Since the film was not covalently bonded to the substrate, three inhomogeneous “polymer islands” formed upon evaporation of the water drops. Because the orientation of PNIPAAm's isopropyl groups is expected to be randomly distributed, film thicknesses were fitted from Ψ and Δ maps using fixed n and k values from Fig. 3.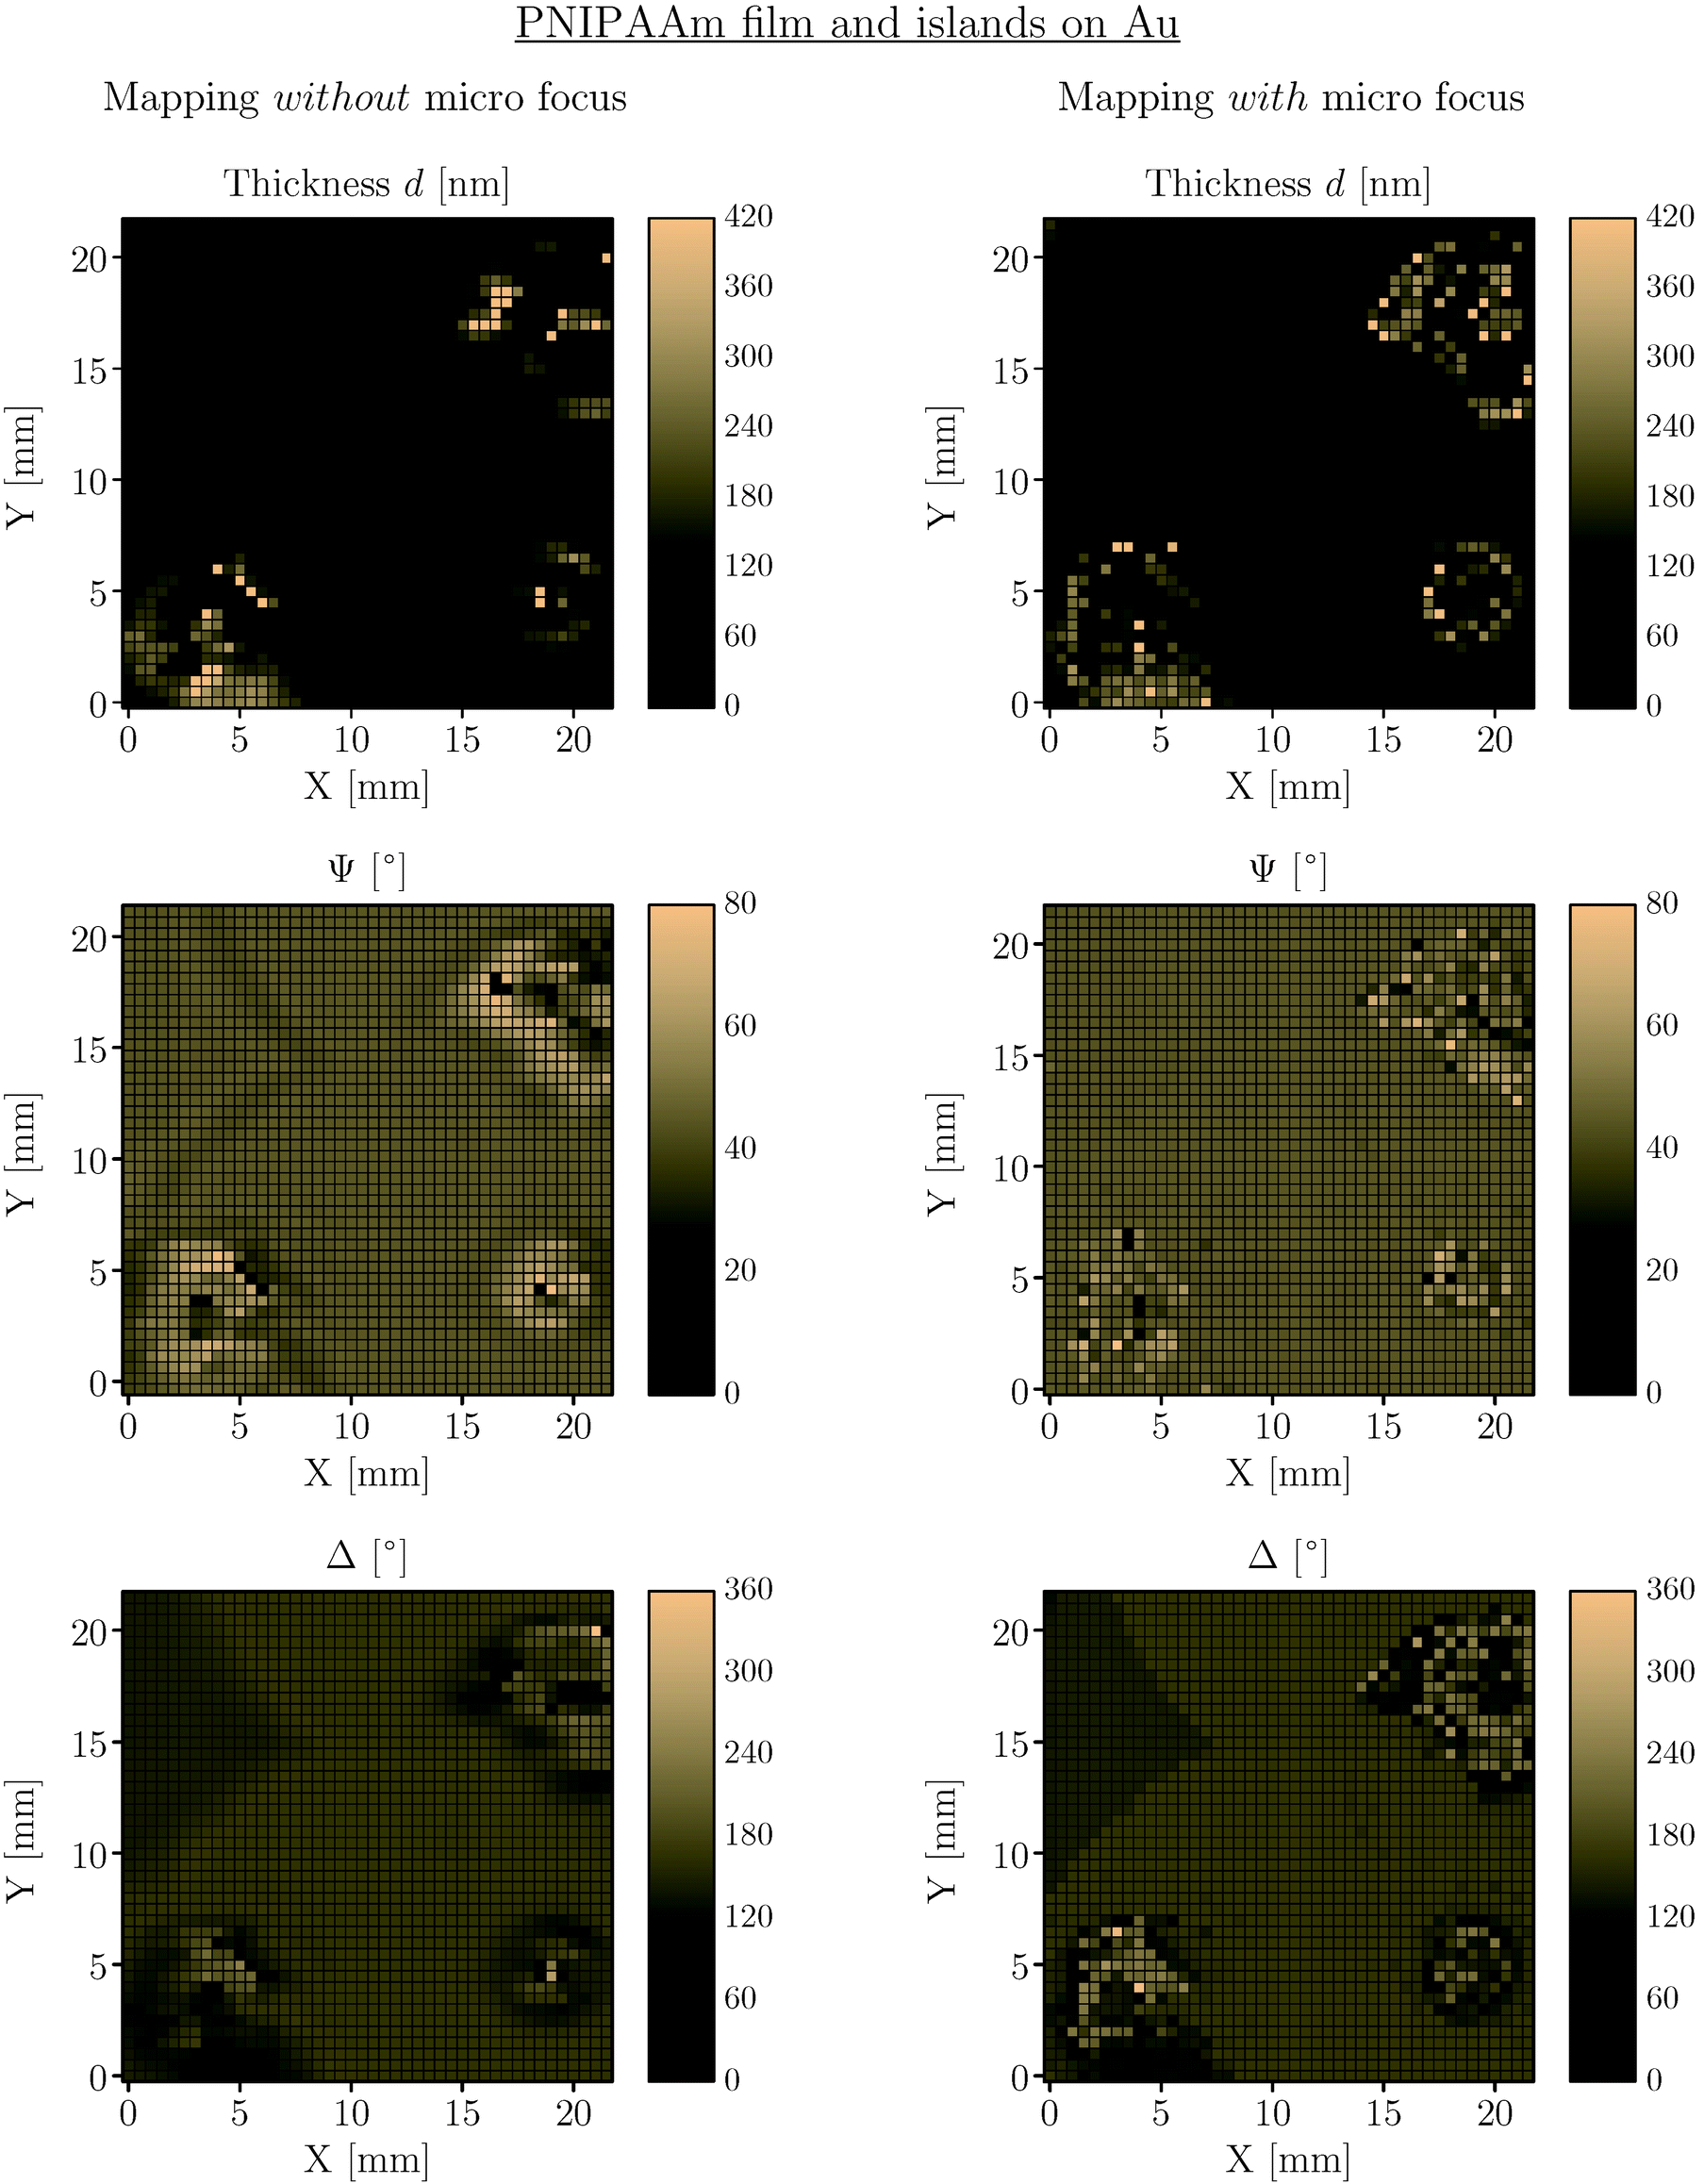 | ||
| Fig. 4 Thickness, Ψ, and Δ maps of a partly homogeneously and partly inhomogeneously PNIPAAm-covered gold substrate, measured at 65° incidence angle. Homogeneously covered parts (upper-left areas) and three inhomogeneously covered “polymer islands” are well distinguishable in the micro-focus maps. Ψ and Δ were mapped in 6 min and 59 min, respectively. | ||
Due to the insufficient lateral resolution of a few mm without micro focus lenses, artifacts in thickness, Ψ, and Δ are observed at the film edge of the homogeneously covered areas, similar to the linescans in Fig. 2. Such artifacts are also present in standard FT-IR ellipsometry. When using the micro focus with a lateral resolution of 250 μm (120 μm), on the other hand, a clear correlation is found in Fig. 4 between thickness, Ψ, and Δ. The maps reveal film inhomogeneities within the polymer islands ranging between 0 and 416 nm. The homogeneously covered part in the upper-left corner of the sample shows thickness variations between 92 and 98 nm.
We emphasize that the 44 × 44 = 1936 measured spots were mapped in 6 min for Ψ and cosΔ plus additional 59 min with retarder for the absolute phase Δ. If the measurements of Ψ and cosΔ are restricted to a single spot on the sample, the IR laser ellipsometer is fast enough for studying kinetic processes with millisecond time resolution. This is particularly interesting for PNIPAAm and other stimuli-responsive polymers. PNIPAAm, for example, contains CO and N–H groups that are intrinsically involved in a temperature-dependent coil-to-globule phase transition of the polymer in water.28 IR laser ellipsometry in the ν(CO) or δ(N–H) range would then be capable of providing direct insights into the nature of the polymer's switching behavior.
3.4 Inhomogeneous P3HT films
P3HT is a conducting polymer widely used in opto-electronic devices.3 For these it is of high interest to know the variation in film thickness, since pinholes or very thin parts of the layer29,30 lead to shunts or create shunts due to local inhomogeneous current transport and local heating. Such defects also have a potential impact on the films’ local complex refractive index, which can be resolved by spectral ellipsometric measurements. In the following single-wavelength maps, a fit was performed with fixed optical constants from Fig. 3. Therefore, only pseudo-thicknesses can be determined. The resulting maps, however, are a good quantitative indicator for the overall film homogeneity.Fig. 5 shows ellipsometric maps of a spin-coated P3HT film on silicon (100). Film inhomogeneities in different domains can be identified clearly. Close to the substrate edges, the spin-coating process results in thicknesses larger than 110 nm, marked in grey in the maps. Within the center of the film, smaller thicknesses with variations between 50 and 80 nm are observed, the average value of which is in agreement with IR-spectroscopic ellipsometry and UV–Vis ellipsometry (daverage = 57 nm). Macroscopic ellipsometry with a spot size of a few mm2 averages over the inhomogeneous areas. This causes phase decorrelations in Δ and explains why the previously stated uncertainties in n and k of P3HT are one order of magnitude larger compared to those of the more homogeneous PNIPAAm film.
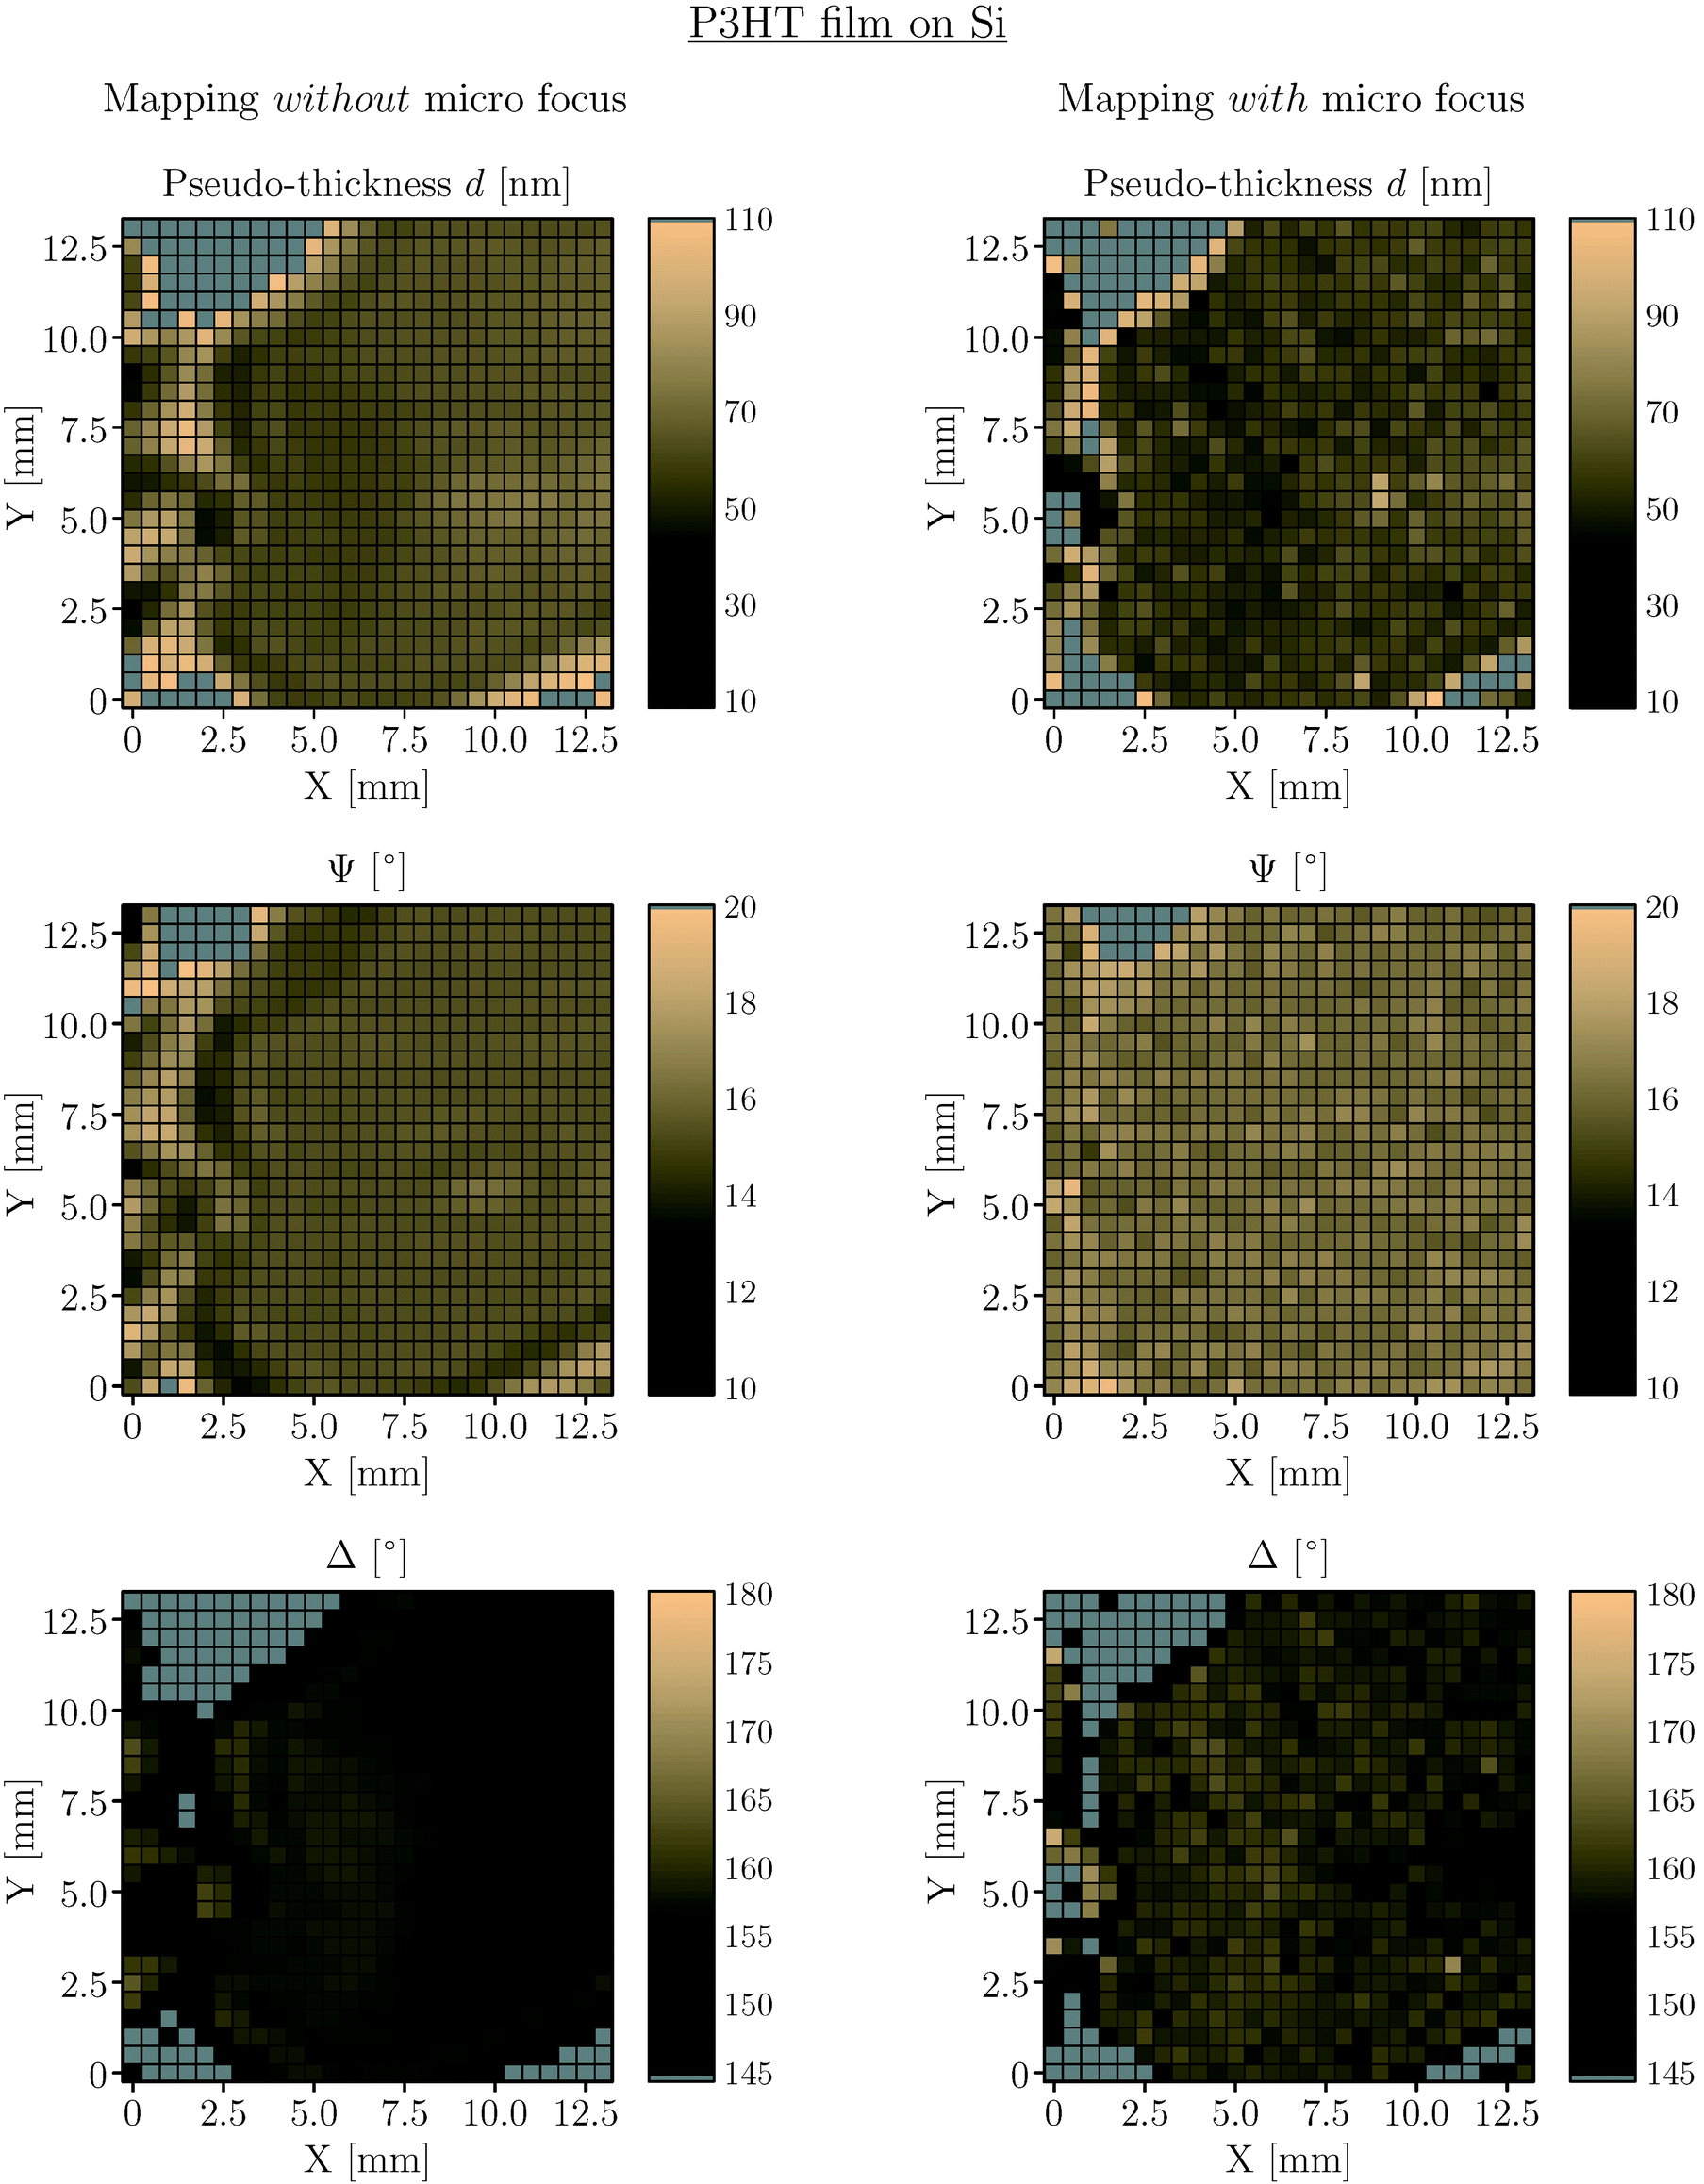 | ||
| Fig. 5 Thickness, Ψ, and Δ maps of a spin-coated P3HT film, measured at 65° incidence angle. The 729 points were mapped in approximately 50 min. Areas with film thicknesses > 110 nm, Ψ > 20°, and Δ < 145° are marked in grey, in order to better visualize the clear correlation between Δ and thickness. Ψ and Δ were mapped in 2 min and 23 min, respectively. | ||
Note that the 27 × 27 = 729 spots were mapped in 2 min for Ψ and cosΔ plus additional 23 min with retarder for the absolute phase Δ. Being able to map organic thin films on this short time scale is highly relevant for process control applications.
A more detailed film analysis will depend on the type of laser. Choosing a specific laser line allows one to analyze characteristic vibrational bands or—if a tunable laser is used—certain spectral ranges that either depend only on the optical thickness9n∞·d or on amplitude and shape of a specific vibrational band. The correlation between Ψ and Δ spectra would then enable one to identify and distinguish film-thickness and structural inhomogeneities. Optical simulations of multiple-angle measurements and maps would allow one to simultaneously quantify layer thicknesses, optical constants n and k, as well as average molecular orientations.
4 Conclusions
In this work, a new laboratory-based IR laser ellipsometer was applied for thin-film sensitive measurements with unprecedented lateral resolutions of 120 μm and time resolutions down to 80 ms. Before, such lateral resolutions were only possible by making use of non-laboratory-based light sources, such as a synchrotron, or with laboratory-based FT-IR microscopy. With these techniques, however, measurement times with monolayer sensitivity were about 100 times longer.We used the IR laser mapping set-up to study the homogeneity of spin-coated PNIPAAm and P3HT thin films, which showed thickness variations in the 10-nanometer range. For the first time, fast and laterally resolved ellipsometric inhomogeneity characterizations of such organic functional thin films are now possible in the infrared with a laboratory set-up. We suppose this novel technique can be used to characterize the IR optical properties of inhomogeneous organic bulk and thin-film materials highly relevant, for instance, as energy-related materials, functional thin films, and biomaterials.
The fast measurement times at a single wavelength are vitally important for mapping studies. They also open up new possibilities in monolayer-sensitive time-resolved studies of growth, adsorption, and other kinetic processes. Extension to tunable light sources, such as quantum cascade lasers, will even enable one to perform spectral studies or to extent the analysis to other distinctive vibrational bands in the mid-IR range. Multi-wavelength mapping will allow the study of anisotropy effects and interactions.
Acknowledgements
We thank Ilona Engler and Özgür Savaş for technical assistance, as well as Sebastian Rauch from the Leibniz-Institut für Polymerforschung Dresden e. V. for preparation of the PNIPAAm test sample. Financial support of the European Union through the Pro FIT program (contract no. 10153595) and the Senatsverwaltung für Wirtschaft, Technologie und Forschung des Landes Berlin und Bundesministerium für Bildung und Forschung is gratefully acknowledged.Notes and references
- H. E. Katz and J. Huang, Annu. Rev. Mater. Res., 2009, 39, 71–92 CrossRef CAS.
- T. Boudou, T. Crouzier, K. Ren, G. Blin and C. Picart, Adv. Mater., 2010, 22, 441–467 CrossRef CAS PubMed.
- W. Hu, F. Bai, X. Gong, X. Zhan, H. Fu and T. Bjornholm, Organic Optoelectronics, Wiley-VCH, Weinheim, 2013 Search PubMed.
- D. Wang, T. Zhao, X. Zhu, D. Yan and W. Wang, Chem. Soc. Rev., 2014 10.1039/C4CS00229F , Advance Article.
- M. Yamato, Y. Akiyama, J. Kobayashi, J. Yang, A. Kikuchi and T. Okano, Prog. Polym. Sci., 2007, 32, 1123–1133 CrossRef CAS.
- M. R. Islam, A. Ahiabu and M. J. Serpe, Sensors, 2014, 14, 8984–8995 CrossRef CAS PubMed.
- H. S. Nalwa, Handbook of Thin Films, Vol. 2: Characterization and spectroscopy of thin films, Academic Press, Burlington, 2002 Search PubMed.
- H. G. Tompkins and E. A. Irene, Handbook of Ellipsometry, William Andrew, Inc., Norwich, 2005 Search PubMed.
- H. Fujiwara, Spectroscopic Ellipsometry: Principles and Applications, John Wiley & Sons, Ltd, Chichester, 2007 Search PubMed.
- J. Heinze, B. A. Frontana-Uribe and S. Ludwigs, Chem. Rev., 2010, 110, 4724–4771 CrossRef CAS PubMed.
- G. Friedbacher and H. Bubert, Surface and Thin Film Analysis: A Compendium of Principles, Instrumentation, and Applications, Wiley-VCH, Weinheim, 2011 Search PubMed.
- A. Röseler, Infrared Spectroscopic Ellipsometry, Akademie-Verlag, Berlin, 1990 Search PubMed.
- E.-H. Korte and A. Röseler, Analyst, 1998, 123, 647–651 RSC.
- M. Schubert, C. Bundesmann, G. Jakopic, H. Maresch, N.-C. Arwin, H. Persson, F. Zhang and O. Inganäs, Thin Solid Films, 2004, 455–456, 295–300 CrossRef CAS.
- K. Hinrichs and K.-J. Eichhorn, Ellipsometry of Functional Organic Surfaces and Films, Springer, Berlin, 2014 Search PubMed.
- M. C. Martin, U. Schade, P. Lerch and P. Dumas, Trends Anal. Chem., 2010, 29, 453–463 CrossRef CAS.
- H.-Y. N. Holman, H. A. Bechtel, Z. Hao and M. C. Martin, Anal. Chem., 2010, 82, 8757–8765 CrossRef CAS PubMed.
- K. Hinrichs, A. Furchner, J. Rappich and T. W. H. Oates, J. Phys. Chem. C, 2013, 117, 13557–13563 CAS.
- J. W. Weber, K. Hinrichs, M. Gensch, M. C. M. van de Sanden and T. W. H. Oates, Appl. Phys. Lett., 2011, 99, 061909 CrossRef.
- A. A. Govyadinov, I. Amenabar, F. Huth, P. S. Carney and R. Hillenbrand, J. Phys. Chem. Lett., 2013, 4, 1526–1531 CrossRef CAS PubMed.
- B. Pollard, E. A. Muller, K. Hinrichs and M. B. Raschke, Nat. Commun., 2014, 5, 3587 Search PubMed.
- H. A. Bechtel, E. A. Muller, R. L. Olmon, M. C. Martin and M. B. Raschke, Proc. Natl. Acad. Sci. U. S. A., 2014, 111, 7191–7196 CrossRef CAS PubMed.
- A. Röseler, in Spectroscopic Infrared Ellipsometry, ed. H. G. Tompkins and E. A. Irene, William Andrew, Inc., Norwich, 2005 Search PubMed.
- J. Rappich and K. Hinrichs, Electrochem. Commun., 2009, 11, 2316–2319 CrossRef CAS.
- B. D. Ratner and S. J. Bryant, Annu. Rev. Biomed. Eng., 2004, 6, 41–75 CrossRef CAS PubMed.
- N. Joseph, T. Prasad, V. Raj, P. R. A. Kumar, K. Sreenivasan and T. V. Kumary, J. Bioact. Compat. Polym., 2010, 25, 58–74 CrossRef CAS.
- K. Hinrichs, D. Tsankov, E.-H. Korte, A. Röseler, K. Sahre and K.-J. Eichhorn, Appl. Spectrosc., 2002, 56, 737–743 CrossRef CAS.
- Y. Maeda, T. Higuchi and I. Ikeda, Langmuir, 2000, 16, 7503–7509 CrossRef CAS.
- C.-Y. Li, T.-C. Wen, T.-H. Lee, T.-F. Guo, J.-C.-A. Huang, Y.-C. Lin and Y.-J. Hsu, J. Mater. Chem., 2009, 19, 1643–1647 RSC.
- J. Kettle, S. Whitelegg, A. M. Song, D. C. Wedge, L. Kotacka, V. Kolarik, M. B. Madec, S. G. Yeates and M. L. Turner, Nanotechnology, 2010, 21, 075301 CrossRef CAS PubMed.
| This journal is © The Royal Society of Chemistry 2015 |