DOI:
10.1039/C5RA13864G
(Paper)
RSC Adv., 2015,
5, 82535-82543
The effect of hard block content on the orientation and mechanical properties of olefin block copolymer films as obtained via melt stretching†
Received
14th July 2015
, Accepted 14th September 2015
First published on 14th September 2015
Abstract
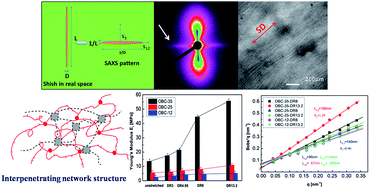
In this study, the orientation, structure and mechanical performance of a series of uniaxially oriented films based on olefin block copolymers (OBC) have been investigated in terms of the differences in hard block content and draw ratio (DR). Three OBCs with different hard block contents of 35 wt%, 25 wt% and 12 wt% were used. For un-stretched films, a change from close-packed spherulites into tiny crystallites is observed with decreasing hard block content, accompanied by an almost linear decrease in crystallinity. However, the change in mechanical properties does not follow the same path, with obviously higher tensile strength and modulus for OBC-35, but a lower and almost the same tensile strength and modulus for OBC-25 and OBC-12, in spite of the big difference in hard block content and crystallinity between them. For melt-stretched films, the degree of orientation of the amorphous phase is almost the same and slightly increases with the increase in the draw ratio for the three OBCs, disregarding their hard block contents. Crystalline orientation and shish content are much higher for OBC-35, and an obvious increase is seen as the draw ratio increases from 4.95 to 8, corresponding to the sharp increase in Young's modulus and stress. For OBC-25 and OBC-12, similar crystalline orientation and shish content are seen, which increase linearly with draw ratio and are consistent with the linear increase in modulus and stress as the draw ratio increases. Our study demonstrates the importance of the hard block content of OBC to determine the mechanical properties and the response to external stretching. A critical hard block content exists (in this case 35 wt%), above which a strong network is constructed by the hard block crystalline phase, resulting in a higher tensile strength and modulus. This strong network is destroyed as the draw ratio reaches a certain value (herein, 4.95 to 8), leading to an obvious increase in crystalline orientation, as well as a sharp increase in tensile strength and modulus. When the hard block is below the critical content (herein, 25 wt% and 12 wt%), the network constructed by the hard block is weak and less dependent on its content.
1. Introduction
Recent innovation in catalyst technology by the Dow Company has led to the synthesis of novel polyolefin-based block copolymers (OBC) using a chain shuttling technology.1–3 This synthesis approach uses two different catalysts with different monomer selectivity. A chain shuttling agent was also used to reversibly transfer the growing chains between two catalysts.4–6 Due to the chain shuttling agents, different types of catalyst sites result in the production of linear multiblock copolymers with alternating hard and soft blocks. As a result, OBC is composed of hard blocks with low 1-octene content and soft blocks with high 1-octene content. As shown in Scheme 1, the novel olefin block copolymer (OBC, INFUSE) consists of crystallisable ethylene–octene blocks with low comonomer content (hard segments), alternating with amorphous blocks with high comonomer content (soft segments). Due to the specialty of the chain shuttling method, the hard block length and the number of blocks per chain generally follow the most-probable distribution. Since OBC is a type of crystalline multiblock copolymer, the solidification process is driven by mesophase separation in the melt and crystallization. The term “mesophase separation” is used for OBCs instead of “microphase separation”, mainly because of the large domain size, which is often larger than 100 nm. It has been reported that the segregation strength of OBCs is strongly dependent on the difference in the 1-octene content of the hard and soft blocks (ΔC8).7 In strongly melt separated OBCs, lamellar stacks can be confined within isolated domains, whereas ethylene crystallization can break out from the domains in a weakly separated system.
|
| Scheme 1 The molecular architecture of the olefin block copolymer (OBC) and the corresponding monomers. | |
OBCs are generally used as novel thermoplastic elastomers (TPEs) due to their profound chemical inertness, low density, low cost, elastic properties, and easy processability.7,8 Hence, OBCs have extensive applications such as toughening agents,9 adhesives,10 damping devices,11 packaging, hygienic products and elastic films.12 It has been reported that well-developed spherulites can be formed in OBCs, even if the crystallinity is as low as 7%,13 and the structures and properties of isotropic films of OBCs with different block architectures have been investigated. For example, OBCs with different block architectures during uniaxial deformation were investigated and it was found that longer but fewer hard blocks in the OBCs resulted in fewer folded-chain lamellar crystals, a less effective network and an easier break, especially at high temperatures.14 Zuo et al. also investigated the structure evolution during deformation of OBCs at room temperature and compared it with olefin random copolymers (ORC); it was found that high 1-octene comonomers in soft blocks and low density of non-crystallizable blocks could lead to a less effective network, although they possess similar ethylene–octene composition and overall density.15 Furthermore, the structure and properties of OBCs can also be influenced by external fields such as processing temperature and shear flow. It was reported that the properties are better when processed at temperatures higher than the mesophase separation temperature (TMST).16 From the viewpoint of optimization of properties, there have been reports on enhanced mechanical strength via blending,17 fiber reinforcing18–20 and filler reinforcing.21,22 However, these approaches can inevitably cause a significant loss of elasticity.
It is well known that the orientation of the polymers is responsible for the enhancement of properties. Melt stretching is an effective way to induce chain extension and enhance molecular orientation, thus improving the mechanical properties of polyolefins.23,24 Chatterjee et al. reported excellent barrier and optical properties for blown high-density polyethylene (HDPE) films with optimized draw ratios to achieve special lamellar organization as well as orientation of the amorphous phase.25 For some highly-oriented polyolefin systems, it was also reported that stretching can even induce an increased crystallinity and melting temperature.26,27 Meng et al. investigated the stretching induced crystallization behaviour of PE and found that the crystal structures were strongly dependent on the strain and stretching mode.28 For linear low-density polyethylene (LLDPE), a three-phase model was applied and it was found that the intermediate phase, including gauche and trans segments, which are related to the tie molecules linking between the crystallites, was sensitive to the cold-draw ratio while the amounts of both crystal and amorphous phases remained constant.29 When LLDPE was biaxially oriented, a typical biaxial lamellar structure emerged along with the enhanced c-axis orientation of the crystalline phase under an increased draw ratio.30
The OBC system is a type of thermoplastic elastomer and the crystals can form a network and play a role of physical crosslinks embedded in an amorphous network. Since the hard blocks can crystallize and the soft blocks remain as the amorphous phase during processing of OBCs, the contents of the hard blocks will determine the crystallinity, thus the amount of “physical crosslinks”. Higher crystallinity means a greater possibility for lamellar coupling and thus the formation of a crystal network. As a result, the tensile strength and modulus will be largely determined by the content of the hard blocks. It is logical to ask whether a critical content exists, above which OBCs have better mechanical properties or if the crystallinity is the only factor to determine the mechanical properties; how the structure of the “physical crosslinking” network constructed by hard blocks affects the mechanical properties and how it responds to external stretching. To answer these questions, in this study, melt drawn films of three OBCs with different hard block contents were prepared and the effects of the hard block content on crystallinity, molecular orientation and mechanical performance of OBCs were investigated. Our goal is to better understand the structure–property relationships and improve the mechanical properties of OBC films via melt stretching.
2. Experimental
2.1. Materials and preparation
OBCs with three different hard block contents were purchased from DOW Chemical Company. The sample information is listed in Table 1. OBC materials with 35 wt%, 25 wt% and 12 wt% hard segments were named OBC-35, OBC-25, and OBC-12, respectively. The difference in 1-octene (ΔC8) between the hard segments and soft segments can reflect the degree of mesophase separation. The values of ΔC8 for all OBC materials are close.
Table 1 The molecular parameters of olefin block copolymers provided by DOW Company
Sample name |
Hard segment [wt%] |
Overall C8 [wt%] |
C8 in hard segment [mol%] |
ΔC8 [mol%] |
M
w [kg mol−1] |
Density [g cm−3] |
OBC-35 |
35 |
9.6 |
2.1 |
15.0 |
78640 |
0.887 |
OBC-25 |
25 |
12.0 |
1.8 |
15.0 |
82600 |
0.877 |
OBC-12 |
12 |
14.0 |
1.4 |
16.4 |
69150 |
0.886 |
The polymer films were prepared by cast extrusion followed by melt stretching, as illustrated in Fig. 1. During extrusion, the temperature was set at 160 °C, 185 °C, and 190 °C from the hopper to the slit die. The screw speed was set at a constant value of 50 rpm and the thickness of the slit die was set at 1 mm. The stretched films were cooled by air and the draw ratio (DR) was calculated by multiplying two effects (DR = λC). The first is the stretching effect (λ), which can be quantified by the ratio of take-up speed (vt) and extrusion speed (vi). The other is the compression effect (C), which can be calculated by the ratio of the thickness of slit die (hi) and the roll-to-roll distance (ht). A series of films with various DRs were thus prepared through changing the take-up speed and roll-to-roll distance. In this study, OBC films with four representative draw ratios (DR3, DR4.95, DR8, and DR13.2) were selected for detailed analysis. All the samples were named OBC-X-Dry, wherein X represents the hard block content and y represents the value of the draw ratio. For example, OBC-25-DR8 means films with the draw ratio of 8 for OBC with 25 wt% hard block content. For comparison, compression-moulded OBC films were also prepared at 190 °C followed by air cooling to room temperature and served as the un-stretched or isotropic samples.
|
| Fig. 1 Schematic profile of the melt-stretching apparatus with single-screw extruder and two reversing rotational casting rolls observed from both top view and side view. | |
2.2. Testing and characterization
A Perkin-Elmer diamond-II differential scanning calorimeter (DSC) was used to determine the crystallization and melting behaviours of OBC materials. The non-isothermal crystallization and the melting behaviours were tested at a rate of 10 °C min−1 under a nitrogen atmosphere.
Polarizing optical microscopy was performed using a Leica DMIP machine under crossed polarizer. Thin slices were cut from the films parallel to the stretching direction using a Leica EMUC6/FC6 microtome at −100 °C.
Ultrathin sections of ca. 100 nm thickness were obtained by cryo-microtome along the stretching direction (SD) of the films using a Leica EMUC6/FC6 microtome at −100 °C. Transmission Electron Microscopy (TEM) was performed with a FEI-Tecnai G2 F20 S-TWIN type transmission microscope operating at 120 kV.
Two-dimensional small angle X-ray scattering (2D-SAXS) experiments were performed at BL16B1 beamline in Shanghai Synchrotron Radiation Facility (SSRF) in China. The X-ray wavelength was 0.124 nm and the sample-to-detector distance was set at 2835 mm. The exposure time was set at 20 s. Two-dimensional SAXS patterns were recorded at room temperature. The Fit2D software from European Synchrotron Radiation Facility was used to analyze the SAXS patterns in terms of the scattering vector q = 4πsinθ/λ, with 2θ as the scattering angle. In addition, the background scattering was subtracted to achieve the scattering intensity as a function of scattering vector.
Two-dimensional wide-angle X-ray diffraction (2D-WAXD) measurements were conducted on a Bruker DISCOVER D8 diffractometer. 2D-WAXD patterns were collected for all the OBC samples with different draw ratios at room temperature using Cu-Kα radiation for 300 s. In addition, the background scattering for all the samples were subtracted from the 2D-WAXD patterns.
Standard dumbbell-shaped samples were cut from the melt-drawn films along the melt stretching direction. Monotonic tensile tests were performed on a SANS Universal tensile testing machine according to the GB/T 528-2009 standard. All the tests were conducted at ambient temperature (23 °C) at a fixed crosshead speed of 50 mm min−1 and five specimens were tested for each group. Step-cycle tests were also performed under the program of the tensile loading–unloading cycles at a fixed loading and unloading velocity of 50 mm min−1.
3. Results and discussion
3.1. Crystallization and melting of OBCs with different hard blocks
Fig. 2a and b show the crystallization behaviour and subsequent melting behaviours of the OBCs. There is very similar crystallization and melting behaviour for OBC-35 and OBC-25. However, it is noted that OBC-12 crystallizes in a lower and broader temperature range and its melting occurs in a relatively wide temperature range, indicating a wide distribution of sequential length of crystallisable polyethylene segments.
|
| Fig. 2 (a) DSC cooling curves. (b) The subsequent heating curves of different OBC materials. Note: the cooling rate and heating rate were set at 10 °C min−1. | |
The detailed thermal properties can be found in Table 2. The crystallization temperatures (Tc,peak) of OBC-35, OBC-25 and OBC-12 are 101.9 °C, 100.8 °C, 97.4 °C, respectively. The melt temperatures (Tm,peak) of OBC-35, OBC-25 and OBC-12 are 123.0 °C, 122.2 °C, 121.7 °C, respectively. The crystallinity decreases almost linearly with a decrease in the hard block content from 22.3%, 14.8–7.4% in the order of OBC-35, OBC-25 and OBC-12.
Table 2 Thermal properties of different OBCs
Sample |
T
m,onset [°C] |
T
m,peak [°C] |
T
m,com [°C] |
T
c,onset [°C] |
T
c,peak [°C] |
T
c,com [°C] |
ΔH [J g−1] |
X
c [%] |
OBC-35 |
113.0 |
123.0 |
125.8 |
110.9 |
101.9 |
97.5 |
64.5 |
22.3 |
OBC-25 |
112.5 |
122.2 |
124.9 |
111.5 |
100.8 |
96.8 |
42.7 |
14.8 |
OBC-12 |
109.4 |
121.7 |
124.5 |
108.9 |
97.4 |
93.7 |
21.3 |
7.4 |
Fig. 3 presents the POM images of the three OBCs. It is found that all three OBCs can form spherulites even though the crystallinity of OBC-12 is as low as 7.4%. Due to the small value of ΔC8 and weak segregation strength, the mesophase separation effect can be neglected in these OBC systems. For OBC-35, the spherulites can be as large as 30 μm, as observed in Fig. 3a. The sizes of the spherulites decrease with the decrease in the content of the hard segments in OBC. Fig. 3b shows the spherulites in OBC-25 are nearly 10 μm, whereas OBC-12 has spherulites less than 5 μm, as shown in Fig. 3c. Thus, the hard block content of OBCs can lead to significantly different crystallinity and spherulite sizes.
|
| Fig. 3 The representative POM images of un-stretched OBC films: (a) OBC-35; (b) OBC-25; (c) OBC-12. | |
3.2. The mechanical performance of compression-moulded OBC films
Fig. 4 presents typical stress–strain curves of compression-moulded OBC films. All three OBCs exhibit yielding behaviour at lower strain and typical strain-hardening behaviour at the late stage and are elongated to fracture at a large strain at break. It is observed that the Young's modulus and fracture strength of OBC-35 are much higher than those of OBC-25 and OBC-12, whereas the elongation at break is the largest for OBC-12. For OBC, the lamellar stacks and crystals can be taken as the physical crosslinks, which provide stiffness for the elastomer and also support the rubber network (amorphous phase) giving rise to good elastomeric properties. When the crystallinity is as low as 7 wt%, the samples still show great elastomeric behaviour. It is very interesting to find that the mechanical performance of OBC-25 and OBC-12 are close to each other in spite of their big differences in crystallinity and spherulite size. When the hard block content linearly decreases, it can result in a crystal morphology change from close-packed spherulites to tiny crystals and a linear decrease in crystallinity. However, the changes in mechanical properties do not follow the same pattern. This indicates that the crystallinity is not the only factor influencing the tensile behaviour.
|
| Fig. 4 Typical stress–strain curves for compression-moulded OBC films. | |
3.3. The mechanical performance of oriented OBC films
Fig. 5 shows the representative stress-strain curves of the melt stretched OBC films with various draw ratios and also presents the dependence of Young's modulus on draw ratio. Overall, two nearly linear stress–strain stages are observed. The first stage could be described as the linearly elastic deformation region, whereas the second one represents the strain-hardening region with larger plastic deformation until the final breakage. In addition, the elongation at break decreases considerably with increase in DR. In other words, the OBC films become stronger and harder after melt stretching. The change in modulus and tensile strength at a fixed strain (200%) as a function of draw ratio for the three OBCs is summarized in Fig. 5d and e, respectively. Only a slight increase in modulus and tensile strength is observed with an increase in the draw ratio for both OBC-25 and OBC-12. Moreover, it is interesting to find that they have almost the same modulus and tensile strength in spite of their big differences in hard block content and crystallinity. For OBC-35, however, one observes a sharp increase in modulus and tensile strength as the draw ratio increases from 4.95 to 8. It can even reach ∼25 MPa, which means ∼500% increase in comparison with that of the compression-molded sample, as the draw ratio reaches to 13.2. This result also suggests that a critical draw ratio is needed for OBC-35 to achieve an obvious property enhancement via melt stretching.
|
| Fig. 5 Representative stress–strain curves for OBC films with different draw ratios (DRs) along the stretching direction (SD): (a) OBC-35; (b) OBC-25; (c) OBC-12; (d) Young's modulus as a function of draw ratios; (e) stress at a fixed strain (200%) as a function of draw ratio. | |
For thermoplastic elastomers, cyclic properties and elastic recovery are also important for potential industrial applications. Fig. 6a–c show the elastic properties for OBC films with different draw ratios during step-cycle tensile testing. For OBC films with low draw ratios, the stress gradually increases with the increase in the strain, although experiencing several cycles. For OBC-25 and OBC-12, the cyclic behaviours are similar and the stress gradually increases when the draw ratio increases. This implies no abrupt structural changes for OBC-25 and OBC-12 when increasing the draw ratio. However, for OBC-35, films with high draw ratios show obvious decrease in stress or even fracture behaviour after several cycles when the draw ratio is larger (DR8 and DR13.2). This is consistent with uniaxial deformation and indicates that a critical draw ratio possibly exists. Overall, OBCs with low hard segments possess a more stable cyclic behaviour. For detailed comparison, elastic recovery of these melt-stretched films was also quantitatively evaluated via calculation using the following equation:
| ER = (εmax − ε (0, εmax))/εmax, | (1) |
where
εmax and
ε (0,
εmax) are the maximum strain and the strain in the cycle at zero stress after the maximum strain
εmax, respectively.
31 The elastic recovery can reflect the ability of the films to return to their initial states once the force is removed. For all the samples, ER cannot reach 100%, which means there are always some plastic strains, resulting in a failure of complete recovery.
Fig. 6d and e give a quantitative comparison for elastic recovery of the OBC films with different draw ratios. It was found that OBCs with low hard block content achieve softer and better elastic recovery. Regardless of hard block content, after melt stretching, the elastic recovery of OBC films decreases with the increase in draw ratio. More importantly, the elastic recovery drops when the strain exceeds a certain strain zone (300–400%). For OBC-35, it shows a sensitive response to the draw ratio due to stronger softening behaviour and a failure of elastic recovery at larger strains than those of OBC-25 and OBC-12. OBC-35 thus shows great difference in mechanical performance when the draw ratio is larger than a critical value (4.95 to 8). Overall, the elastic recovery at low strain (<250%) can reach a better value, as high as 80%. Therefore, OBC can achieve a great mechanical strength as well as maintain a good elastic recovery with the aid of melt stretching to various draw ratios.
|
| Fig. 6 Typical stress–strain curves during step-cycle tests for melt stretched OBC films: (a) OBC-35; (b) OBC-25; (c) OBC-12; and the corresponding elastic recovery estimated by ER: (d) ER for OBC-35 films; (e) ER for OBC-25 films; (f) ER for OBC-12 films. | |
3.4. The orientation of crystal and amorphous phases in OBC films
For these melt-stretched films, orientation degree is always an important parameter for the final mechanical performance.32,33 2D-WAXD was used to characterize the detailed orientation for OBC films. Fig. 7 shows the 2D-WAXD patterns of OBC samples with different hard block contents under various melt drawing conditions. As indicated on the left in Fig. 7, a typical pattern for OBCs should be a broad amorphous reflection at low diffraction angle and two distinct diffraction peaks at higher angles located in the equators represent the (110) and (200) crystal planes, respectively. Both reflections represent the orthorhombic form. For samples with low DR, all the reflections are inclined to be isotropic. It is also found that the azimuthal spread of all crystal reflections becomes narrow with increasing draw ratios. Samples with higher DR always show anisotropic spots, indicating high degrees of crystal orientation.
|
| Fig. 7 2D-WAXD patterns for OBC samples with different draw ratios. (a) OBC-35-DR3; (b) OBC-35-DR4.95; (c) OBC-35-DR8; (d) OBC-35-DR13.2; (e) OBC-25-DR3; (f) OBC-25-DR4.95; (g) OBC-25-DR8; (h) OBC-12-DR13.2; (i) OBC-12-DR3; (j) OBC-12-DR4.95; (k) OBC-12-DR8; (l) OBC-12-DR13.2. | |
Consequently, to better show the difference, the intensity was plotted as a function of the azimuthal angle. Fig. 8a–c present the intensity as a function of azimuthal angle in the (110) plane for polyethylene (PE) orthorhombic crystals in OBCs. The narrower and steeper diffraction peaks as well as smaller Full Width at Half Maximum (FWHM) demonstrate higher molecular orientation for OBCs with high draw ratios. Furthermore, the degree of orientation can be calculated by the Hemans' orientation factor:
| f = (3〈cos2Φ〉 − 1)/2 | (2) |
| | (3) |
where
Φ is the azimuthal angle and 〈cos
2Φ〉 denotes the average of cos
2Φ, and
I(
Φ) represents the scattered intensity.
34 The orientation factor
f ranges between −0.5 and 1. In addition,
f = −0.5 represents a perpendicular orientation relative to the reference direction,
f = 0 represents an isotropic orientation and
f = 1 represents a perfectly parallel oriented structure. It can be observed from
Fig. 8d and e that the orientation degrees of the crystal and amorphous phases gradually increase with increasing draw ratio (DR). The orientation of the amorphous phase increases in a nearly linear manner with increasing draw ratio, whereas the crystal orientation increases and is inclined to reach a maximum. Both the crystal and the amorphous phases achieve higher orientation degrees at high draw ratios. For OBC-12-DR3, the crystal orientation is the lowest, which may be caused by the relaxation effect. As a consequence, the degree of orientation of the amorphous phase is almost the same and slightly increases with the increase in the draw ratio for the three OBCs, disregarding their hard block content. A similar increase in crystalline orientation is also observed for OBC-25 and OBC-12, but for OBC-35, an obvious increase is seen and a critical draw ratio exists as the draw ratio increases from 4.95 to 8. We therefore conclude that OBC-35 achieves higher crystalline orientation at high draw ratios (DR8 and DR13.2).
|
| Fig. 8 The azimuthal scans of the (110) crystal plane for OBC films: (a) OBC-35; (b) OBC-25; (c) OBC-12; (d) the crystal orientation factor of crystal phase (fc), and (e) amorphous phase (fa) as a function of draw ratio. Note: (A) DR3; (B) 4.95; (C) DR8; (D) DR 13.2. | |
Furthermore, 2D-SAXS were collected to show more details of the microstructures of the OBC films at the lamellar level. Fig. 9 lists all the 2D-SAXS patterns of the OBC samples with different draw ratios. For the samples with DR3, OBC-35 gains an anisotropic pattern but OBC-12 achieves a nearly isotropic ring pattern (due to the relaxing effect). OBC-12-DR3 shown in Fig. 9i presents a diffuse ring pattern, indicating the formation of a randomly oriented lamellar structure. With the increase in draw ratio, all the samples gain anisotropic patterns along the meridian. The reflection located in the meridian indicates that lamellar stacks of polyethylene (PE) crystals are arranged perpendicularly to the stretching direction. More interestingly, a clear streak exists at the equators for samples of DR13.2. Moreover, the intensity of the streak decreases in the order of OBC-35, OBC-25 and OBC-12. In general, this type of streak may represent the shish-kebab-like structure, fibrillar morphology or the possibility of oriented micro-voids along the drawing direction.15 This observation has been reported previously in extruded high-density polyethylene (HDPE) films26 and shear-induced crystallization of polypropylene (PP) melt films.35 The invariant intensity (Q = ∫Iq2dq) remains nearly constant (after subtracting the thickness effect) for these films, indicating less possibility of elongated micro-voids since the intensity would be much stronger if voids emerge. Therefore, the streak should be responsible for the fibril (or shish) structures.
|
| Fig. 9 2D-SAXS patterns for OBC samples with different draw ratios. (a) OBC-35-DR3; (b) OBC-35-DR4.95; (c) OBC-35-DR8; (d) OBC-35-DR13.2; (e) OBC-25-DR3; (f) OBC-25-DR4.95; (g) OBC-25-DR8; (h) OBC-25-DR13.2; (i) OBC-12-DR3; (j) OBC-12-DR4.95; (k) OBC-12-DR8; (l) OBC-12-DR13.2. Note: the stretching direction (SD) is vertical to the equator. | |
The scattering intensity as a function of q can be analyzed to obtain information on the content of the shish (or fibrils). The relative content of the streak pattern Rstreak can be calculated by the following:36
| Rstreak = Istreak/(Istreak + Ikebab) | (4) |
| | (5) |
| | (6) |
where
Istreak is the scattering intensity of the streak pattern, obtained from
eqn (5), while
Ikebab means the scattering intensity of the kebab structure, obtained from
eqn (6).
Fig. 10a–c show azimuthal scans of streak intensities at the equator. Peak intensity reflects the relative content of the streak patterns. Samples with low draw ratios achieve no obvious streak patterns, whereas samples with high draw ratios gain a larger amount of shish. Fig. 10d shows the relative streak content as a function of the draw ratio. It is found that the shish content of OBC-35 is larger than that of OBC-25 and OBC-12. Similar to the trend of crystalline orientation, the shish content of OBC-25 and OBC-12 slightly increases with the draw ratio and are nearly the same, disregarding the hard content. However, the shish content of OBC-35 obviously increases with the draw ratio and shows a significantly higher value especially at large DRs (DR8 and DR13.2). For OBC-35-DR13.2, the relative content of the streak can even reach as high as 54%. In addition, Ruland's streak analysis method was also used to analyze the length of shish and its orientation along the stretching direction (SD).37,38 The length of the fibril can be extracted from the following relation:
| | (7) |
where
Bobs denotes the integral breadth (peak area/peak height),
lf represents the length of the fibril and
θ denotes the mis-orientation of fibrils. Herein, for example, samples with strong streaks (DR8 and DR13.2) were analyzed and compared. As shown in
Fig. 10e, the length of the fibril for OBC-35-DR8 is nearly 140 nm, whereas that for OBC-35-DR13.2 can be as long as 180 nm. For OBC-25 and OBC-12, the fibril length is nearly 100 nm and increases from 96 nm to 114 nm and from 87 nm to 103 nm, respectively. The fibril length is larger for OBC-35 than those of OBC-25 and OBC-12. Moreover, OBC-35 achieves a higher increase in fibril length than OBC-25 and OBC-12, when the draw ratio increases from 8 to 13.2. Previous studies reported that the fibril length in HDPE was 300 nm and became 390 nm long after deformation.
39 Overall, this implies that a higher draw ratio induces longer fibrils and higher orientation of fibrils.
|
| Fig. 10 Azimuthal scans for streaks at the equator for (a) OBC-35; (b) OBC-25; (c) OBC-12; (d) the shish content of OBC films with different draw ratios; (e) the Ruland's streak analyses for shish length and orientation of samples with DR8 and DR13.2. | |
3.5. The morphological change in melt-stretched films as a function of draw ratio
For further information on these structures, the change in crystal morphology as a function of draw ratio was carefully studied via TEM. As an example, the structural change in OBC-35 with draw ratio is shown in Fig. 11. Fig. 11a also shows clear spherulites embedded in the amorphous phase for OBC-35 with a low draw ratio. For a medium draw ratio, oriented lamellae emerge accompanied by some deformed spherulites as can be seen from Fig. 11b and c. With further increase in the draw ratio, highly-aligned crystals or fibrillar structures appear, as shown in Fig. 11d, and the FFT image shows strips perpendicular to the stretching direction. Herein, the FFT image of the TEM data is similar to the streak pattern in Fig. 9d. For comparison, crystal structures of OBC-25 and OBC-12 obtained at the highest draw ratio are also presented, as shown in Fig. 11e and f, respectively. Due to the decreased crystallinity from OBC-35 to OBC-12, the phase contrast decreases. Overall, melt stretching can significantly enhance crystal orientation and also induce highly-aligned fibril structures, especially at high draw ratios. The ultrathin sections (of TEM images) may have only local information about the morphology of these OBC films; however, the TEM results are strongly consistent with the SAXS patterns.
|
| Fig. 11 The representative TEM images of OBC films: (a) OBC-35-DR3; (b) OBC-35-DR4.95; (c) OBC-35-DR8; (d) OBC-35-DR13.2; (e) OBC-25-DR13.2; (f) OBC-12-DR13.2. Note: inset is the FFT image and the white arrow indicates the stretching direction. | |
3.6. The importance of the critical hard block content in the enhancement of the properties of OBCs
For polymers with high crystallinity, crystalline lamellae can grow extensively to form strong interlamellar coupling, which can result in an effective rigid network of lamellar crystallites.40 The hard segments of OBCs can crystallize just like polyethylene (PE), whereas the soft segments cannot crystallize because more branches make the molecular chains difficult to fold back and forth (crystallization). OBC can thus be regarded as a double-network structure of a crystal network interpenetrating with an amorphous network with entanglements. The amorphous soft segments (Tg < −40 °C) connect “crystal aggregates” to form a rubber network. In detail, “crystal aggregates” means that the soft block in between two hard blocks may become a tie chain connecting the lamellar crystals. This makes it possible for OBCs to form large lamellar crystals, which is impossible for olefin random block copolymers (ORC).15 The crystal phase serves as physical crosslinks providing stiffness for OBC samples. As a result, the crystalline network is a crucial factor for high-performance elastomers. For most thermoplastic elastomers (TPE), the crystallinity is the key factor in determining the crystalline network, and a lower crystallinity decreases the crystal connection, which results in a less effective crystal network. For OBC, a new type of TPE, we find some different results. For OBC-25 and OBC-12, a very different crystallinity exists between them, but very similar mechanical properties and similar responses to stretching are observed. In this case, the coupling effect between different lamellae is small, their crystalline network constructed by hard blocks cannot be interpenetrated and thus the network is weak and less dependent on the hard block content. However, as the hard block content of OBC reaches a certain value, the crystalline network constructed by hard blocks can be interpenetrated, and a very strong network is expected. This strong rigid network is destroyed as the draw ratio reaches a certain value (4.95 to 8), leading to an obvious increase in crystalline orientation and shish content, and the stretching induced enhancement in properties is observed. We therefore believe a critical hard block content could exist above which a strong network (interpenetrated) could be constructed by the hard block crystalline phase, resulting in a higher tensile strength and modulus, and below which only the weak network (separated) exists and is less dependent on the hard block content, resulting in a similar mechanical behaviour. Based on our experimental results, the critical hard block content should be between 25 wt% and 35 wt% and thus, more samples with hard block contents between 25 wt% and 35 wt% are needed to prove the importance of hard block content and to accurately determine the critical hard block content. The structural change in OBC films with hard block content below or above the critical content under the effect of stretching is schematically shown in Fig. 12.
|
| Fig. 12 Schematic profiles of the interpenetrating network structure of the OBC systems and the corresponding structural changes after melt-stretching. Note: H represents high hard block content and L represents low hard block content. | |
4. Conclusions
In summary, the structures of OBC films with different hard block contents were prepared at different draw ratios, and the corresponding mechanical performances were studied. For the OBC system, a crystalline network can form and interpenetrate the amorphous network with entanglements. It was found that melt stretching can increase the orientation of the crystal and amorphous phases, which increases Young's modulus and tensile stress at fixed strain significantly. In addition, the elongation at break and elastic recovery decrease with increasing draw ratio. The orientation factor of the amorphous phase (fa) gradually increases linearly with the increase in draw ratio and shows no significant change with the hard content. However, the crystal orientation (fc) increases and an abrupt change emerges when the draw ratio increases from 4.95 to 8 for OBC-35. This indicates that a critical hard content (35 wt%) exists. Above this value, the strong crystalline network can be destroyed when the draw ratio reaches a high level (4.95 to 8) and thus results in an obviously higher crystal orientation, high shish content and large increase in Young's modulus. Below this value (25 wt% and 12 wt%), a weak network forms and it is less sensitive to melt stretching, which gives rise to a linear increase in crystalline orientation as well as linearly increased Young's modulus and stress. This study clarifies the importance of hard block content on the crystal structure, orientation and mechanical properties with the aid of melt stretching.
Acknowledgements
This study was supported by the Special Funds for Major State Basic Research Projects of China (2011CB606006) and the National Natural Science Foundation of China (51421061 and 51210005). We would like to thank Prof. Stephen Z. D. Cheng for fruitful scientific discussions on the data and careful suggestions on the manuscript.
Notes and references
- F. Wang, H. Liu, W. Zheng, J. Guo, C. Zhang, L. Zhao, H. Zhang, Y. Hu, C. Bai and X. Zhang, Polymer, 2013, 54, 6716 CrossRef CAS PubMed .
- D. U. Khariwala, A. Taha, S. P. Chum, A. Hiltner and E. Baer, Polymer, 2008, 49, 1365 CrossRef CAS PubMed .
- Y. Mohammadi, M. Ahmadi, M. R. Saeb, M. M. Khorasani, P. Yang and F. J. Stadler, Macromolecules, 2014, 47, 4778 CrossRef CAS .
- R. L. Kuhlman and T. T. Wenzel, Macromolecules, 2008, 41, 4090 CrossRef CAS .
- A. Xiao, L. Wang, Q. Liu, H. Yu, J. Wang, J. Huo, Q. Tan, J. Ding, W. Ding and A. M. Amin, Macromolecules, 2009, 42, 1834 CrossRef CAS .
- A. Valente, A. Mortreux, M. Visseaux and P. Zinck, Chem. Rev., 2013, 113, 3836 CrossRef CAS PubMed .
- J. Jin, J. Du, H. Chen and C. C. Han, Polymer, 2011, 52, 6161 CrossRef CAS PubMed .
- X. Zhou, J. Feng, D. Cheng, J. Yi and L. Wang, Polymer, 2013, 54, 4719 CrossRef CAS PubMed .
- M. Wu, Z. Wu, K. Wang, Q. Zhang and Q. Fu, Polymer, 2014, 55, 6409 CrossRef CAS PubMed .
- J. Tyczkowski, I. Krawczyk, B. Woźniak and J. M. Martin-Martinez, Eur. Polym. J., 2009, 45, 1826 CrossRef CAS PubMed .
- N. Ahmad, D. J. Thompson, C. J. C. Jones and A. H. Muhr, J. Sound Vib., 2009, 322, 674 CrossRef PubMed .
- Y. Zhao, B. Su, L. Zhong, F. Chen and Q. Fu, Ind. Eng. Chem. Res., 2014, 53, 15287 CrossRef CAS .
- Z.-Z. Tong, J. Huang, B. Zhou, J.-T. Xu and Z.-Q. Fan, Macromol. Chem. Phys., 2013, 214, 605 CrossRef CAS PubMed .
- F. Zuo, Y. Mao, X. Li, C. Burger, B. S. Hsiao, H. Chen and G. R. Marchand, Macromolecules, 2011, 44, 3670 CrossRef CAS .
- F. Zuo, C. Burger, X. Chen, Y. Mao, B. S. Hsiao, H. Chen, G. R. Marchand, S.-Y. Lai and D. Chiu, Macromolecules, 2010, 43, 1922 CrossRef CAS .
- Z.-Z. Tong, B. Zhou, J. Huang, J.-T. Xu and Z.-Q. Fan, Macromolecules, 2014, 47, 333 CrossRef CAS .
- G. Liu, X. Zhang, X. Li, H. Chen, K. Walton and D. Wang, J. Appl. Polym. Sci., 2012, 125, 666 CrossRef CAS PubMed .
- Z. Li, Y. Shi, H. Liu, F. Chen, Q. Zhang, K. Wang and Q. Fu, RSC Adv., 2014, 4, 45234 RSC .
- C. Geng, X. Hu, G. Yang, Q. Zhang, F. Chen and Q. Fu, Chin. J. Polym. Sci., 2015, 33, 61 CrossRef CAS .
- Y. Gao, G. Zong, H. Bai and Q. Fu, Chin. J. Polym. Sci., 2014, 32, 245 CrossRef CAS .
- S. Wu, H. Li, G. Huang and J. Wu, RSC Adv., 2014, 4, 19024 RSC .
- Z.-Z. Tong, J. Huang, B. Zhou, J.-T. Xu and Z.-Q. Fan, J. Appl. Polym. Sci., 2015, 132, 41771 Search PubMed .
- Y.-G. Zhou, L.-S. Turng and C.-Y. Shen, J. Polym. Sci., Part B: Polym. Phys., 2010, 48, 1223 CrossRef CAS PubMed .
- M. Xu, S. Zhang, J. Liang, H. Quan, J. Liu, H. Shi, D. Gao and J. Liu, J. Appl. Polym. Sci., 2014, 131, 41100 Search PubMed .
- T. Chatterjee, R. Patel, J. Garnett Iv, R. Paradkar, S. Ge, L. Liu, K. T. Forziati Jr and N. Shah, Polymer, 2014, 55, 4102 CrossRef CAS PubMed .
- S. H. Tabatabaei, L. Parent, P. Cigana, A. Ajji and P. J. Carreau, J. Plast. Film Sheeting, 2009, 25, 235 CrossRef CAS PubMed .
- F. Sadeghi, S. H. Tabatabaei, A. Ajji and P. J. Carreau, Can. J. Chem. Eng., 2010, 88, 1091 CrossRef CAS PubMed .
- L. Meng, J. Xu, X. Chen, N. Tian, Y. Lin, K. Cui, J. Li and L. Li, Polym. Test., 2014, 36, 110 CrossRef CAS PubMed .
- B. Kolgjini, G. Schoukens and P. Kiekens, J. Appl. Polym. Sci., 2011, 124, 4081 CrossRef PubMed .
- A. L. Bobovitch, R. Tkach, A. Ajji, S. Elkoun, Y. Nir, Y. Unigovski and E. M. Gutman, J. Appl. Polym. Sci., 2006, 100, 3545 CrossRef CAS PubMed .
- Z. Wang, Y. Niu, G. H. Fredrickson, E. J. Kramer, Y.-W. Shin, F. Shimizu, F. Zuo, L. Rong, B. S. Hsiao and G. W. Coates, Macromolecules, 2010, 43, 6782 CrossRef CAS .
- A. S. Caro-Bretelle, P. Ienny and R. Leger, Polymer, 2013, 54, 4594 CrossRef CAS PubMed .
- L. Jarecki and A. Ziabicki, Polymer, 2002, 43, 2549–2559 CrossRef CAS .
- Y. Zhao, Z. Liu, B. Su, F. Chen, Q. Fu, N. Ning and M. Tian, Polymer, 2015, 63, 170 CrossRef CAS PubMed .
- I. A. Polec, T. Fujiwara, T. Kanaya and C. Deng, Polymer, 2012, 53, 3540 CrossRef CAS PubMed .
- J. K. Keum, F. Zuo and B. S. Hsiao, Macromolecules, 2008, 41, 4766 CrossRef CAS .
- A. F. Thünemann and W. Ruland, Macromolecules, 2000, 33, 1848 CrossRef .
- A. F. Thünemann and W. Ruland, Macromolecules, 2000, 33, 2626 CrossRef .
- S. Yamazaki, M. Itoh, T. Oka and K. Kimura, Eur. Polym. J., 2010, 46, 58 CrossRef CAS PubMed .
- Z. Jiang, Y. Tang, Y. Men, H.-F. Enderle, D. Lilge, S. V. Roth, R. Gehrke and J. Rieger, Macromolecules, 2007, 40, 7263 CrossRef CAS .
Footnote |
† Electronic supplementary information (ESI) available. See DOI: 10.1039/c5ra13864g |
|
This journal is © The Royal Society of Chemistry 2015 |
Click here to see how this site uses Cookies. View our privacy policy here.