 Open Access Article
Creative Commons Attribution 3.0 Unported Licence
Conjugation of TEM-EDX and optical spectroscopy tools for the localization of Yb3+, Er3+ and Co2+ dopants in laser glass ceramics composed of MgAl2O4 spinel nano-crystals embedded in SiO2 glass
G.
Boulon
*a,
G.
Alombert-Goget
a,
Y.
Guyot
a,
M.
Guzik
ab,
T.
Epicier
c,
N. P.
Blanchard
a,
L.
Chen
d,
L.
Hu
d and
W.
Chen
d
aInstitute Light Matter (ILM), UMR5306 CNRS-University Lyon1, University of Lyon, Bât. Kastler, 69622 Villeurbanne, France. E-mail: georges.boulon@univ-lyon1.fr
bFaculty of Chemistry, University of Wroclaw, 14 Joliot-Curie, PL-50-383 Wroclaw, Poland
cMATEIS, UMR 5510 CNRS-INSA of Lyon, University of Lyon, Bât. Pascal, 69621 Villeurbanne, France
dHigh Power Laser Components R&D Center, Shanghai Institute of Optics and Fine Mechanics, Chinese Academy of Sciences, Jiading, Shanghai 201800, China
First published on 14th August 2014
Abstract
The main goal of this work is to conjugate two independent techniques of TEM-EDX and optical spectroscopy, which is rare, for the localization of Yb3+ and Er3+ rare earth ions and Co2+ transition metal ions as dopants in a compact self-Q-switched microchip laser glass ceramic composed of MgAl2O4 spinel nano-crystals of 10–20 nm size embedded in SiO2 glass. The use of the TEM-EDX technique associated with both the elemental mapping of each dopant and the direct visualization of the heavier rare earth ions has led to the result that Er3+ and Yb3+ rare earth ions are preferentially located in the spinel nano-crystals. Regarding the low Co2+ concentration this technique was not accurate enough for characterization and finally we have used absorption spectroscopy to probe the main presence of Co2+ ions in the spinel nano-crystals. The use of Yb3+ ions as structural probes allows the identification of the 0-phonon broad line at 977 nm as both that of the disordered glass and that of the spinel inverted phases. A new Yb3+ radiationless center has been pointed out by the presence of a strong absorption line at 970 nm which has been assigned to the strongly perturbed area of the spinel nano-crystallite surface. This dopant characterization is worthwhile to be shown as a special case where characterization of rare earth and transition metal ions needs the use of both TEM and spectroscopic techniques.
1. Introduction
Passively Q-switched, diode-pumped solid state lasers are currently being used as miniature or micro-lasers capable of delivering a high peak output power at high repetition rates and a short nanosecond (ns) temporal pulse width. These lasers are of great interest due to their potential applications in micro-machining, remote sensing, targeting, ranging, and microsurgery. Cr4+ and Co2+ dopants have been proposed as saturable absorbers for passive Q-switching of solid-state lasers operating in the near-infrared region. Most commonly, systems presently used are based on Nd3+:YAG or Nd3+:YVO4 lasers, passively Q-switched by Cr4+:YAG, where the unique well-known characteristics of Cr4+ garnets as saturable absorbers are applied.1–4 Another crystal like Cr4+:Mg2SiO4 was also proposed as a saturable absorber.5 The most important application of the oxide crystals doped with tetrahedrally coordinated Co2+ ions is passive Q-switching of solid-state lasers operating in the near-infrared region. A number of crystals such as YAG, LaMgAl11O19 (LMA), and ZnSe were doped with Co2+ ions.6,7 As an example, the passively Q-switched 1.34 μm Nd3+:YxGd1−xVO4 laser with a Co2+:LaMgAl11O19 saturable absorber was demonstrated.8The original idea was proposed recently with transparent glass ceramics9,10 containing Yb3+, Er3+ ions in a glass matrix and Co2+-doped MgAl2O4 nano-crystals of sizes of 10–20 nm, which can be used as a compact self-Q-switched microchip laser. Indeed, glasses containing nano-crystals embedded in a glass matrix can enhance existing or offer completely new properties compared to those of the precursor glass. These transparent glass ceramics possess the spectral requirements of both eye safe lasers by Er3+ 4I13/2 → 4I15/2 emission in the glass matrix between 1.5 and 1.6 μm under Yb3+ pumping and saturable absorbers by 4A2 (F) → 4T1 (F) transition of Co2+-doped MgAl2O4 nano-crystals so that, together, might be developed as a self-Q-switched microchip laser. A previous analysis has shown that Yb3+ and Er3+ seem to remain in the SiO2 glass matrix, while Co2+ occupies the tetrahedral sites in MgAl2O4 nano-crystals.10
The main goal of this study is to report deeper complementary spectroscopic measurements to solve more accurately the problem of the location of dopants in the two glassy and nano-spinel phases in order to check the feasibility of this laser system.
2. Experimental techniques
2.1. Sample preparation
Glass with a composition (in wt%) of 1.8Yb2O3–1.7Er2O3–11MgO–31.5Al2O3–47SiO2–4.5TiO2–2.5ZrO2–0.03CoO (CYE glass) was prepared, where TiO2 and ZrO2 were used as mixed nucleating agents.10 Concentrations of Co2+, Yb3+ and Er3+ ions are 5.77 × 1018 cm−3, 1.5 × 1020 cm−3, and 1.46 × 1020 cm−3, respectively. For comparison, CoO-undoped glass (YE glass) with the same composition was also prepared. For the two glasses, homogeneous mixtures (300 g) of analytical reagent grade raw materials, obtained by ball milling, were melted in a corundum crucible in a laboratory electric furnace at 1580 °C for 4 h in an air atmosphere under stirring. According to differential scanning calorimetry (DSC) analysis, CYE and YE glass samples were heat treated at 760 °C for 12 h, and then at 930 °C for 4 h. As a result, transparent CYE GC and YE GC were synthesized. The purity of Yb2O3 and Er2O3 is 4N, while other reagents are of analytical grade.For comparative absorption analysis of samples containing different concentrations of Yb3+ and one Er3+ concentration we used the compositions (in wt%) of 2Yb2Er, 4Yb2Er, and 6Yb2Er, it means xYb2O3–1.1Er2O3–(3.3 − x)La2O3–11MgO–30.6Al2O3–47SiO2–4.5TiO2–2.5ZrO2–0.03CoO (x = 1.1, 2.2, 3.3), respectively.
2.2. Experimental section
The homogenous and well-ground nano-powder of spinels was compressed in the form of pellets under 20 MPa pressure. Very thick and transparent samples prepared in this way were used for the absorption measurements.
The luminescence decay curves were recorded under pulsed laser excitation (OPO laser, EKSPLA NT342, 10 Hz, 7 ns) and detection of the fluorescence intensity around 1.06 μm was possible with the help of a fast cooled germanium cell (NORTHCOAST) coupled to a LECROY LT 342 digital oscilloscope. The luminescence decay curves were recorded at room and liquid nitrogen temperatures.
3. Results and discussion
3.1. Morphology of samples observed by TEM measurements
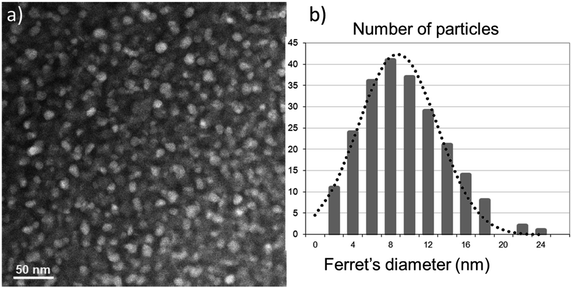
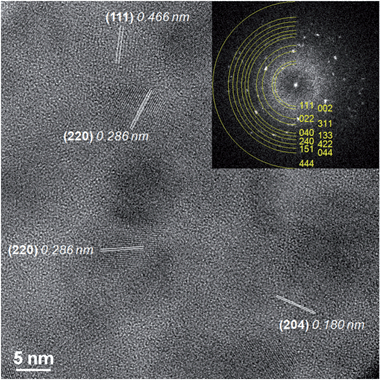
A typical STEM-HAADF image is presented in Fig. 1a where spinel nanoparticles appear with a brighter contrast with respect to the vitreous matrix. Their size ranges typically between 4 and 20 nm with an average at around 10 nm. Lattice imaging clearly indicates the crystalline nature of the spinel phase as shown in Fig. 2.Crystallographic indexing was performed either in the conventional diffraction mode or by using Fourier transforms, or diffractograms, of the HREM images as reported as an inset in Fig. 2: all acquired data are fully consistent with the usual spinel, the Fd![[3 with combining macron]](https://www.rsc.org/images/entities/char_0033_0304.gif) m structure of MgAl2O4 with a = 0.808 nm. A confirmation of this finding is presented in Fig. 3 where a spinel crystallite is observed at high resolution in the [001] viewing direction.
m structure of MgAl2O4 with a = 0.808 nm. A confirmation of this finding is presented in Fig. 3 where a spinel crystallite is observed at high resolution in the [001] viewing direction.
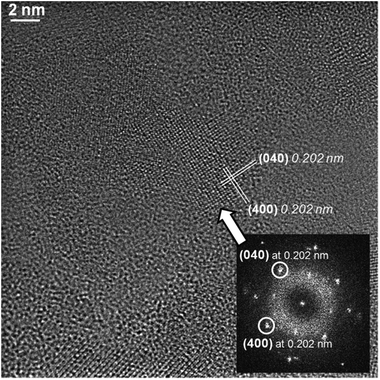 | ||
| Fig. 3 Typical HRTEM image and indexed diffractogram of a nano-crystallite (arrowed). Lattice distances correspond to the usual spinel structure within a 2% accuracy. | ||
The d-spacing and growth direction of the nanoparticles have been indexed and presented in Fig. 2 and 3.
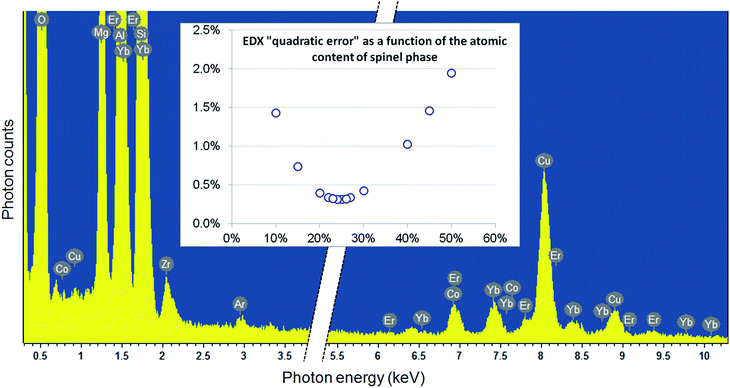
This is important to evaluate the ratio between the MgAl2O4 nano-spinel crystallites and the SiO2 glassy phase. To do so, EDX results obtained on large areas of about 1 μm2 were fitted by a linear combination of the expected chemical formula of both phases: xMgAl2O4 + (1 − x)SiO2, where x represents the atomic fraction of the spinel phase. According to the usual consideration of absorption effects, linked to the sample thickness (estimated here to about 50 nm, with little incidence on the final spinel fraction in the interval 0–100 nm), the elemental contents for the major constituents O, Mg, Al, and Si were deduced from the experimental and the spinel atomic fraction x was refined from a simple mean-least square fitting procedure (see Fig. 4): using this approach, an optimum value of x = 25% was found.
3.2. Distribution of Yb3+, Er3+, and Co2+ dopants as revealed by nano-probe EDX
One main challenge of the present structural characterization is to know not only the distribution of Yb3+, Er3+, and Co2+ dopants in both glassy and crystalline phases, but also at the interface between the nano-spinel crystals and the glass. The greatest difficulty when applying the TEM-EDX technique is to find out adequate thin regions where no or very little overlap occurs between nano-crystals, due to the high concentration of nano-crystals. EDX nanoprobe analysis was performed using the classical linescan procedure as employed previously to study the distribution of Yb3+ ions in grains and grain boundaries in Yb3+-doped YAG/Y2O3 ceramic bulky samples11,12 and Yb3+-doped YAG nano-ceramics13 or Ce3+ ions in Ce3+-doped YAG ceramic bulky samples.14A typical analysis is shown in Fig. 5. As can be seen from the HREM micrograph, we have chosen here a region where a single spinel crystallite is surrounded by the glassy matrix, where no lattice fringes were resolved; 12 measurements were performed using a probe of about 3 nm, as indicated by the circle marks. The diagram on the right-hand side of Fig. 5 shows the evolution of the Yb3+, Er3+ and Co2+ contents: enrichment in rare earth ions is clearly evidenced in the spinel phase, whereas the very low content measured for Co2+ does not permit any definitive conclusion about any possible distribution heterogeneity.
A large number of such EDX nano-probe measurements were performed and the results are summarized in the diagram of Fig. 6: they confirm the previous Yb3+ and Er3+ enrichment within the nano-spinel crystals as compared to the vitreous matrix. Again, the situation is less convincing regarding the very low concentration of Co2+ in both spinel and silica phases, but a slight enrichment of the vitreous matrix is suggested by data reported in Fig. 6.
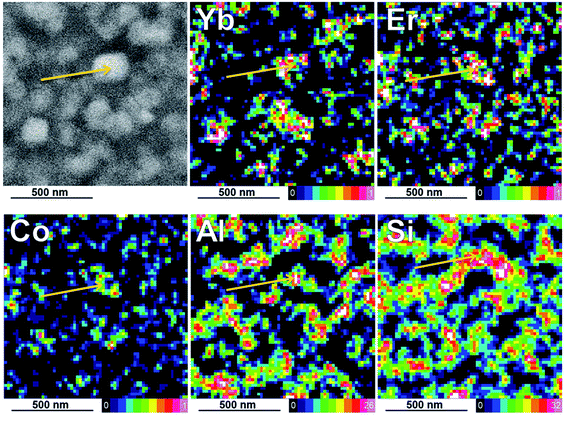
To give a better global view of the dopant distribution, EDX elementary maps were recorded. Because of irradiation effects severely limiting the acceptable dose on the sample, it could not be possible to acquire maps with sufficient X-rays counting for an accurate quantitative treatment. However, semi-quantitative analysis gave reasonable results in agreement with the previous nano-probe data, as shown by the representative montage reported in Fig. 7.
The elemental maps for the major species (Al and Si) allow easily the MgAl2O4 spinel and the SiO2 vitreous matrix to be separated; as already shown in Fig. 1, darker areas in STEM-HAADF images correspond to the vitreous SiO2-based phase. These maps are treated in a quantitative way by using Aztec commercial software provided by the manufacturer of the EDX system, which means that overlap effects between X-ray lines is in principle correctly taken into account. According to this, the Yb3+ and Er3+ maps clearly confirm the greatest concentrations of Yb3+ and Er3+ dopants inside the nano-crystalline phase and only some small traces inside the SiO2 glassy phase. Again, the Co2+ content appears too low on average to permit any conclusive location.
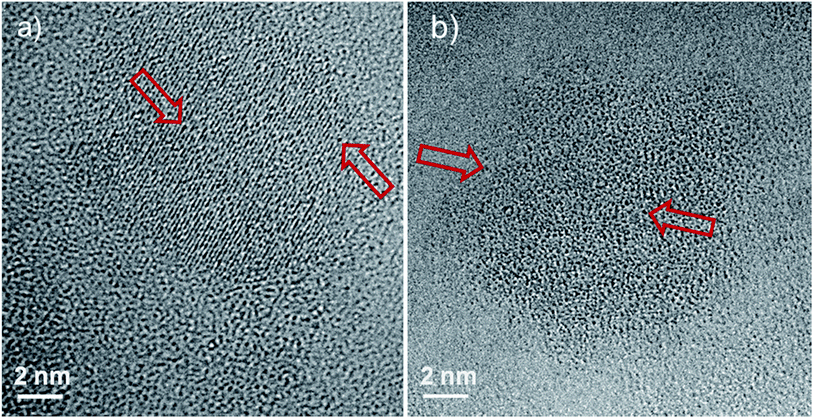
Another original worthwhile observation should be mentioned here concerning the HRTEM imaging of individual dopants. According to (i) the resolution permitted by the spherical aberration corrector, (ii) the large ‘weight’ (atomic number) difference between rare earth ions (Er3+ and Yb3+) compared to the spinel and glassy phase elements (O2−, Al3+, Mg2+, and Si4+), it can be postulated that in the thinnest regions, an ‘absorption-type’ contrast could allow the direct visualization of heavier rare earth individual ions. In convenient so-called ‘Scherzer images’, atoms are expected to appear as dark dots on a brighter background, and Fig. 8a and b can be examples of such experimental evidence.
As a general conclusion of this TEM-EDX analysis, elemental maps of Fig. 7 (and, to some extent, HREM imaging in Fig. 8) confirm the results obtained from simple line scans in Fig. 5 and 6, less representative from the point of view of spatial distribution but more representative from the quantitative point of view: Er3+ and Yb3+ ions are preferentially located in the spinel nano-crystallites. This is the same conclusion for Co2+ ions but again the low concentration of this ion cannot permit any unambiguous location so that we need some useful help from the spectroscopic data as related in the next section. In parallel, we did not measure any significant gradient or segregation phenomenon, especially for Yb3+ and Er3+ ions, in the area of the interface between the spinel nano-crystals and the vitreous phase, although the induced damages from irradiation did not make possible to perform long acquisitions which would have been needed to gain the desirable sensitivity. This segregation was never seen for Yb3+ heavy ions in garnets and sesquioxides, but was encountered for example in the grain boundaries of the YAG ceramics doped with Nd3+ and Ce3+ ions.14–17 This is an important feature for the interpretation of the Yb3+ double absorption line as we will discuss it later.
3.3. XRD characterization
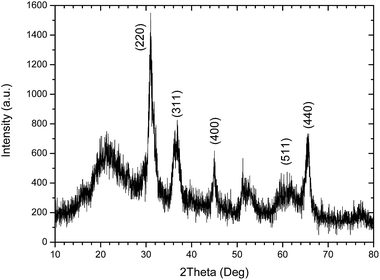
The XRD patterns of the CYE GC heat treated at 760 °C/12 h + 930 °C/4 h is presented in Fig. 9. The positions of diffused peaks closely resemble those of MgAl2O4 spinel (JCPDS, 21-1152). These peaks correspond to the reflections from the (220), (311), (400) and (440) crystal planes, respectively, of the MgAl2O4 spinel phase. The broad halo characteristics of amorphous SiO2 matrix glass is also shown.The diffraction peaks around 2theta = 44.8°, 36.9° and 31.3° were selected for calculating the size of MgAl2O4 nanocrystals by using Scherrer's equation. The sizes of MgAl2O4 nanocrystals are about 9.1 ± 1.3 nm for the CYE GC sample10 in agreement with the previous STEM-HAADF results of 10 ± 0.3 nm shown in the size histogram of micrograph of Fig. 1.
3.4. Spectroscopic properties of the glass ceramics
The absorption spectra of a glass ceramic sample (noted later as GC) shown in Fig. 11a and b are composed of both sharp lines from Er3+ and Yb3+ rare earth ions and broader bands from Co2+ transition metal ions. We can easily see the usual Er3+ ion transitions from the 4I15/2 ground state: 4I15/2 → 2H9/2 (∼407 nm), 4I15/2 → 4F3/2 (442 nm), 4I15/2 → 4F5/2 (451 nm), 4I15/2 → 4F7/2 (∼488 nm), 4I15/2 → 2H11/2 (∼521 nm), 4I15/2 → 4S3/2 (∼543 nm), 4I15/2 → 4F9/2 (∼653 nm), 4I15/2 → 4I9/2 (∼797 nm) (not presented here), 4I15/2 → 4I11/2 is hidden by 2F7/2 → 2F5/2 of Yb3+ ions which have much higher absorption strength (965–985 nm) and 4I15/2 → 4I13/2 (1510–1540 nm), respectively.
 | ||
| Fig. 11 Main absorption spectral regions of Co–Yb–Er-doped glass ceramics (GC) at RT and 4 K in the visible and the near IR. | ||
As for Co2+ ions, we detect the presence within two spectral ranges by the transition of both 4T1g → 4T1g (4P) (expected Oh symmetry of glass) and 2A1I2T2(2G) + 4T1(4P) + 2E2T1(2G) (Td Co2+) (expected Td symmetry of Mg2+ site in MgAl2O4 nano-spinels) between 500 and 680 nm and, in the near IR, between 1100 and 1700 nm, mainly by the 4A2 → 4T1(4F) (Td Co2+) of the Td symmetry in nano-spinels. This superposition of the two types of transitions justify the potentiality of this GC composition as saturable absorbers since the Co2+ broad absorption overlaps widely the expected laser emission from the Er3+ emission near 1550 nm. It has been already shown that this sample possesses excellent transparency up to nearly 87% at the near-infrared band.10
If, in the previous paper,10 the question on the location of Yb3+ and Er3+ rare earth ions as dopants in the glass-ceramic from spectroscopic data has not been unambiguously solved, the assignment of Co2+ ions was clearly established mainly in the MgAl2O4 spinel nano-crystals. We show in Fig. 12a the weak Co2+ near infrared absorption as mentioned by the spectrum 3, the intensity difference of the spectrum 1 of Co2+ ions in the glassy phase of Co2+–Yb3+–Er3+-doped silicate glass (CYE glass) and the spectrum 2 of Yb3+–Er3+-doped silicate glass (YE glass). The strongest absorption of Co2+ ions as observed in Fig. 12b by the spectrum 6, the intensity difference between 4 and 5 spectra, is assigned to Co2+ into Mg2+ sites of Td symmetry in Co2+–Yb3+–Er3+-doped MgAl2O4 nano-crystals of the (CYE GC) glass ceramics.
 | ||
| Fig. 12 (a) Absorption of Co2+ ions in the Co–Yb–Er-doped silicate glass (CYE glass) sample with respect to Yb–Er-doped silicate glass (YE glass), (b) absorption of Co2+ ions into Mg2+ sites of Co–Yb–Er-doped MgAl2O4 nano-crystals of the (CYE GC) glass ceramic sample.10 | ||
Let us remind that Co2+ ion optical transitions belong to transition metal ions with high oscillator strength (f ∼ 10−2) and high absorption cross-section in crystals is much easier to detect than rare earth ions which are characterized by much smaller f ∼ 10−6. Consequently, Co2+ ions can be seen at low concentration as it has been described here.
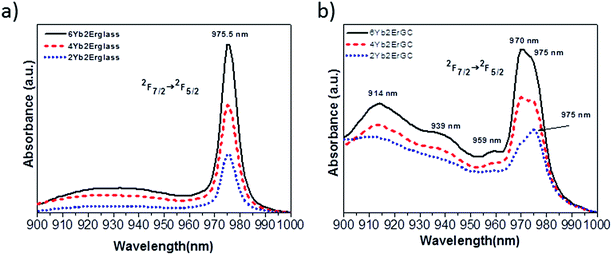
We will report now that spectroscopic data bring new results for these glass ceramic samples. It was found out in the absorption spectra the appearance of a new absorption line between 4 K and room temperature near 970 nm, so that it was necessary to compare the absorption of different samples containing different concentrations of Yb3+ and Er3+ ions in the two hosts of glasses and glass ceramics. First we have pointed out the double structure of the Yb3+ ions between 965 and 985 nm by two broad lines of practically similar intensity, so-called 0-phonon lines, with a maximum at 970 and 975.5 nm, respectively, as seen in Fig. 11b. Previously only one peak at 977 nm was observed. These two broad lines characterize the 2F7/2 → 2F5/2 transitions of Yb3+ ions between the lowest Stark energy level of each 2F7/2 and 2F5/2 manifolds rather than those of Er3+ ions, due to the much larger absorption coefficient of Yb3+ ions.
Concentration dependences of the Yb3+ absorption spectra of both glasses and glass ceramics samples containing the same amounts of Yb3+ and Er3+ rare earth ions are shown in Fig. 13a and b. Absorption spectra intensities presented for both glasses and GC are dependent on the increasing Yb3+ concentration. One can see the 2F7/2 (1) → 2F5/2 (5) double broad lines of Yb3+ ions with maxima at 969.5 and 975.6 nm usually associated with 0-phonon lines. The Lorentzian curves were fitted as shown in Fig. 14 and their parameters are listed in Table 1. Absorption spectra of Yb3+-doped GC exhibit an evolution of the new line at 969.5 nm with respect to the line at 975.6 nm and on the other hand a higher degree of structuration than the glass spectra. By comparing these absorption spectra one can assume that the line at 975.6 nm in GC has the same glassy origin as that in glass samples with a maximum at 975.5 nm. The area values in Table 1 show that the Yb3+ relative population of the line at 969.5 nm is strongly increasing when the Yb3+ concentration increases. The absorption spectra in the GC sample have a more complex structure. It might be due to the presence of a double phase, like for example, the glassy one as already interpreted and maybe the nano-spinel crystalline phase, but this hypothesis has to be discussed.
 | ||
| Fig. 13 Comparative detailed absorption spectra between 900 and 1000 nm of Yb3+ ions in glass (a) and glass ceramic (GC), (b) samples at RT. | ||
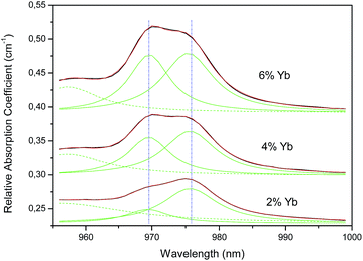 | ||
| Fig. 14 Decomposition of the two 0-phonon absorption lines of Fig. 11b between 960 and 990 nm into Lorentzian curves (see Table 1). | ||
| Sample | Area | Center (nm) | Half-width (nm) | Height |
|---|---|---|---|---|
| 2% Yb | 0.255 | 969.4 | 8 | 0.02 |
| 0.803 | 975.6 | 10.02 | 0.051 | |
| 4% Yb | 0.677 | 969.5 | 7.66 | 0.056 |
| 0.968 | 975.6 | 9.46 | 0.065 | |
| 6% Yb | 0.998 | 969.6 | 7.48 | 0.085 |
| 1.263 | 975.4 | 9.22 | 0.087 | |
It is interesting to compare the spectra of Yb3+-doped silica glass with those we obtained recently for Yb3+-doped calcium alumino-silicate glasses (CAS and LSCAS) for excitation and emission spectra.18 The spectra in these glasses are much more resolved than that of Yb3+-doped silica glass, showing distinctive three 2F7/2 → 2F5/2 components of the absorption spectra and four 2F5/2 → 2F7/2 components of the emission spectra, as expected. The main reason of this difference between the two types of glasses is the presence of Ca2+ and Al3+ cations in the glass network of CAS and LSCAS which contribute to the increase of the site symmetry inside the glassy phase. The Yb3+ 0-phonon line in CAS and LSCAS glasses is located at 977 nm, very close to the 975.5 nm in the silica glass of the GC, and consequently this is another proof of the assignment of the 975.5 nm peak to the silica glass phase in the GC sample.
Since the GC sample is composed of both the silicate phase and the nano-spinel crystalline phase, we also need some comparison with the rare earth-doped spinel nano-crystalline phase. We have recently published the concentration dependences of the absorption spectra and the emission spectra of Yb3+-doped MgAl2O4 spinel nano-crystals in the range of 10–30 nm size, prepared by the sol–gel method and characterized by both structural and spectroscopic properties.19
The first striking feature is the overlapping between the Yb3+ 0-phonon absorption line in the silica glass at 975.5 nm and the 0-phonon line of Yb3+-doped MgAl2O4 spinel nano-crystals at 976 nm (Fig. 15). Both of these two lines are very broad. In glasses this is due to the un-equivalent Yb3+ sites as usually expected in disordered amorphous materials and in MgAl2O4 spinel nano-crystals this is due to the following anti-site phenomenon:
| MgAl2O4 → (Mg1−2xAl2x)[Mg2xAl2−2x]O4 |
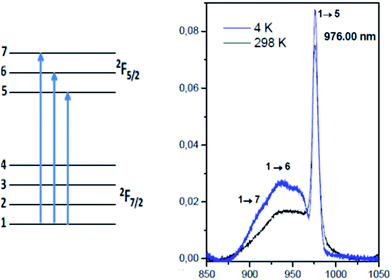 | ||
| Fig. 15 Temperature dependence of absorption spectra of Yb3+-doped MgAl2O4 spinel nanocrystals prepared by the sol–gel method.19 | ||
Indeed, some Al3+ and Mg2+ cations are exchanged between the cation sublattices forming pairs of anti-site defects and thus a degree of inversion is created. This degree of inversion x ranges from almost 0 for the normal spinel up to 0.5 for the inverse spinel structure. Apparently, in the spinel nano-crystal phase in ref. 19 the unresolved Yb3+ components indicate a large inverse spinel as a result of the multiplicity of Yb3+ sites observed either in octahedral or tetrahedral positions. Another effect increases the disorder by the substitution of Mg2+ cations. The compensation effect imposes to substitute three Mg2+ cations by two Yb3+ luminescent cations, creating one vacancy, pairs and aggregates even if the ionic radii of Yb3+ (85.8 pm) are much larger than those of Mg2+ (65 pm) and Al3+ (50 pm).19 This substitution was also proposed for the Yb3+–Er3+-co-doped MgAl2O4 phosphor powders prepared by the combustion method.20 In addition, other perturbed Yb3+ ions exist due to the morphology of the surface of the grains in contrast with the regular structure of the internal grain. It means that there are several reasons to increase disorder in the spinel lattice and to observe large broadening of both absorption and emission spectra.
As a result, in the GC samples the line located at 975 nm can be assigned to the 2F7/2 (1) → 2F5/2 (5) transition of Yb3+ ions in the glassy phase and also superposed with Yb3+ ions in the MgAl2O4 spinel nano-crystalline phase. There is a surprising situation, adding difficulties for the final interpretation, never reported, with two Yb3+-doped phases, one with SiO2 glass, another one with MgAl2O4 nano-crystalline, which show Yb3+ lines in coincidence. At last we need to find new data to interpret the absorption line at 970 nm.
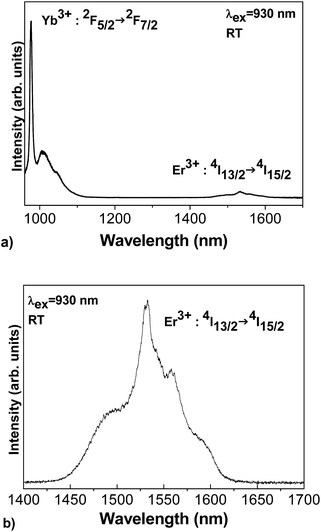
Yb3+ and Er3+ emission spectra of the GC sample recorded at RT under laser excitation at 930 nm can be seen in Fig. 16. The spectra present the emission lines corresponding to the 2F5/2 → 2F7/2 transitions of the Yb3+ ions and the 4I13/2 → 4I15/2 transitions of the Er3+ ions of interest for the laser output. The Yb3+ 0-phonon line at around 977 nm should be used as the pumping line of the laser diode for the energy transfer giving Er3+ emission within the near IR (1450–1600 nm).
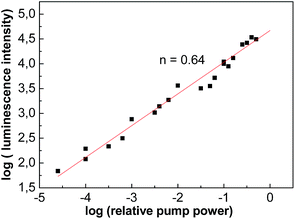
Fig. 17 shows the increase of the luminescence intensity (I) of Er3+ 4I13/2 → 4I15/2 transition with the increase of 977 nm pump power (P). As it is very well known, the emission processes are complex for Er3+ ions and are the result of both down and up-conversion transitions due to radiative and non-radiative energy transfers between Er3+ ions. Consequently, the pump power dependence of the Er3+ near an IR emission intensity at 1550 nm under excitation at 977 nm should convey this complex process. The slope (n) of I = Pn is 0.63, and not unity, which is calculated by linear fitting of dependence of the logarithms of the intensity (I) on the pump power (P).
The evidence of up-conversion processes between Yb3+ and Er3+ ions is given in Fig. 18. Up-conversion visible emission lines at 525 nm and 550 nm (green), and 660 nm (red) are clearly observed under Yb3+ 0-phonon line excitation at 977 nm.
 | ||
| Fig. 18 Up-conversion luminescence of the Er3+ ions in the visible under Yb3+ 0-phonon line excitation at 977 nm. | ||
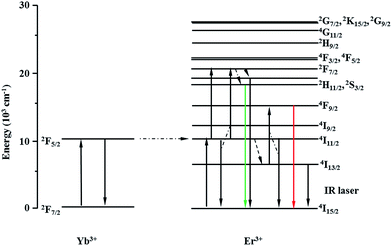
The blue emission at 410 nm is also observed with a very low intensity due to an additional absorption step by up-conversion. By using the energy level diagram in Fig. 18, the emission lines at 410, 525, 560, and 660 nm are attributed to the transitions from 2H9/2, 2H11/2, 4S3/2, and 4F9/2 excited states to the 4I15/2 ground state of Er3+ ions, respectively. The green and red spectral ranges have comparable intensities as those already observed in oxide compounds depending of the values of the gap energy between Er3+ ion levels and the average maximum phonon energy of the host material which is the most critical factor affecting the multi-phonon relaxation in the host material. The lower is the maximum phonon energy, the smaller are the non-radiative rates.
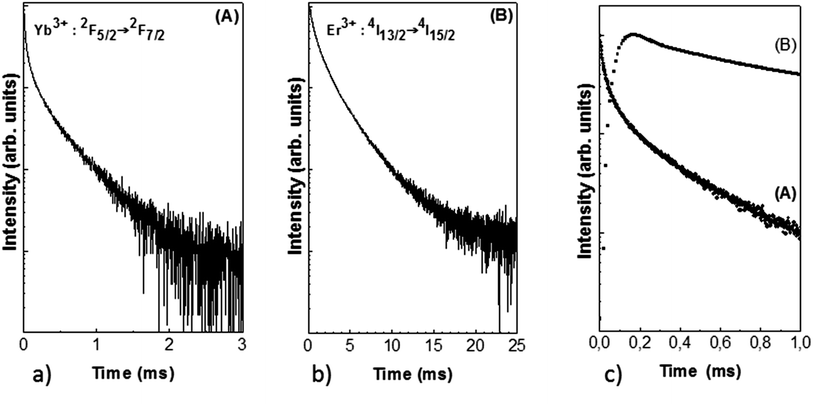
The decays of both Yb3+ and Er3+ ions are seen in Fig. 19. The non-exponential profiles show the complexity of the energy transfer and the presence of multi-sites in the glassy phase and the spinel crystalline phase. The conversion energy between Yb3+ and Er3+ ions is clearly seen in Fig. 19c, by the initial rise time of the Er3+ 4I13/2 energy level after Yb3+ pumping, with a maximum at 0.2 ms in the decay curves.
At last, let us remind that the superposition of the Co2+ absorption and the Er3+ emission around 1550 nm justifies the potential of this GC composition as saturable absorbers.10
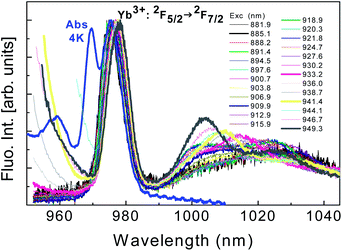 | ||
| Fig. 20 Site selective laser excitation within the range 880–950 nm of Yb3+ ions (the two highest excited levels of the 2F7/2 → 2F5/2 transitions) in the glassy phase of GC at 77 K. | ||
Different excitations of the Ti-sapphire laser pump are mentioned. The absorption spectrum of the sample at 4 K, almost the same as at RT, is indicated in blue as a reference. The first obvious feature is the absence of luminescence emission of Yb3+ ions characterized by the 0-phonon line at 970 nm. Only the Yb3+ 0-phonon lines around 977 nm associated to both SiO2 glass and MgAl2O4 nano-crystal phases are the emitting centers shifted as expected from multi-sites in glass ceramics. In addition we have not detected any energy transfer between the two centers responsible for these two broad absorption lines at 970 and 977 nm, respectively.
In Fig. 21, the site selective laser excitation at 77 K has been applied especially into the two broad 2F7/2 (1) → 2F5/2 (5) 0-phonon lines of Yb3+ ions which were detected in absorption with maxima at around 970 nm and 975 nm. Then, the different excitations are now in the range 966–980 nm. In red and black lines are reported the 2F5/2 (5) → 2F7/2 (1, 2, 3, 4) emission spectra under excitation at 966 nm and 969 nm, respectively, into the new absorption peak present in the GC. In green, dark blue and brown colors are reported the 2F5/2 (5) → 2F7/2 (1, 2, 3, 4) emission spectra under excitation at 974.8 nm, 975.8 nm and 977.8 nm, respectively, into the absorption peak already observed with the glassy phase. We confirm that only the Yb3+ lowest energy peak at 976 nm is giving radiative transitions. We see clearly the resolved Yb3+ emission spectra only under excitation at around 976 nm. A very weak emission is recorded under excitation at around 970 nm, due indeed to the excitation of the foot of the 976 nm absorption line since the overlapping of the two absorption peaks cannot be avoided.
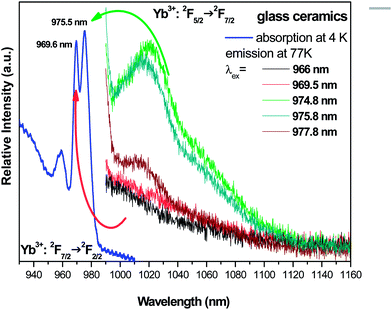 | ||
| Fig. 21 Site selective laser excitation within the two broad 2F7/2 → 2F5/2 0-phonon lines of Yb3+ ions which were detected in absorption at RT and 4 K. | ||
Consequently, the Yb3+ center associated with the line at 970 nm is only absorbing and not emitting. It means that the Yb3+ resolved emission spectra observed in Fig. 21 and 22 can be associated only to pumping of the broad line at around 976 nm and reflect the superposition of the glass and the nano-spinel crystalline phases with higher intensity of Yb3+-doped nano-spinel crystalline due to higher population of ions. We note that unresolved emission spectra of nano-crystals prepared by the sol–gel method19 are not similar to highly resolved spectra of GC in Fig. 20 and 21. The relative high resolution observed in Fig. 20 and 21 leads to admit a lower degree of inversion and then much less disorder inside the nano-crystallites embedded within the glass of the GC, like if the heat treatment from glass to glass ceramic was ordering completely the spinel structure in contrast to the results for Yb3+-doped nano-powders reported in ref. 19.
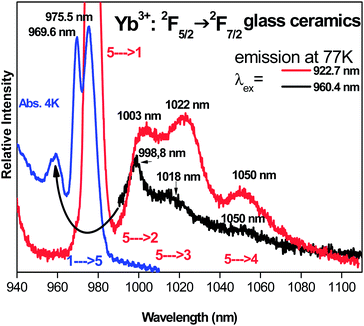
Concerning the Stark components and the vibronic levels of the 2F5/2 excited level seen in the absorption spectra of the glass-ceramics presented in Fig. 13b, unresolved in Fig. 13a in the glassy phase, we have checked in Fig. 22 the emission spectra under two pumping lines at 922.7 nm (red color) and 960.4 nm (black color), respectively. The two emission spectra are even better resolved than spectra in Fig. 20 and 21. Four components of the 2F7/2 ground state are especially well determined at 975.5 nm, 1003 nm, 1022 nm and 1050 nm, respectively. As the strongest signals of both Yb3+ and Er3+ dopants observed by TEM-EDX were associated for spinel nano-crystals, these Yb3+ transitions should belong to the nano-spinel crystallites rather than the glass.
At this point of discussion, we interpret Yb3+ ions, and then the associated neighbor Er3+ ions of similar ionic radii, in both phases but with a higher population of the nano-crystalline one leading to higher fluorescence intensity and better resolution of the emission spectra. As the previous discussion on the emission properties pointed out a radiation-less Yb3+ center associated to the 0-phonon absorption line at 970 nm only within the GC sample, we think that this should be the result of strong perturbation acting on these centers due to the location of Yb3+ ions in the vicinity of the surface of the nano-crystallites. Such localization of this type of Yb3+ quencher ions leads to stronger distortion by the crystal field than those of the regular ions inside the grains.
Another hypothesis is the presence of Yb3+ aggregates at the surface of nano-crystallites so that migration of the energy by resonance between the 0-phonon lines at 970 nm might explain the quenching; however, TEM-EDX results did not detect any segregation of dopants at the interface of nano-crystal or glass and this is why we think that the probability of the formation of aggregates is very weak.
4. Conclusions
The main goal of this work was to conjugate TEM-EDX and optical spectroscopy tools, which is rather rare, for localization of Yb3+, Er3+ and Co2+ dopants in a compact self-Q-switched microchip laser glass ceramics composed of MgAl2O4 spinel nano-crystals of 10–20 nm size embedded in SiO2 glass. First of all, we have shown from spectroscopic properties that the main conditions are fulfilled for obtaining a self-Q-switched microchip laser. The previous analysis had shown that Yb3+ and Er3+ rare earth ions seem to remain in the SiO2 glass matrix, while Co2+ occupy the tetrahedral sites in MgAl2O4 nano-crystals. The use of the TEM-EDX technique led to the result that Yb3+, Er3+ and Co2+ dopants are located in the two phases but rather preferentially located in the spinel nano-crystallites. This important result has been clearly confirmed by the elemental mapping of Yb3+ and Er3+ rare earth ions and also by the direct visualization of these heavier rare earth individual ions. Considering Co2+ ions, our conclusion from absorption spectroscopy is also in favor of the location in the spinel nano-crystallites whereas TEM-EDX measurements could not be accurately applied due to the very low Co2+ concentration. This dopant characterization is worthwhile to be analyzed as a special case where characterization of rare earth and transition metal ions needs the association of both, TEM-EDX and optical spectroscopy tools.In addition, there is no any significant gradient or segregation phenomenon of Yb3+ ions in the area of the interface between the spinel nano-crystals and the vitreous phase. Consequently, aggregates cannot be the main reason of the quenching mechanism as met with the new radiationless Yb3+ center pointed out by the presence of an absorption line at 970 nm of comparable intensity with that of the regular Yb3+ ions inside the grains of the spinel structure. The other Yb3+ ions localized either in the SiO2 glass or in the MgAl2O4 spinel nano-crystalline are surprisingly emitting at almost the same wavelength, around 977 nm with the characteristic of the greatest population coming from the spinel nano-crystalline phase. The most probable assignment of this new radiationless center is to be localized on the strongly perturbed area of the nano-crystallite surface.
This characterization was only made for few samples after checking the feasibility of this compact self-Q-switched microchip laser glass ceramics. Undoubtedly, optimization of Yb3+, Er3+ and Co2+ concentrations is expected in this glass ceramics before any development.
Acknowledgements
We are grateful to the CLYM (Centre Lyonnais de Microscopie, http://www.clym.fr) for its guidance in the Ly-EtTEM (Lyon Environmental tomographic TEM) project, which was financially supported by the CNRS, The Région Rhône-Alpes, The ‘Greater Lyon’ and the French Ministry of Research and Higher Education. We wish to warmly thank the Faculty of Chemistry of the University of Wroclaw for the access of low temperature absorption measurements.Notes and references
- Y. Kalisky, O. Kalisky and M. R. Kokta, Materials, 2008, 30, 1775 CAS.
- Y. Kalisky, A. Ben Amar-Baranga, Y. Shimony and M. R. Kokta, Opt. Mater., 1997, 8, 129 CrossRef CAS.
- Y. Kalisky, A. Ben-Amar Baranga, Y. Shimony, Z. Burshtein, S. A. Pollack and M. Kokta, Opt. Mater., 1996, 6, 275 CrossRef CAS.
- Y. Kalisky, in Progress in Quantum Electronics, ed. R. Scheps and T. Landsberg, 2004, vol. 28, p. 249 Search PubMed.
- W. Chen and G. Boulon, Opt. Mater., 2003, 24, 163–168 CrossRef CAS.
- R. D. Stultz, M. B. Camargo and M. Birnbaum, OSA Proc. Adv. Solid-State Lasers, 1995, 24, 460 Search PubMed.
- K. V. Yumashev, L. A. Denisov, N. N. Posonov, N. V. Kuleshov and R. Moncorge, J. Alloys Compd., 2002, 341, 366 CrossRef CAS.
- P. Li, Y. Li, Y. Sun, X. Hou, H. Zhang and J. Wang, Opt. Express, 2006, 14, 7730 CrossRef CAS.
- X. L. Duan, D. R. Yuan, X. F. Cheng, Z. M. Wang, Z. H. Sun, C. N. Luan, D. Xu and M. K. Lv, Opt. Mater., 2004, 25, 65 CrossRef CAS.
- L. Chen, C. Yu, L. Hu and W. Chen, Solid State Sci., 2012, 14, 287 CrossRef CAS PubMed.
- T. Epicier, G. Boulon, W. Zhao, M. Guzik, B. Jiang, A. Ikesue and L. Esposito, J. Mater. Chem., 2012, 22, 18221 RSC.
- L. Esposito, M. Serantoni, A. Piancastelli, T. Epicier, D. Alderighi, A. Pirri, G. Toci, M. Vannini, S. Anghel and G. Boulon, J. Eur. Cer. Soc., 2012, 32, 2273 CrossRef CAS PubMed.
- G. Boulon, Y. Guyot, M. Guzik, T. Epicier, P. Gluchowski, D. Hreniak and W. Strek, J. Phys. Chem. C, 2014, 118, 15474–15486 CAS.
- W. Zhao, S. Anghel, C. Mancini, D. Amans, G. Boulon, T. Epicier, Y. Shi, X. Q. Feng, Y. B. Pan, V. Chani and A. Yoshikawa, Opt. Mater., 2011, 33, 684 CrossRef CAS PubMed.
- M. O. Ramirez, J. Wisdom, H. Li, Y. L. Aung, J. Stitt, G. L. Messing, V. Dierolf, Z. Liu, A. Ikesue and R. L. Byer, Opt. Express, 2008, 16, 5965 CrossRef CAS.
- W. Zhao, C. Mancini, D. Amans, G. Boulon, T. Epicier, Y. Min, H. Yagi, T. Yanagitani, T. Yanagida and A. Yoshikawa, Jpn. J. Appl. Phys., 2010, 49, 022602 CrossRef.
- W. Zhao, S. Anghel, C. Mancini, D. Amans, G. Boulon, T. Epicier, Y. Shi, X. Q. Feng, Y. B. Pan and V. Chani, et al. , Opt. Mater., 2011, 33, 68400 Search PubMed.
- Y. Guyot, A. Steimacher, M. P. Belançon, A. N. Medina, L. Baesso, S. Lima, L. H. C. Andrade, A. Brenier, A. M. Jurdyc and G. Boulon, JOSA B, 2011, 28(10), 2510–2517 CrossRef CAS.
- R. J. Wiglusz, G. Boulon, Y. Guyot, M. Guzik, D. Hreniak and W. Strek, Dalton Trans., 2014, 43, 7752–7759 RSC.
- V. Singh, V. Kumar Rai, S. Watanabe, T. K. Gundu Rao, L. Badie, I. Ledoux-Rak and Y.-D. Jho, Appl. Phys. B, 2012, 108, 437 CrossRef CAS.
| This journal is © The Royal Society of Chemistry 2014 |

