 Open Access Article
Creative Commons Attribution 3.0 Unported Licence
Two-photon excited fluorescence of BF2 complexes of curcumin analogues: toward NIR-to-NIR fluorescent organic nanoparticles†
Anthony
D'Aléo
*a,
Abdellah
Felouat
a,
Vasile
Heresanu
a,
Alain
Ranguis
a,
Damien
Chaudanson
a,
Artak
Karapetyan
ab,
Michel
Giorgi
c and
Frédéric
Fages
a
aAix Marseille Université, CNRS, CINaM UMR 7325, 13288 Marseille, France. E-mail: daleo@cinam.univ-mrs.fr
bNAS Armenia, Inst Phys Res, Ashtarak 2, Armenia
cAix Marseille Université, CNRS, Spectropole FR 1739, 13397 Marseille, France
First published on 30th April 2014
Abstract
The synthesis of borondifluoride complexes of curcuminoids and one- and two-photon absorption properties of 1 and 2 are described. These compounds allow the preparation of organic nanoparticles that were characterized using DLS, TEM and AFM revealing sizes around 50–60 nm for 2. The fluorescence emission spectra of the nanoparticles are red-shifted compared to those of the dye diluted in dichloromethane solution reaching the NIR region of the spectrum. This effect stems from the occurrence of π–π interactions in the solid state, as revealed from the X-ray crystal structure analysis of 1. Those dyes exhibit a significant two-photon absorption cross-section in solution and nanoparticle suspension in water. The nanoparticles are shown to behave as NIR-to-NIR fluorescent nanomaterials that could be potentially used for studies in the biological transparency window. Two-photon brightnesses of ca. 13–14 GM are obtained for both dyes, which are amongst some of the highest values reported to date for NIR-to-NIR luminophores.
Introduction
The design of two-photon absorbing fluorophores with both large two-photon absorption (TPA) cross-section (σ2) and high fluorescence quantum yield (Φf) remains a very active field of research because of the ever increasing demand for improved bioimaging technologies.1–7 Considerable progress has enabled the generation of diverse classes of molecular probes that are widely used for solution-state applications of two-photon-excited fluorescence (TPEF) spectroscopy.8–14 Recently, luminescent nanoparticles have received much attention in bioimaging,15,16 but organic nanoparticles that exhibit TPEF have been less investigated than their molecular counterparts. The main reason stems from the generally low fluorescence emission capability of organic dyes in the condensed phase. The photophysics of electronically excited organic nanoparticles or nanocrystals is governed by bulk and surface traps that contribute actively to fluorescence quenching depending on the particle size or morphology.17,18 On the other side, Z-scan studies have shown that obtaining a TPA response is not the main limitation and it has even been observed that intermolecular interactions can be exploited to cooperatively enhance the TPA efficiency in assemblies of aggregated dyes.19–25 Yet, designing organic nanoparticles having a large TPEF brightness (Bmax2 = σ2 × Φf) for practical applications remains challenging.2,26–31Among the set of recognized attributes of TPEF spectroscopy,1–7 this technique enables excitation of chromophores in the near infrared (NIR) region, the so-called biological transparency window (i.e. 700–1000 nm), which is not only mandatory for in vivo and in vitro imaging, but also for other applications requiring in-depth measurements. Conversely, for the same reason, achieving emitted light collection in the same energy range would optimize the sensitivity of detection. This would imply for the dye to have a large TPEF brightness in the NIR region, which adds another degree of complexity to the molecular design. While one-photon excited fluorescence (OPEF) emission in the NIR region has been commonly observed in organic molecules32,33 or quantum dots,34–36 examples of dyes combining both NIR TPA and NIR TPEF, coined NIR-to-NIR dyes, are still rare. Maury et al.37 and Wong et al.38 developed NIR-to-NIR imaging agents based on Yb(III) complexes that absorb at 800 nm and 860 nm, respectively, and emit around 1000 nm. Although cyanines represent interesting candidates,39,40 their one-photon absorption (OPA) is often too far in the visible resulting in the NIR TPA response out of the biological window.
Recently, we have reported the synthesis and photophysical properties of borondifluoride complexes of curcuminoids,41 a family of π-conjugated dyes that feature a central β-diketone unit. Curcuminoid ligands have been used as labels in various imaging applications,42–44 including those based on TPA.45,46 Whereas there exists a variety of BF2 complexes of molecules containing the acetylacetonate moiety showing unique optical and electronic properties,47–55 TPA properties,23,56,57 and potential for biological imaging,58 reports on borondifluoride-containing curcuminoids are still scarce.41,59–61 Recently, related water-soluble derivatives have allowed bioimaging based on OPEF emission in the visible region.62 BF2 complexes of curcuminoids bearing two electron donor (D) end-groups and the strong electron acceptor (A) dioxaborine central ring display the donor–acceptor–donor (D–A–D) structure frequently found in TPA active chromophores.8–14
We report herein the first characterization of TPEF properties of BF2 complexes of curminoids, in solution and in the solid state, using two dyes, 1 and 2 (Chart 1). We describe the synthesis of 2, containing the 2-methoxynaphthyl group as the electron donor end-unit. In our previous publication,41 compound 1 has been reported to form nanoparticles showing OPEF in the NIR region. We describe herein the X-ray structure analysis of 1, and the preparation and characterization of organic nanoparticles obtained using 1 and 2. These nanomaterials are shown to be efficient NIR-to-NIR fluorophores.
Results and discussion
Solid-state characterization
Single crystals of 1 were obtained by slow evaporation of ethylacetate.63 A single crystal was mounted on a glass fibre, and diffraction data were acquired using a Mo Kα radiation source (λ = 0.71073 Å). Detailed crystallographic parameters are included in Table S1.† Dye 1 (P−1, Z = 2) crystallizes in the triclinic system with two independent molecules in the asymmetric unit. The two molecules differ by the torsion angle between anisole planes and the dioxaborine plane, one conformer being almost planar and the other highly distorted (torsion angles ca. 16° and 28°). As observed for other types of BF2 complexes,64 the dye molecules are tightly packed in the solid state. They form staggered stacks parallel to the c-axis to minimize dipolar interactions and favour anisole donor–dioxaborine acceptor interactions. Within the stacks, one observes the formation of dimers involving the two planar conformers that are at the van der Waals distance (Fig. 1a). Two distorted conformers interact with one dimer forming a kind of tetrameric structure in which the four dyes experience π-overlap. The interactions between adjacent tetramers are weak because they involve the distorted species (Fig. 1b). Moreover, we checked that the experimental powder diffraction pattern of a microcrystalline sample of 1 obtained by rapid precipitation matches the one calculated from the single crystal structure (Fig. S5†).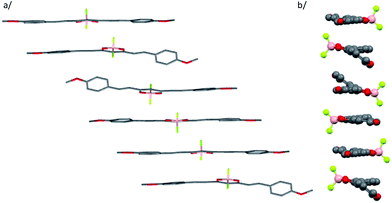 | ||
| Fig. 1 Crystal packing diagram of 1 down the c-axis direction (a), illustrating π–π stacking interactions, and the long molecular axis (b). | ||
Nanoparticles were prepared by quickly adding a concentrated THF solution of the dyes into water according to the classical reprecipitation method.65 In order to optimize the particle size, we prepared THF solutions at six different concentrations for each dye (from ca. 1.85 × 10⁻⁶ to 6.5 × 10⁻⁶ M for 1 and 1.3 × 10⁻⁶ to 4.4 × 10⁻⁶ M for 2). In all samples, the final THF-to-water volume ratio was kept below 1% (v/v) and the suspensions were stored at room temperature. From dynamic light scattering (DLS) measurements (Fig. 2), we noticed that increasing the concentration of the mother solution (i.e. the final dye concentration) strongly influences the particle size distribution for dye 1, with hydrodynamic diameter values increasing from 170 to 285 nm. In contrast, under the same conditions, dye 2 forms smaller nanoparticles (from 64 to 79 nm) whose size is rather insensitive to concentration (Fig. 2). Using electronic absorption spectroscopy and DLS, we could check that the nanoparticle suspensions were stable for at least three weeks at room temperature.
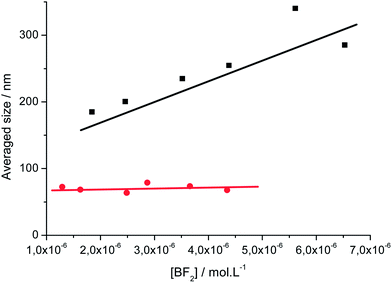 | ||
| Fig. 2 Variation of the averaged size determined by DLS for dye 1 (black) and dye 2 (red) as a function of the total dye concentration. | ||
Transmission electron microscopy (TEM) and atomic force microscopy (AFM) were performed using a sample concentration of 4.4 × 10⁻⁶ M. Complementary information was obtained from TEM observations for samples prepared by depositing 1 μL of a hundred times diluted solution of 4.4 × 10⁻⁶ M of the nanoparticle suspension in water onto a carbon grid and drying was performed at room temperature. For AFM scanning, the sample drop was deposited onto a glass plate and quickly dried in an oven at 120 °C. Under these conditions, both techniques showed the occurrence of isolated nanoparticles and agglomerates. Particles with sizes of ca. 200 nm and 50 nm were observed for 1 (Fig. 3a and c and S7a†) and 2 (Fig. 3b and d and S7b†), respectively. These values are smaller than those given by DLS at this concentration, 235 nm and 67 nm for 1 and 2, respectively, which stems from the fact that DLS leads to a hydrodynamic diameter of aggregates solvated by a shell of water molecules. We conclude therefore that all techniques give consistent results revealing that dye 2 particles are much smaller (ca. 50–60 nm) than those of 1.
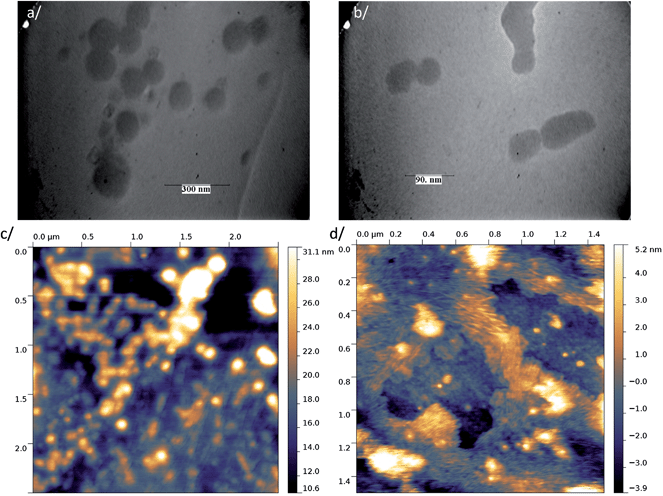 | ||
| Fig. 3 TEM images of the particles of (a) dye 1 and (b) dye 2 and tapping mode topographical AFM images of (c) dye 1 and (d) dye 2. | ||
One-photon spectroscopic properties
The electronic absorption and fluorescence emission of 1 in dichloromethane (DCM) were published elsewhere.41Fig. 4 presents the spectra of 2 and the spectroscopic data are collected in Table 1. Dye 2 exhibits OPA and OPEF features in line with those obtained for related dyes.41 Especially, those spectra show positive solvatochromism and lose their vibronic structure in polar solvents. Using the Lippert–Mataga formalism, linear plots with positive slope values (Fig. S8†) that are close for 1 and 2 were obtained.66–68 These data show that the two dyes present similar charge transfer characteristics in the ground- and excited-states and behave as dipolar rather than quadrupolar systems.69 From the fluorescence lifetime values measured in DCM, the fluorescence radiative kinetic constant rates kf were calculated and found to be superior to 108 s−1 for dyes 1 and 2 showing that the one-photon low-energy transition is highly allowed.41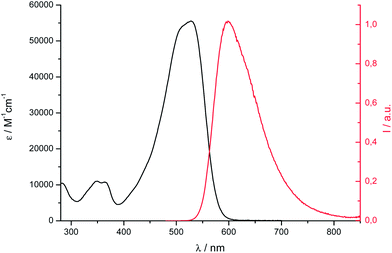 | ||
| Fig. 4 Electronic absorption (conc. ≈ 10−5 M, black) and corrected fluorescence emission (conc. ≈ 10−6 M, λexc at the absorption maximum, red) spectra of 2 in DCM. | ||
| Absorption | Fluorescence | TPEF | ||||||||||
|---|---|---|---|---|---|---|---|---|---|---|---|---|
| Compound | λ abs | ε max | λ em | ΔνST | Φ f | B max | τ f | k f | k nr | λ abs 2 | σ 2 | B max 2 |
| a Absorption maximum wavelengths λabs (nm), molar absorption coefficients εmax (M−1 cm−1), fluorescence maximum wavelengths λem (nm), Stokes shifts ΔνST (cm−1), fluorescence quantum yields Φf, optical brightness Bmax = Φf × ε (M−1 cm−1), fluorescence lifetimes τf (ns), radiative kf (108 s−1) and nonradiative knr = (1 − Φf)/τf (108 s−1) rate constants, TPA maximum wavelengths λabs2 (nm), TPA cross-section at maximum σ2 (GM) and two-photon brightness Bmax2 = Φf × σ2 (GM). b On powder sample. c Biexponential decay was found. | ||||||||||||
| 1 (DCM) | 488 | 75![[thin space (1/6-em)]](https://www.rsc.org/images/entities/char_2009.gif) 480 480 |
538 | 1904 | 0.44 | 33![[thin space (1/6-em)]](https://www.rsc.org/images/entities/char_2009.gif) 211 211 |
1.30 | 3.4 | 4.3 | 770 | 155 | 68 |
| 2 (DCM) | 528 | 55![[thin space (1/6-em)]](https://www.rsc.org/images/entities/char_2009.gif) 580 580 |
598 | 2217 | 0.20 | 11![[thin space (1/6-em)]](https://www.rsc.org/images/entities/char_2009.gif) 116 116 |
1.59 | 1.2 | 5.8 | 890 | 195 | 39 |
| 1 (water) | 451 | 34![[thin space (1/6-em)]](https://www.rsc.org/images/entities/char_2009.gif) 170 170 |
710 (718)b | 8088 | 0.06 (0.05)b | 2734 | 6.44 | 0.09 | 1.5 | 780 | 210 | 13 |
| 2 (water) | 520 | 24![[thin space (1/6-em)]](https://www.rsc.org/images/entities/char_2009.gif) 780 780 |
717 (718)b | 5284 | 0.045 (0.125)b | 1115 | 1.4, 2.8c | — | — | 900 | 305 | 14 |
A preliminary investigation showed fluorescence emission of a colloidal suspension of dye 1.41 The solid-state optical properties of dyes 1 and 2 are investigated herein in more detail (Fig. 5, Table 1). Upon adding incremental volumes of water into a THF solution of the dyes, a gradual red-shift of the absorption and emission spectra can be seen (Fig. S9 and S10†). The change in Stokes shift linearly parallels that of the solvent polarity parameter (Δf′) in the Lippert–Mataga plots until the polarity of the solvent mixture reaches a threshold (Fig. S11†). Above this critical value, nanoparticles form, inducing an abrupt change in the Lippert–Mataga slope and a modification of the absorption profile.
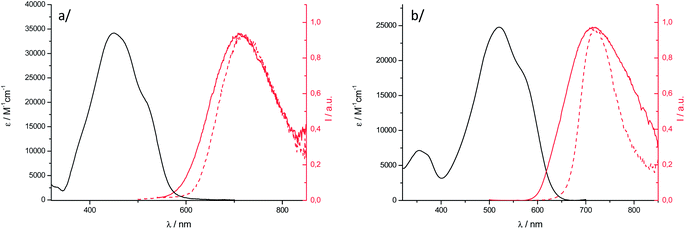 | ||
Fig. 5 Electronic absorption of nanoparticles ( ) and fluorescence emission spectra ( ) and fluorescence emission spectra ( ) of nanoparticles in water and powder samples ( ) of nanoparticles in water and powder samples ( ) for (a) 1 and (b) 2. ) for (a) 1 and (b) 2. | ||
The electronic absorption spectrum of nanoparticles of 1 is blue shifted relative to the solution and its shape is characteristic of excitonically coupled chromophores in an H-type arrangement, in agreement with the X-ray structure analysis. In the case of 2, compared to 1, the OPA solid-state spectrum is less affected than that of the solution, a red-shifted shoulder being observed. The solid-state OPEF emission spectra display a structureless symmetrical band that is sharper for the microcrystalline powder than for nanoparticles, especially in the case of 2. The maximum emission wavelengths are red-shifted compared to the one on the DCM solution and found in the NIR region, above 710 nm. The shape of the spectra is typical of strongly interacting dipolar dyes and is due to strong π-overlap in the crystal leading to broad emission with strong charge transfer character.17 Such behaviour was especially noticed for BF2 complexes of 2′-hydroxychaclone derivatives.64 The fluorescence quantum yields are around 5% for nanoparticle suspensions, which represents a quite high value for aggregated organic dyes emitting in the NIR region. We emphasize that the value of 12.5% obtained for a microcrystalline powder sample of 2 emitting at 718 nm is not common.
The fluorescence lifetimes of the nanoparticles were measured in water. The fluorescence decay of 2 is fitted by a bi-exponential curve (Fig. S12†). The associated lifetimes are short, with one component being close to the solution-state value, which, considering also the shape of the absorption spectrum, may indicate the presence of non-perturbed chromophores in the aggregates. Such spectroscopic heterogeneity is frequent in small size aggregates where chromophores can exist in different environments.18 Consistently, the fluorescence decay of nanoparticles of 1, whose size is four times larger than that of 2, follows a mono-exponential behaviour. The long lifetime value of 6.44 ns leads to a drop of kf by at least one order of magnitude relative to the DCM solution, which is consistent with the less allowed low-energy transition in an H-type solid-state arrangement.
TPEF properties
Two-photon emission and excitation spectra were recorded in the 700–1000 nm wavelength range using a femtosecond Ti-sapphire pulsed laser source, according to the experimental protocol described by Webb.70 The observation of a quadratic dependence of the fluorescence intensity versus incident laser power at several wavelengths unambiguously confirmed that the origin of the fluorescence emission can be assigned to a TPA process in both DCM solution and water suspension (Fig. S13†). In the experimental laser power range used for these measurements, we checked that no saturation or photodegradation occurred. Fig. 6 shows the two-photon excitation spectra of 1 and 2 in DCM, calibrated using coumarin-307 and rhodamine B as a reference.70 Dye 1 has a TPA cross-section σ2 of 155 GM at 770 nm (Table 1) while dye 2 has its maximum red-shifted to 890 nm and a similar value of σ2. Therefore, the nature of the electron-donor end-group has a strong influence on the TPA maximum wavelength in solution. It is noteworthy that the OPA maxima of 1 and 2 differ by only 40 nm.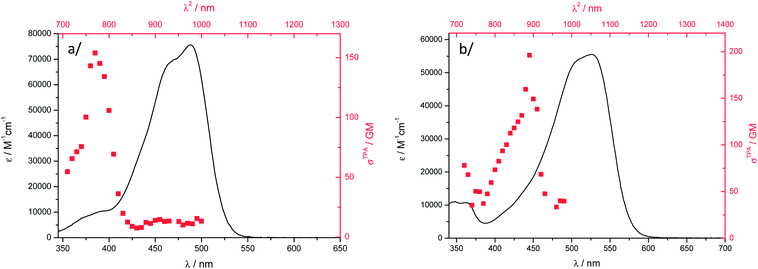 | ||
Fig. 6 Two-photon excitation ( , higher x-coordinate and , higher x-coordinate and  , right y-coordinate), OPA spectra ( , right y-coordinate), OPA spectra ( , lower x-coordinate and , lower x-coordinate and  , left y-coordinate) in DCM: (a) 1 and (b) 2. , left y-coordinate) in DCM: (a) 1 and (b) 2. | ||
The nonlinear absorption band is found strongly blue-shifted for both dyes and clearly does not match the S0–S1 OPA transition, which is often observed for D–A–D chromophores.39,69,71,72 It has been assigned to a TPA-allowed transition lying at higher energy,71 or to localization of the excitation in one of the two halves of the chromophore as a result of vibration- or polar solvation-induced symmetry breaking in the ground- or excited-state as observed for cyanine derivatives for example.39,69,72 The lowest-energy transition in 1 is not completely TPA forbidden, a σ2 of ca. 10–15 GM being determined (Fig. 6a). The same observation probably holds for 2 but the TPA spectrum in this wavelength range is not experimentally accessible with our experimental setup.
The two-photon excitation spectra of nanoparticle suspensions of 1 and 2 are given in Fig. 7. Nanoparticles do exhibit a strong nonlinear response in water and the TPA cross-sections are 40 to 50% larger than those in DCM. Such enhancement of σ2 in aggregated chromophores has already been observed for other chromophores.19–25 As noticed for TPA in DCM, the two-photon excitation band does not match the lowest-energy OPA transition and is located at higher energy. Actually, this result is fortunate yielding two-photon excitation that remains below 1000 nm (i.e. the upper transparency limit of the biological window). The TPA maxima are almost at the same position than in DCM, a bathochromic shift of 10 nm being noticed. The TPA brightnesses of 13 GM (λabs2 = 780 nm) and 14 GM (λabs2 = 900 nm) for 1 and 2, respectively are smaller than those in DCM solution. This stems from the lower Φf for the aggregated dyes (Table 1). However, the Bmax2 values of 1 and 2 remain larger than those determined for the only cases of NIR-to-NIR probes reported to date. For ytterbium complexes, it is the low luminescence quantum yield of the lanthanide species that limits the TPEF response. Water-soluble heptamethine cyanines instead display high Φf (up to 30%) but limited TPA cross-sections.73 In all these literature cases, Bmax2 did not exceed 10 GM, which anyway allowed using them as NIR-to-NIR labels for bioimaging purposes.
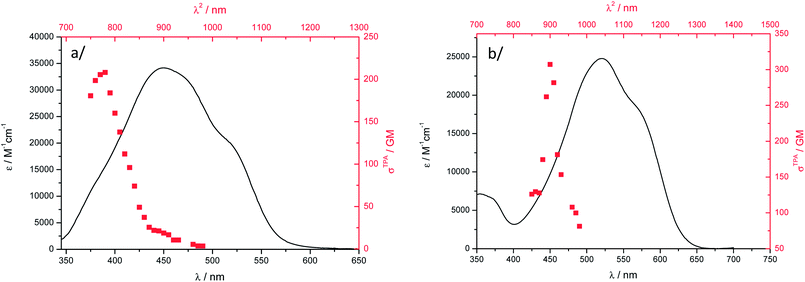 | ||
Fig. 7 Two-photon excitation spectra ( , higher x-coordinate and , higher x-coordinate and  , right y-coordinate) and OPA absorption spectra ( , right y-coordinate) and OPA absorption spectra ( , lower x-coordinate and , lower x-coordinate and  , left y-coordinate) of particles in water: (a) 1 and (b) 2. , left y-coordinate) of particles in water: (a) 1 and (b) 2. | ||
Conclusions
We have presented the first investigation of the TPEF properties of two borondifluoride complexes of curcuminoids. The data show that these compounds possess effective TPA cross-sections, making them interesting candidates as TPEF reporters. The two dyes under investigation form nanoparticles in water that combine NIR TPEF and NIR TPA with practical values of the TPA brightness (14 GM), which are, to the best of our knowledge, among the highest values for dyes with emission maxima above 700 nm. These molecules represent a new class of NIR-to-NIR fluorophores. This study also shows that the choice of the aromatic endgroup is crucial to the control of a number of parameters: hydrophilic/lipophilic balance, particle size, exciton coupling within the aggregate, solid-state packing, absorption and emission maximum wavelengths, solution- and solid-state values of Bmax2, to mention the main ones. We are currently working at the optimization of those parameters by changing the chemical structure of the curcuminoid end-groups and introducing substituents at the meso position of the dioxaborine ring.41Experimental section
Two-photon excited fluorescence measurements
The TPA cross-section spectra were obtained by up-conversion fluorescence using a tunable mode-locked Ti:sapphire femtosecond laser oscillator (Mai-Tai HP Spectra Physics) at a repetition rate of 80 MHz in the range 690–1060 nm. The excitation beam is focalized with a microscope objective (20×/0.40, LD Epiplan Zeiss) at the middle of the fluorescence cell (10 mm). The average power of the fundamental laser beam was controlled by a glan polarizer combined with a λ/2 wave plate. The fluorescence, collected at 90° to the excitation beam, was focused using a short focus, large diameter quartz lens into a gated intensified CCD device (Pi-Max2, Princeton Instruments) coupled to a double grating monochromator (Acton SP500i, Princeton Instruments). The luminescence light was transmitted through an appropriate optical filter to eliminate the scattered excitation light. Photoluminescence spectra were recorded for one broad band excitation wavelength in the range 710–1000 nm, keeping the excitation laser power constant. The incident beam intensity was adjusted to 50 mW in DCM solution and 75 mW for particles in water in order to ensure an intensity-squared dependence of the fluorescence over the whole spectral range. The detector integration time was fixed to 1 second. Calibration of the spectra was performed by comparison with the published 700–1000 nm coumarin-307 and rhodamine B two-photon absorption spectra.70 The measurements were carried out three times independently at room temperature in dichloromethane and in water at optical densities varying from 0.1 to 0.3. The detector was corrected according to the procedure described by Parker.74 The observed photomultiplier output A1 was recorded at wavelength λ, which corresponds to the apparent emission spectrum. A1 is given by eqn (1), where F1 and S1 are the corrected emission spectrum and the spectroscopic sensitivity factor of the monochromator–photomultiplier setup, respectively.| A1 = (F1)(S1)/λ2 | (1) |
To calculate S1, we used 4-N,N-dimethylamino-4′-nitrostilbene (DMANS) as a standard NIR fluorophore for which its corrected emission spectrum has been precisely determined.75
Acknowledgements
The authors would like to thank Dr Wladimir Marine for his help in setting up the two-photon excitation set-up and Dr Serge Nitsche for his help in the TEM measurements.References
- C. Andraud and O. Maury, Eur. J. Inorg. Chem., 2009, 4343 CrossRef.
- X. Wang, A. R. Morales, T. Urakami, L. Zhang, M. V. Bondar, M. Komatsu and K. D. Belfield, Bioconjugate Chem., 2011, 22, 1438–1450 CrossRef CAS PubMed.
- S. Yao and K. D. Belfield, Eur. J. Inorg. Chem., 2012, 3199–3217 CrossRef CAS.
- E. De Meulenaere, W.-Q. Chen, S. Van Cleuvenbergen, M.-L. Zheng, S. Psilodimitrakopoulos, R. Paesen, J.-M. Taymans, M. Ameloot, J. Vanderleyden, P. Loza-Alvarez, X.-M. Duan and K. Clays, Chem. Sci., 2012, 3, 984–995 RSC.
- A. D'Aléo, F. Pointillart, L. Ouahab, C. Andraud and O. Maury, Coord. Chem. Rev., 2012, 256, 1604–1620 CrossRef PubMed.
- X. J. Feng, P. L. Wu, F. Bolze, H. W. C. Leung, K. F. Li, N. K. Mak, D. W. J. Kwong, J.-F. Nicoud, K. W. Cheah and M. S. Wong, Org. Lett., 2010, 12, 2194–2197 CrossRef CAS PubMed.
- H. Ftouni, F. Bolze, H. de Rocquigny and J.-F. Nicoud, Bioconjugate Chem., 2013, 24, 942–950 CrossRef CAS PubMed.
- G. S. He, L.-S. Tan, Q. Zheng and P. N. Prasad, Chem. Rev., 2008, 108, 1245–1330 CrossRef CAS PubMed.
- F. Terenziani, C. Katan, E. Badaeva, S. Tretiak and M. Blanchard-Desce, Adv. Mater., 2008, 20, 4641–4678 CrossRef CAS.
- J. M. Hales, J. Matichak, S. Barlow, S. Ohira, K. Yesudas, J.-L. Brédas, J. W. Perry and S. R. Marder, Science, 2010, 1485–1488 CrossRef CAS PubMed.
- O. V. Przhonska, S. Webster, L. A. Padilha, H. Hu, A. D. Kachkovski, D. J. Hagan and E. W. Van Stryland, in Advanced Fluorescence Reporters in Chemistry and Biology I, Springer series on Fluorecence, 2010, vol. 8, pp. 105–147 Search PubMed.
- Z. Li, Y. Liu, H. Kim, J. M. Hales, S.-H. Jang, J. Luo, T. Baehr-Jones, M. Hochberg, S. R. Marder, J. W. Perry and A. K. Y. Jen, Adv. Mater., 2012, 24, OP326–OP330 CAS.
- K. Matsui, Y. Segawa, T. Namikawa, K. Kamada and K. Itami, Chem. Sci., 2013, 4, 84–88 RSC.
- K. Kamada, S.-I. Fuku-en, S. Minamide, K. Ohta, R. Kishi, M. Nakano, H. Matsuzaki, H. Okamoto, H. Higashikawa, K. Inoue, S. Kojima and Y. Yamamoto, J. Am. Chem. Soc., 2013, 135, 232–241 CrossRef CAS PubMed.
- A. Kaeser and A. P. H. J. Schenning, Adv. Mater., 2010, 22, 2985–2997 CrossRef CAS PubMed.
- S. Fery-Forgues, Nanoscale, 2013, 5, 8428–8442 RSC.
- J. Gierschner and S. Y. Park, J. Mater. Chem. C, 2013, 1, 5818–5832 RSC.
- J. Gierschner, L. Lüer, B. Milián-Medina, D. Oelkrug and H.-J. Egelhaaf, J. Phys. Chem. Lett., 2013, 4, 2686–2697 CrossRef CAS.
- E. Collini, Phys. Chem. Chem. Phys., 2012, 14, 3725–3736 RSC.
- S. Kim, Q. Zheng, G. S. He, D. J. Bharali, H. E. Pudavar, A. Baev and P. N. Prasad, Adv. Funct. Mater., 2006, 16, 2317–2323 CrossRef CAS.
- Z. Xu, Q. Liao, Y. Wu, W. Ren, W. Li, L. Liu, S. Wang, Z. Gu, H. Zhang and H. Fu, J. Mater. Chem., 2012, 22, 17737–17743 RSC.
- G. D'Avino, F. Terenziani and A. Painelli, J. Phys. Chem. B, 2006, 110, 25590–25592 CrossRef CAS PubMed.
- H. Hu, D. A. Fishman, A. O. Gerasov, O. V. Przhonska, S. Webster, L. A. Padilha, D. Peceli, M. Shandura, Y. P. Kovtun, A. D. Kachkovski, I. H. Nayyar, A. m. E. Masunov, P. Tongwa, T. V. Timofeeva, D. J. Hagan and E. W. Van Stryland, J. Phys. Chem. Lett., 2012, 3, 1222–1228 CrossRef CAS.
- Y. Zhang, B. Kim, S. Yao, M. V. Bondar and K. D. Belfield, Langmuir, 2013, 29, 11005–11012 CrossRef PubMed.
- T. Ishi-i, S. Amemori, C. Okamura, K. Yanaga, R. Kuwahara, S. Mataka and K. Kamada, Tetrahedron, 2013, 69, 29–37 CrossRef CAS PubMed.
- J. Geng, K. Li, D. Ding, X. Zhang, W. Qin, J. Liu, B. Z. Tang and B. Liu, Small, 2012, 8, 3655–3663 CrossRef CAS PubMed.
- V. Parthasarathy, S. Fery-Forgues, E. Campioli, G. Recher, F. Terenziani and M. Blanchard-Desce, Small, 2011, 7, 3219–3229 CrossRef CAS PubMed.
- E. Ishow, A. Brosseau, G. Clavier, K. Nakatani, P. Tauc, C. Fiorini-Debuisschert, S. Neveu, O. Sandre and A. Léaustic, Chem. Mater., 2008, 20, 6597–6599 CrossRef CAS.
- Y. Jiang, Y. Wang, J. Hua, J. Tang, B. Li, S. Qian and H. Tian, Chem. Commun., 2010, 46, 4689–4691 RSC.
- S. B. Noh, R. H. Kim, W. J. Kim, S. Kim, K.-S. Lee, N. S. Cho, H.-K. Shim, H. E. Pudavar and P. N. Prasad, J. Mater. Chem., 2010, 20, 7422–7429 RSC.
- J. Massin, A. Charaf-Eddin, F. Appaix, Y. Bretonnière, D. Jacquemin, B. van der Sanden, C. Monnereau and C. Andraud, Chem. Sci., 2013, 4, 2833–2843 RSC.
- S. A. Hilderbrand and R. Weissleder, Curr. Opin. Chem. Biol., 2010, 14, 71–79 CrossRef CAS PubMed.
- A. Yuan, J. Wu, X. Tang, L. Zhao, F. Xu and Y. Hu, J. Pharm. Sci., 2013, 102, 6–28 CrossRef CAS PubMed.
- R. G. Aswathy, Y. Yoshida, T. Maekawa and D. S. Kumar, Anal. Bioanal. Chem., 2010, 397, 1417–1435 CrossRef CAS PubMed.
- J. Gao, X. Chen and Z. Cheng, Curr. Top. Med. Chem., 2010, 10, 1147–1157 CrossRef CAS.
- Q. Ma and X. Su, Analyst, 2010, 135, 1867–1877 RSC.
- A. D'Aléo, A. Bourdolle, S. Brustlein, T. Fauquier, A. Grichine, A. Duperray, P. L. Baldeck, C. Andraud, S. Brasselet and O. Maury, Angew. Chem., Int. Ed., 2012, 51, 6622–6625 CrossRef PubMed.
- T. Zhang, X. Zhu, C. C. W. Cheng, W.-M. Kwok, H.-L. Tam, J. Hao, D. W. J. Kwong, W.-K. Wong and K.-L. Wong, J. Am. Chem. Soc., 2011, 133, 20120–20122 CrossRef CAS PubMed.
- H. Hu, O. V. Przhonska, F. Terenziani, A. Painelli, D. Fishman, T. R. Ensley, M. Reichert, S. Webster, J. L. Bricks, A. D. Kachkovski, D. J. Hagan and E. W. Van Stryland, Phys. Chem. Chem. Phys., 2013, 15, 7666–7678 RSC.
- L. A. Padilha, S. Webster, O. V. Przhonska, H. Hu, D. Peceli, T. R. Ensley, M. V. Bondar, A. O. Gerasov, Y. P. Kovtun, M. P. Shandura, A. D. Kachkovski, D. J. Hagan and E. W. V. Stryland, J. Phys. Chem. A, 2010, 114, 6493–6501 CrossRef CAS PubMed.
- A. Felouat, A. D'Aléo and F. Fages, J. Org. Chem., 2013, 78, 4446–4455 CrossRef CAS PubMed.
- M. Garcia-Alloza, L. A. Borrelli, A. Rozkalne, B. T. Hyman and B. J. Bacskai, J. Neurochem., 2007, 102, 1095–1104 CrossRef CAS PubMed.
- D. Yanagisawa, T. Amatsubo, S. Morikawa, H. Taguchi, M. Urushitani, N. Shirai, K. Hirao, A. Shiino, T. Inubushi and I. Tooyama, Neuroscience, 2011, 184, 120–127 CrossRef CAS PubMed.
- J. Chittigori, A. Kumar, L. Li, S. Thota, A. Kokil, L. A. Samuelson, D. J. Sandman and J. Kumar, Tetrahedron, 2014, 70, 991–995 CrossRef CAS PubMed.
- A. Kunwar, A. Barik, B. Mishra, K. Rathinasamy, R. Pandey and K. I. Priyadarsini, Biochim. Biophys. Acta, Gen. Subj., 2008, 1780, 673–679 CrossRef CAS PubMed.
- A. Kumar, L. Li, A. Chaturvedi, J. Brzostowski, J. Chittigori, S. Pierce, L. A. Samuelson, D. Sandman and J. Kumar, Appl. Phys. Lett., 2012, 100, 203701–203704 CrossRef PubMed.
- H. Maeda, Y. Bando, K. Shimomura, I. Yamada, M. Naito, K. Nobusawa, H. Tsumatori and T. Kawai, J. Am. Chem. Soc., 2011, 133, 9266–9269 CrossRef CAS PubMed.
- K. Ono, A. Nakashima, Y. Tsuji, T. Kinoshita, M. Tomura, J.-i. Nishida and Y. Yamashita, Chem.–Eur. J., 2010, 16, 13539–13546 CrossRef CAS PubMed.
- G. Zhang, J. Lu, M. Sabat and C. L. Fraser, J. Am. Chem. Soc., 2010, 132, 2160–2162 CrossRef CAS PubMed.
- G. Zhang, J. Chen, S. J. Payne, S. E. Kooi, J. N. Demas and C. L. Fraser, J. Am. Chem. Soc., 2007, 129, 8942–8943 CrossRef CAS PubMed.
- J. M. Hales, S. Zheng, S. Barlow, S. R. Marder and J. W. Perry, J. Am. Chem. Soc., 2006, 128, 11362–11363 CrossRef CAS PubMed.
- C. Risko, E. Zojer, P. Brocorens, S. R. Marder and J. L. Brédas, Chem. Phys., 2005, 313, 151–157 CrossRef CAS PubMed.
- B. Domercq, C. Grasso, J.-L. Maldonado, M. Halik, S. Barlow, S. R. Marder and B. Kippelen, J. Phys. Chem. B, 2004, 108, 8647–8651 CrossRef CAS.
- J. Fabian and H. Hartmann, J. Phys. Org. Chem., 2004, 17, 359–369 CrossRef CAS.
- Y. L. Chow, C. I. Johansson, Y.-H. Zhang, R. Gautron, L. Yang, A. Rassat and S.-Z. Yang, J. Phys. Org. Chem., 1996, 9, 7–16 CrossRef CAS.
- M. Halik, W. Wenseleers, C. Grasso, F. Stellacci, E. Zojer, S. Barlow, J.-L. Bredas, J. W. Perry and S. R. Marder, Chem. Commun., 2003, 1490–1491 RSC.
- E. Cogné-Laage, J.-F. Allemand, O. Ruel, J.-B. Baudin, V. Croquette, M. Blanchard-Desce and L. Jullien, Chem.–Eur. J., 2004, 10, 1445–1455 CrossRef PubMed.
- A. Pfister, G. Zhang, J. Zareno, A. F. Horwitz and C. L. Fraser, ACS Nano, 2008, 2, 1252–1258 CrossRef CAS PubMed.
- K. Liu, J. Chen, J. Chojnacki and S. Zhang, Tetrahedron Lett., 2013, 54, 2070–2073 CrossRef CAS PubMed.
- C. Ran, X. Xu, S. B. Raymond, B. J. Ferrara, K. Neal, B. J. Bacskai, Z. Medarova and A. Moore, J. Am. Chem. Soc., 2009, 131, 15257–15261 CrossRef CAS PubMed.
- X. Zhang, Y. Tian, Z. Li, X. Tian, H. Sun, H. Liu, A. Moore and C. Ran, J. Am. Chem. Soc., 2013, 135, 16397–16409 CrossRef CAS PubMed.
- G. Bai, C. Yu, C. Cheng, E. Hao, Y. Wei, X. Mu and L. Jiao, Org. Biomol. Chem., 2014, 12, 1618 CAS.
- ESI.†.
- A. D'Aléo, D. Gachet, V. Heresanu, M. Giorgi and F. Fages, Chem.–Eur. J., 2012, 18, 12764–12772 CrossRef PubMed.
- H. Kawai, H. S. Nalwa, H. Oikawa, S. Okada, H. Matsuda, N. Minami, A. Kakuda, K. Ono, A. Mukoh and H. Nakanishi, Jpn. J. Appl. Phys., 1992, 31, L1132–L1134 CrossRef.
- E. Lippert, Z. Naturforsch., 1955, 10a, 541–545 CAS.
- E. Z. Mataga, Y. Kaifu and M. Koizumi, Bull. Chem. Soc. Jpn., 1956, 29, 465–470 CrossRef.
- E. Lippert, Z. Elektrochem., 1957, 61, 962–975 CAS.
- F. Terenziani, A. Painelli, C. Katan, M. Charlot and M. Blanchard-Desce, J. Am. Chem. Soc., 2006, 128, 15742–15755 CrossRef CAS PubMed.
- C. Xu and W. W. Webb, J. Opt. Soc. Am. B, 1996, 13, 481–491 CrossRef CAS.
- W. M. McClain, Acc. Chem. Res., 1974, 7, 129–135 CrossRef CAS.
- Q. Bellier, N. S. Makarov, P.-A. Bouit, S. Rigaut, K. Kamada, P. Feneyrou, G. Berginc, O. Maury, J. W. Perry and C. Andraud, Phys. Chem. Chem. Phys., 2012, 14, 15299–15307 RSC.
- L. Wang, J. Jin, X. Chen, H.-H. Fan, B. K. F. Li, K.-W. Cheah, N. Ding, S. Ju, W.-T. Wong and C. Li, Org. Biomol. Chem., 2012, 10, 5366–5370 CAS.
- C. A. Parker, Photoluminescence of Solutions, Elsevier Publishing, Amsterdam, 1969 Search PubMed.
- J. R. Lakowicz, Principles of Fluorescence Spectroscopy, Kluwer, New-York (NY), 2006 Search PubMed.
Footnote |
| † Electronic supplementary information (ESI) available. CCDC 987442. For ESI and crystallographic data in CIF or other electronic format see DOI: 10.1039/c4tc00543k |
| This journal is © The Royal Society of Chemistry 2014 |

