 Open Access Article
Green synthesis of nanobelt-membrane hybrid structured vanadium oxide with high electrochromic contrast†
Wenbin
Kang
,
Chaoyi
Yan
,
Xu
Wang
,
Ce Yao
Foo
,
Alvin Wei
Ming Tan
,
Kenji Jian
Zhi Chee
and
Pooi See
Lee
*
School of Material Science and Engineering, Nanyang Technological University, 50 Nanyang Avenue, Singapore 639798. E-mail: pslee@ntu.edu.sg
First published on 19th March 2014
Abstract
Vanadium oxide with a nanobelt-membrane hybrid structure is synthesized under the structural directing effect from tannic acid, a green extract from plants. The electrochromic property of the resultant film was investigated and revealed a high contrast of 62% at the wavelength of 700 nm. Furthermore, with linear polyethylenimine (LPEI) surface treatment on ITO glass, the stability of the drop-casted film is greatly enhanced with only 18.6% reduction in transmission after 100 cycles.
Introduction
With the ever increasing pollution of the world following the rapid urbanization and technological advancement, green chemistry has been brought to the table with escalating importance over recent years. Simultaneously developing useful products, advancing the underlying science and instituting a green nanoscience deployment have been the key challenge. Some efforts have been channelled into green chemical synthesis of metal oxides such as utilizing urea, glycerol, or microwave assisted low temperature growth to enhance the electrochemical properties mainly for energy storage applications.1–3 However, little effort has been reported in deploying green chemistry for electrochromic applications.Electrochromism has been gaining increasing attention recently due to its capability of tuning down energy consumption with its application in smart glass industry. The volume of smart glass produced is forecast to grow from approximately 1.4 million sq ft in 2013 to approximately 929 million sq ft by 2022, which corresponds to an annual value of smart glass market of $88 million in 2013 to $899 million by 2022, according to a report by the London office of Navigant Research.4 There are three types of smart glasses: electrochromic, suspended particle and thermochromic. Electrochromic glass offers the highest performance among these types when it comes to energy saving. Compared to regular ASHRAE 90.1-1999 house configuration, for windows with WWR (window-to wall ratio) 0.6, electrochromic windows are able to deliver a 10–24% energy saving, 10–15% peak demand reduction in most climates; for hot climates, it adds to another 0–5% peak demand reduction.5,6 Electrochromic glass comes at a typical cost of $45 to $70 per square foot. By comparison, low emissivity glass typically costs between $5 and $15 per square foot.7 For electrochromic glass to dominate the market, competitive pricing is a clear prerequisite.8 Having a test-bed for the deployment of green nanotechnology for electrochromism will serve the multipurpose objectives of achieving a high electrochromic performance for reduced energy consumption while adopting a sustainable formulation to its building blocks, cutting down technological cost and speeding up the marketing process.
A requirement for electrochromic materials is electrochemical redox materials with the ability to modulate the transmittance upon voltage application. Solution processible nanomaterials have been of interest due to the fast switching time, ease of coatings on nonformable substrates and facile and low cost preparation. To achieve these performances, the electrochromic nanostructures should possess desirable crystal structures for facile ion intercalation with a short ionic diffusion distance, large electrochemical surface area for fast ion transport and good interconnectivity for electronic conductivity. To harness the benefit of green synthesis, we adopted a green resource, tannic acid, to synthesize the electrochromic nanostructures of vanadium oxides. This work represents one of the first attempts to employ green nanotechnology for electrochromism for green building. The resultant material composed of a unique hybrid structure of nanobelt dispersed in a membrane that allows us to satisfy the superior electrochromic requirements delineated. This work demonstrated the feasibility of deploying green chemistry to design and realize nanomaterials with unique properties that culminated extra benefits and pave the way for the search and development for sustainable materials development and their device fabrication.
Tannic acid is a type of green material which is extracted from natural tree bark and leaves. Because of its multiple phenol groups, it has been used as a great chelating agent with metal ions9,10 and due to the steric hindrance effect from the aromatic ring, metal particles reduced by tannic acid are prevented from aggregation.11,12 Thus, it is viable that tannic acid can help in shaping and defining the morphology during nanomaterial synthesis.
Due to its layered structure, which facilitates ion intercalation, vanadium oxide (V2O5) is continuously attracting the attention from researchers and it is widely applied in different areas like lithium battery,13–17 supercapacitor,18–21 catalyst,22 electrochromic23–28 device etc. There are various methods to synthesize vanadium oxide for these diverse applications, like solvothermal,14,29 sol–gel,30,31 hydrothermal,23,32 chemical vapor deposition,33 spray pyrolysis,34,35 electrochemical methods27,36,37 and so on.
Vanadium oxide exhibits an orange and green-blue colour at a positive and negative potential respectively; it is often used as a complementary electrode38 due to the low chromic contrast of less than 50% (ref. 23, 27, 39 and 40) in the visible range of light spectrum. Besides, the long switching time, sometimes up to hundreds of seconds of pristine vanadium pentoxide,41 and the poor stability manifested by a severe peeling within cycles25,39 limit its practicality as a material for commercial applications.
In this work, the synthesized vanadium pentoxide with a nanobelt-membrane hybrid structure shows a high optical modulation of 62% in the visible range with a good cycling stability, making it a suitable choice for smart window application.
Experimental section
Sample preparation
Hydrothermal synthesis was carried out for vanadium oxide: 0.15 g VOSO4 dissolved in 25 ml DI water and then 0.025 g tannic acid was added to the system to form a dark blue solution. After that, 1 M H2SO4 was added drop-wise to tune the pH to around 1.6 before adding 8 ml 30% H2O2 to the solution. The resultant orange solution was then put into an autoclave and kept at 180 °C for 24 h after which a gel-like orange aggregation was formed. The weak gel was shaken to redisperse it in water and washed via centrifuge alternatively with water and ethanol for several times. The resultant powder form of vanadium oxide was mixed with water to form a suspension and was drop-casted on ITO glass to form the electrochromic thin film with a thickness of around 712 nm (refer to ESI and FS 1† for the detailed process).ITO surface treatment
The surface treatment was carried out following the procedure outlined in our previous work.39 Briefly, ITO/glass was washed thoroughly in ethanol, then water, and dried via purging with nitrogen gas before immersing in 1 mg L−1 aqueous linear polyethylenimine(LPEI, Mw 25![[thin space (1/6-em)]](https://www.rsc.org/images/entities/char_2009.gif) 000) solution for 20 min with pH of 2.5 adjusted by 1 M HCl.
000) solution for 20 min with pH of 2.5 adjusted by 1 M HCl.
Characterization
The synthesized sample was investigated by Field Emission Scanning Electron Microscopy (FESEM) JEOL 7600F and Transmission Electron Microscopy (TEM) JEOL 2100F to obtain the morphology and lattice image. X-Ray Diffraction (XRD) measurement was carried out on Shimazu XRD-6000 (Cu target, 2° min−1). Fourier transform infrared spectroscopy (FT-IR) spectrum was collected on a Frontier™ FT-IR/NIR spectrometer. The sample roughness was measured using Atomic Force Microscope (AFM) with a DI 3100 (Veeco, Digital Instruments).Electrochromic performance testing
The electrochromic testing was carried out in a conventional three electrode environment with the active material on ITO/glass as the working electrode, Ag wire as the reference, Pt wire as the counter electrode. 1 M lithium perchlorate in propylene carbonate was used as the electrolyte. The voltage supply was from Solartron 1470E and the active material was polarized between −0.7 V and 1 V versus Ag wire reference for electrochromic contrast testing and stability testing. Two electrode test with two ITO glass sandwiching the electrochromic material was also carried out to prove the feasibility of device test as describe in the ESI.†Result and discussion
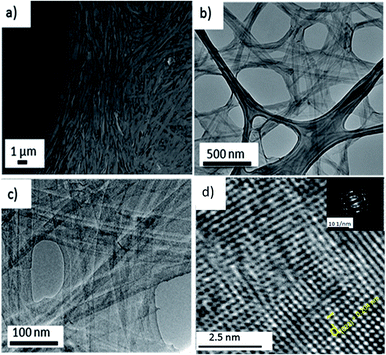
After washing of the hydrothermal sample, a belt-like structure can be seen lying flat on the silicon wafer as shown in the FESEM image of Fig. 1a. TEM analysis revealed that the belts are actually composed of finer nanobelts with a width of around 20–40 nm. These nanobelts are confined by a thin solid membrane as shown in Fig. 1b and c, which results in a hybrid structure. A high resolution TEM (HR-TEM) image and a ring-like electron diffraction pattern (Fig. 1d, inset) indicates that the hybrid structured oxide is in polycrystalline form. The suggested mechanism for the formation of the hybrid structured material is as follows: first, the vanadium ion groups are chelated by the abundant phenol groups from tannic acid. During the crystallization process under hydrothermal synthesis condition, the vanadium species chelated by tannic acid first nucleate and begin to form into nanobelt structure. Subsequently, instead of multiple fine nanobelts merging into big bundles with lateral growth as shown in a similar synthesis environment without tannic acid.42 Our sample with tannic acid synthesis results in fine nanobelts with a narrow width of around 20–40 nm and they are connected with a thin membrane as shown in Fig. 1c. The thin membrane is formed due to the occurrence of nanobelt lateral growth in the presence of chelating tannic acid with a strong steric hindrance force. The narrow space between the fine nanobelts creates a repulsing force from the steric hindrance from the tannic acid present along the nanobelt and hindered the diffusion of vanadium species for further crystallization. This induces a depletion of vanadium concentration in the local environment between the nanobelts and leads to the formation of a thin V2O5 membrane.The XRD (X-ray diffraction) spectrum of the membrane-nanobelt structure is shown in Fig. 2a. The well-defined peaks in the XRD pattern correspond to orthorhombic vanadium oxide hydrate with a composition of V2O5 × 1.6H2O. These peaks belong to (00L) series and confirm that the hybrid structure is lying flat and exposing these (00L) faces. Similar XRD patterns23,32 for other hydrothermal samples of vanadium oxide have also been discussed before.
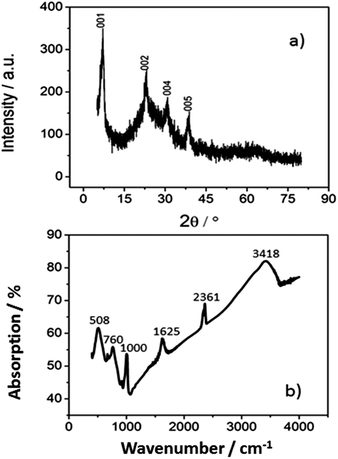 | ||
| Fig. 2 (a) XRD spectrum of the hybrid structured vanadium oxide; (b) FT-IR spectrum of the vanadium oxide under test. | ||
The FT-IR (Fourier-transform Infra-Red) spectrum also confirms the presence of hydrated vanadium oxide. The spectrum is shown in Fig. 2b in the range of 400–4500 cm−1, the strong absorption peaks at 3418, 2361 and 1625 cm−1 are ascribed to vibrational modes of water molecules,41 which indicates that water molecules are retained inside the nanostructures after hydrothermal synthesis. The peak at 1000 cm−1 corresponds to V![[double bond, length as m-dash]](https://www.rsc.org/images/entities/char_e001.gif) O terminal oxygen stretching mode,43 and the peak at around 760 cm−1 attributes to V–O–V asymmetric stretching mode.44 Finally, the peak at around 508 cm−1 is related to the stretching mode of the oxygen atom shared between three vanadium atoms.34
O terminal oxygen stretching mode,43 and the peak at around 760 cm−1 attributes to V–O–V asymmetric stretching mode.44 Finally, the peak at around 508 cm−1 is related to the stretching mode of the oxygen atom shared between three vanadium atoms.34
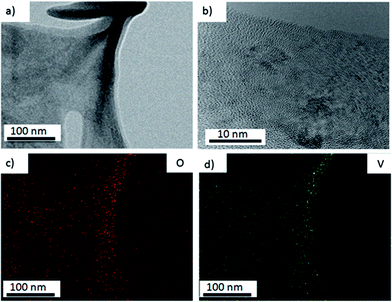
To confirm the chemical structure of the membrane in this hybrid, EDX (Energy Dispersive X-ray Spectroscopy) mapping of the distribution of vanadium and oxygen atoms is conducted and shown in Fig. 3c and d. The area (Fig. 3a) is carefully chosen, in which there are no nanobelts observed. The red and green dots refer to oxygen and vanadium distribution, respectively. The uniform signal coverage of the two elements across the selected area proves that the membrane also consists of vanadium oxide. The weight percent of vanadium and oxygen is shown in ESI FS 1.† The HR-TEM analysis shows easily distinguished lattice structure of the membrane which confirms its polycrystalline property as shown in Fig. 3b.
The color change mechanism involves a reversible electrochemical reaction whereby cathodic current through vanadium oxide causes V5+ (orange color) reduction to V4+ (green-bluish color); when an anodic current passes, the reverse reaction occurs. The whole reaction can be generalized in the following equation:
| V2O5 + xLi+ + xe ↔ LixV2O5 | (1) |
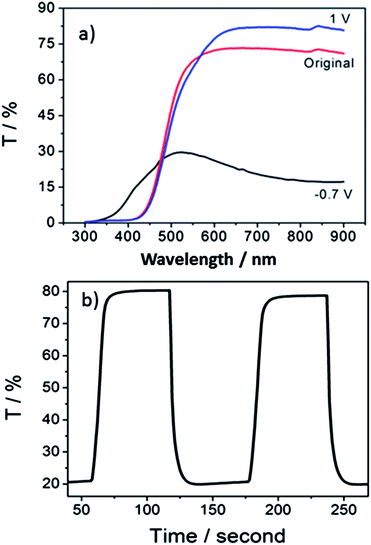
The contrast is taken at the wavelength of 700 nm for this hybrid structured material. According to Fig. 4a, the contrast yielded was up to 62%. This is higher than other reported data for vanadium oxide, which gives a maximum contrast of around 50% in the visible range.23,25,27 It has been suggested that the contrast of electrochromic materials is related to the extent and amount of active material that can be intercalated with electrolyte ions.45 The existence of nanobelts significantly increased the surface area, providing abundant intercalation sites of easy access. Besides, the membrane structure plays an important role in achieving such a high contrast in this work. The original interstitials or spacing between nanobelts are partially replaced by the membrane which smoothens the rough structure (root mean square roughness of 7.72 nm based on atomic force microscope, ESI Fig. S2†). Generally speaking, an increase of the porosity with roughened surface would reduce the contrast.24,27,46 This smooth hybrid nanobelt membrane structure reduces light scattering, which helps to increase the transmittance at bleached state. This complements the strong absorption behavior of the electrochromic film in the colored state that gives a dark color approaching blue, which keeps the transmittance at a low level. Finally, a large difference in transmission levels is reflected by the high contrast.
Switching time is described as 90% of the time consumed for the completion of color conversion. The hybrid structured vanadium oxide demonstrates a fast switching behavior with coloration and bleaching time of 7.0 s, and 9.9 s respectively (calculated from Fig. 4b), which is comparable to other systems with nanowire, nanorod, and amorphous structures.23,39,47 This can be explained from the FESEM image shown in Fig. 1a. The membrane does not form a continuous solid thin film but confines the nanobelts into bundles between which electrolyte is allowed to infiltrate freely into the hybrid structure and enhances the switching kinetics.
As for coloration efficiency, it is defined by the following equation:
η = ΔOD/q; ΔOD = log![[thin space (1/6-em)]](https://www.rsc.org/images/entities/char_2009.gif) Tbleached/Tcolored Tbleached/Tcolored | (2) |
Herein, Tbleached and Tcolored refers to sample transmission at the bleached and colored state respectively. ΔOD indicates the change of optical density and q refers to charge inserted to vanadium oxides per area. The extracted coloration efficiency is 20.7 cm2 C−1 at the wavelength of 700 nm, which is similar to other crystalline vanadium oxide structures.24,34,48–50
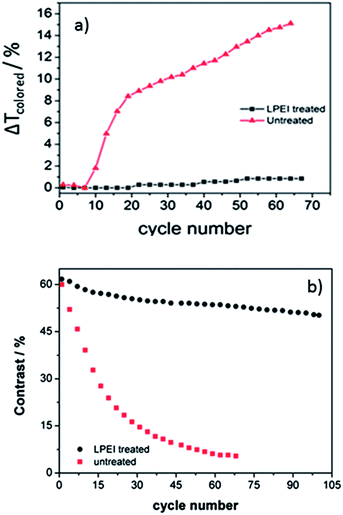
Apart from generally being low in electrochromic contrast, another problem faced by vanadium oxide eletrochromism is its poor stability. The contrast usually drops drastically within the first few cycles (Fig. 5b) and the film was found to slowly peel off from the ITO/glass substrate under no surface treatment condition. This eventually leads to a gradual increase of the sample transmission at the colored state. To characterize the reduction in contrast quantitatively, the difference in the sample transmission at the colored state before and after a certain number of cycles is adopted as ΔTcolored. This parameter describes the extent of film peeling condition when the cycle number goes up. The film peeling condition of the sample with and without LPEI treatment is compared in Fig. 5a. The active material is much harder to peel off after LPEI surface treatment, which gives rise to only 0.8% increase in ΔTcolored after around 70 cycles compared to the unsatisfactory 15.33% rise in ΔTcolored for the untreated sample.
With the LPEI surface treatment39 which increases the interaction between the electrode and active material, a much better cycling stability can be achieved as shown in Fig. 5b. A contrast degradation of only 18.6% is obtained after 100 cycles for samples on LPEI treated ITO/glass substrate in comparison to the severe decrease in contrast up to 92.5% for the sample without surface treatment.
The stability enhancement is due to the coexistence of electrostatic and hydrogen bonding interaction with the substrate. In short, LPEI is a cationic polymer with secondary amine groups; vanadium oxide presents negative charges on the surface. The electrostatic interaction as well as the NH––O![[double bond, length as m-dash]](https://www.rsc.org/images/entities/char_e001.gif) V (ref. 51 and 52) hydrogen bonding interaction improves the cycling stability of the film. As a comparison for the untreated sample, repeated intercalation and deintercalation strains the crystalline structure and diminishes the interaction between ITO surface and vanadium oxide causing the film to peel off easily with increased cycling number.
V (ref. 51 and 52) hydrogen bonding interaction improves the cycling stability of the film. As a comparison for the untreated sample, repeated intercalation and deintercalation strains the crystalline structure and diminishes the interaction between ITO surface and vanadium oxide causing the film to peel off easily with increased cycling number.
Lastly, we also carried out a two-electrode electrochromic performance test of the hybrid structured vanadium oxide sample to validate its potential in real device applications. The results show a comparable performance to the three-electrode test data (refer to FS 3†), indicating a promising future of this electrochromic nanomaterial.
Conclusion
Based on the results above, we have successfully synthesized a nanobelt-membrane hybrid structured polycrystalline vanadium oxide using tannic acid as a green shape-directing agent. The hybrid structured vanadium oxide can reach a high coloration contrast of 62% in the visible range with enhanced cycling stability after ITO/glass surface treatment by LPEI, thus making it a promising candidate for electrochromic applications.Acknowledgements
This work is conducted by NTU-HUJ-BGU Nanomaterials for Energy and Water Management Programme under the Campus for Research Excellence and Technological Enterprise (CREATE), that is supported by the National Research Foundation, Prime Minister's Office, Singapore. W. Kang acknowledges a scholarship awarded by Nanyang Technological University.References
- X. Liu, Q. Long, C. Jiang, B. Zhan, C. Li, S. Liu, Q. Zhao, W. Huang and X. Dong, Nanoscale, 2013, 5, 6525–6529 RSC.
- K. Karthikeyan, D. Kalpana, S. Amaresh and Y. S. Lee, RSC Adv., 2012, 2, 12322–12328 RSC.
- B. Wang, J. S. Chen, Z. Wang, S. Madhavi and X. W. D. Lou, Adv. Energy Mater., 2012, 2, 1188–1192 CrossRef CAS.
- Smart Glass: Electrochromic, Suspended Particle, and Thermochromic Technologies for Architectural and Transportation Applications: Global Market Analysis and Forecasts, London office of Navigant Research, 3Q, 2013 Search PubMed.
- E. Lee, M. Yazdanian and S. Selkowitz, The Energy-Savings Potential of Electrochromic Windows in the US Commercial Buildings Sector, Environmental Energy Technologies Division, 2004, LBNL-54966 Search PubMed.
- E. S. Lee, D. L. DiBartolomeo, J. H. Klems, M. Yazdanian and S. E. Selkowitz, ASHRAE Trans., 2006, 112, 122–141 Search PubMed.
- K. P. Munshi, Analysis of Life Cycle Costs and Energy Savings of Electrochromic Glazing for an Office Building, Arizona State University, 2012 Search PubMed.
- N. Sbar, M. Badding, R. Budziak, K. Cortez, L. Laby, L. Michalski, T. Ngo, S. Schulz and K. Urbanik, Sol. Energy Mater. Sol. Cells, 1999, 56, 321–341 CrossRef CAS.
- R. Wang, X.-p. Liao, S.-l. Zhao and B. Shi, J. Chem. Technol. Biotechnol., 2006, 81, 1301–1306 CrossRef CAS.
- H.-w. Ma, X.-p. Liao, X. Liu and B. Shi, J. Membr. Sci., 2006, 278, 373–380 CrossRef CAS PubMed.
- X. Huang, H. Wu, X. Liao and B. Shi, Green Chem., 2010, 12, 395–399 RSC.
- X. Huang, H. Wu, S. Pu, W. Zhang, X. Liao and B. Shi, Green Chem., 2011, 13, 950–957 RSC.
- L. Mai, L. Xu, C. Han, X. Xu, Y. Luo, S. Zhao and Y. Zhao, Nano Lett., 2010, 10, 4750–4755 CrossRef CAS PubMed.
- A. Pan, H. B. Wu, L. Yu, T. Zhu and X. W. Lou, ACS Appl. Mater. Interfaces, 2012, 4, 3874–3879 CAS.
- L. Mai, F. Dong, X. Xu, Y. Luo, Q. An, Y. Zhao, J. Pan and J. Yang, Nano Lett., 2013, 13, 740–745 CrossRef CAS PubMed.
- Y. Li, J. Yao, E. Uchaker, J. Yang, Y. Huang, M. Zhang and G. Cao, Adv. Energy Mater., 2013, 3, 1171–1175 CrossRef CAS.
- D. Yu, C. Chen, S. Xie, Y. Liu, K. Park, X. Zhou, Q. Zhang, J. Li and G. Cao, Energy Environ. Sci., 2011, 4, 858–861 CAS.
- Z. Chen, V. Augustyn, J. Wen, Y. Zhang, M. Shen, B. Dunn and Y. Lu, Adv. Mater., 2011, 23, 791–795 CrossRef CAS PubMed.
- M. Sathiya, A. S. Prakash, K. Ramesha, J. M. Tarascon and A. K. Shukla, J. Am. Chem. Soc., 2011, 133, 16291–16299 CrossRef CAS PubMed.
- J. Zhu, L. Cao, Y. Wu, Y. Gong, Z. Liu, H. E. Hoster, Y. Zhang, S. Zhang, S. Yang, Q. Yan, P. M. Ajayan and R. Vajtai, Nano Lett., 2013, 13, 5408–5413 CrossRef CAS PubMed.
- D. Wei, M. R. Scherer, C. Bower, P. Andrew, T. Ryhänen and U. Steiner, Nano Lett., 2012, 12, 1857–1862 CrossRef CAS PubMed.
- M. Ponzi, C. Duschatzky, A. Carrascull and E. Ponzi, Appl. Catal., A, 1998, 169, 373–379 CrossRef CAS.
- C. Xiong, A. E. Aliev, B. Gnade and K. J. Balkus, ACS Nano, 2008, 2, 293–301 CrossRef CAS PubMed.
- L. Li, U. Steiner and S. Mahajan, J. Mater. Chem., 2010, 20, 7131–7134 RSC.
- Y. Lu, L. Liu, D. Mandler and P. S. Lee, J. Mater. Chem. C, 2013, 1, 7380–7386 RSC.
- S. I. Cho, W. J. Kwon, S. J. Choi, P. Kim, S. A. Park, J. Kim, S. J. Son, R. Xiao, S. H. Kim and S. B. Lee, Adv. Mater., 2005, 17, 171–175 CrossRef CAS.
- M. R. J. Scherer, L. Li, P. M. S. Cunha, O. A. Scherman and U. Steiner, Adv. Mater., 2012, 24, 1217–1221 CrossRef CAS PubMed.
- P. Liu, S.-H. Lee, C. E. Tracy, J. A. Turner, J. R. Pitts and S. K. Deb, Solid State Ionics, 2003, 165, 223–228 CrossRef CAS PubMed.
- D. Chen, R. Yi, S. Chen, T. Xu, M. L. Gordin, D. Lv and D. Wang, Mater. Sci. Eng., B, 2014, 185, 7–12 CrossRef CAS PubMed.
- N. T. B. Bay, P. M. Tien, S. Badilescu, Y. Djaoued, G. Bader, F. E. Girouard, V.-v. Truong and L. q. Nguyen, J. Appl. Phys., 1996, 80, 7041–7045 CrossRef CAS PubMed.
- M. Gotić, S. Popović, M. Ivanda and S. Musić, Mater. Lett., 2003, 57, 3186–3192 CrossRef.
- D. Pan, Z. Shuyuan, Y. Chen and J. Hou, J. Mater. Res., 2002, 17, 1981–1984 CrossRef CAS.
- H. Yin, K. Yu, H. Peng, Z. Zhang, R. Huang, J. Travas-Sejdic and Z. Zhu, J. Mater. Chem., 2012, 22, 5013–5019 RSC.
- C. E. Patil, P. R. Jadhav, N. L. Tarwal, H. P. Deshmukh, M. M. Karanjkar and P. S. Patil, Mater. Chem. Phys., 2011, 126, 711–716 CrossRef CAS PubMed.
- C. Patil, P. Jadhav, N. Tarwal, H. Deshmukh, M. Karanjkar and P. Patil, Mater. Chem. Phys., 2011, 126, 711–716 CrossRef CAS PubMed.
- G. Cao, J. Phys. Chem. B, 2004, 108, 19921–19931 CrossRef CAS.
- Y. Wang and G. Cao, IEEE Nanotechnology Magazine, 2009, 3, 14–20 CrossRef.
- J. W. Lim, S. J. Yoo, S. H. Park, S. U. Yun and Y.-E. Sung, Sol. Energy Mater. Sol. Cells, 2009, 93, 2069–2074 CrossRef CAS PubMed.
- Y. Lu, L. Liu, W. Foo, S. Magdassi, D. Mandler and P. S. Lee, J. Mater. Chem. C, 2013, 1, 3651–3654 RSC.
- X. Zhang, H. Sun, Z. Li, J. Xu, S. Jiang, Q. Zhu, A. Jin and G. S. Zakharova, J. Electrochem. Soc., 2013, 160, H587–H590 CrossRef CAS PubMed.
- C. Costa, C. Pinheiro, I. Henriques and C. A. T. Laia, ACS Appl. Mater. Interfaces, 2012, 4, 5266–5275 CAS.
- C.-C. Hu and K.-H. Chang, Electrochem. Solid-State Lett., 2004, 7, A400–A403 CrossRef CAS PubMed.
- R. Baddour-Hadjean and J.-P. Pereira-Ramos, Chem. Rev., 2009, 110, 1278–1319 CrossRef PubMed.
- A. Jin, W. Chen, Q. Zhu, Y. Yang, V. L. Volkov and G. S. Zakharova, Solid State Ionics, 2008, 179, 1256–1262 CrossRef CAS PubMed.
- S. I. Cho, W. J. Kwon, S. J. Choi, P. Kim, S. A. Park, J. Kim, S. J. Son, R. Xiao, S. H. Kim and S. B. Lee, Adv. Mater., 2005, 17, 171–175 CrossRef CAS.
- Z. Zhenrong, Z. Jing and G. Peifu, Opt. Appl., 2010, 40, 811–818 Search PubMed.
- K.-C. Cheng, F.-R. Chen and J.-J. Kai, Sol. Energy Mater. Sol. Cells, 2006, 90, 1156–1165 CrossRef CAS PubMed.
- Z. Wang, J. Chen and X. Hu, Thin Solid Films, 2000, 375, 238–241 CrossRef CAS.
- M. Najdoski, V. Koleva and S. Demiri, Mater. Res. Bull., 2012, 47, 737–743 CrossRef CAS PubMed.
- C. Patil, P. Jadhav, N. Tarwal, H. Deshmukh, M. Karanjakar, A. Wali and P. Patil, Proceeding of international conference on recent trends in applied physics and materials science, 2013, 1536 Search PubMed.
- F. Huguenin, D. S. dos
![[thin space (1/6-em)]](https://www.rsc.org/images/entities/char_2009.gif) Santos, A. Bassi, F. C. Nart and O. N. Oliveira, Adv. Funct. Mater., 2004, 14, 985–991 CrossRef CAS.
Santos, A. Bassi, F. C. Nart and O. N. Oliveira, Adv. Funct. Mater., 2004, 14, 985–991 CrossRef CAS. - F. Leroux, G. Goward, W. P. Power and L. F. Nazar, J. Electrochem. Soc., 1997, 144, 3886–3895 CrossRef CAS PubMed.
Footnote |
| † Electronic supplementary information (ESI) available: EDX spectrum of the hybrid structured vanadium oxide, AFM image, electrochromic contrast and switching test under two electrode condition. See DOI: 10.1039/c4tc00158c |
| This journal is © The Royal Society of Chemistry 2014 |

