 Open Access Article
Creative Commons Attribution 3.0 Unported Licence
Platinum(II) complexes with cyclometallated 5-π-delocalized-donor-1,3-di(2-pyridyl)benzene ligands as efficient phosphors for NIR-OLEDs†
Filippo
Nisic
a,
Alessia
Colombo
a,
Claudia
Dragonetti
ab,
Dominique
Roberto
*ab,
Adriana
Valore
b,
Joanna M.
Malicka
c,
Massimo
Cocchi
*cd,
Gemma R.
Freeman
e and
J. A. Gareth
Williams
*e
aDipartimento di Chimica dell'Università degli Studi di Milano, UdR INSTM di Milano, via Golgi 19, 20133 Milano, Italy
bISTM-CNR, Via Golgi 19, 20133 Milano, Italy. E-mail: dominique.roberto@unimi.it
cConsorzio MIST E-R scrl, Via P. Gobetti 101, 40129 Bologna, Italy
dIstituto per la Sintesi Organica e la Fotoreattività (ISOF), Consiglio Nazionale delle Ricerche (CNR), Via P. Gobetti 101, 40129 Bologna, Italy. E-mail: cocchi@isof.cnr.it
eDepartment of Chemistry, University of Durham, South Road, Durham, DH1 3LE, UK. E-mail: j.a.g.williams@durham.ac.uk
First published on 20th December 2013
Abstract
Two new pincer proligands, namely 5-(p-(N,N-diphenylamino)phenylethynyl)-1,3-di(2-pyridyl)benzene (HL1) and trans-5-(p-(N,N-diphenylamino)styryl-1,3-di(2-pyridyl)benzene (HL2) were prepared together with their N^C^N-coordinated cyclometallated platinum(II) complexes PtL1X (X = Cl, NCS) and PtL2Cl. Both ligands are intensely luminescent in solution (quantum yields > 0.8). PtL1X complexes display high quantum yields in solution whereas that of PtL2Cl is very low due to the ease with which trans to cis isomerisation of the diphenylaminostyryl C![[double bond, length as m-dash]](https://www.rsc.org/images/entities/char_e001.gif) C bond occurs. Distinct sets of emission bands attributable to the cis and trans forms are observable in glass at 77 K, the assignments being supported by TD-DFT calculations. Organic light-emitting diodes (OLEDs) have been prepared using the new compounds as phosphorescent emitters. Remarkably, despite the inferior quantum yield of PtL2Cl in solution, the best electroluminescence quantum efficiencies are obtained with this complex, which emerges as an excellent candidate for the preparation of NIR-OLEDs.
C bond occurs. Distinct sets of emission bands attributable to the cis and trans forms are observable in glass at 77 K, the assignments being supported by TD-DFT calculations. Organic light-emitting diodes (OLEDs) have been prepared using the new compounds as phosphorescent emitters. Remarkably, despite the inferior quantum yield of PtL2Cl in solution, the best electroluminescence quantum efficiencies are obtained with this complex, which emerges as an excellent candidate for the preparation of NIR-OLEDs.
Introduction
There has been a growing interest in the design of luminescent transition metal complexes as phosphors for organic light-emitting devices (OLEDs) over the past decade.1–3 In OLEDs, light emission arises from the radiative deactivation of electronic excited states that are formed by recombination of charge carriers – i.e. electrons and holes – injected from the electrodes. Because phosphorescent emitters doped into fluorescent host materials can potentially harvest both singlet and triplet excitons upon electron–hole recombination, their use in place of fluorescent compounds may potentially improve the luminous efficiency. Complexes of third-row transition metal ions are particularly suitable for this purpose, since the high spin–orbit coupling constant and high intersystem crossing associated with them efficiently promote emission from the otherwise wasted triplet states, which represent up to 75% of the excited states formed upon charge-recombination in an electroluminescent device.1–3Though the field has to date been dominated by complexes of iridium(III), which are already used in many devices, platinum(II) complexes attract increasing interest. Part of the motivation for turning to platinum(II) lies in the propensity of square-planar d8 complexes to undergo face-to-face bimolecular interactions, which may lead to excimeric or aggregate emissions that are not normally possible in d6 complexes.4 Several families of Pt(II) complexes have been discovered that are brightly luminescent in solution at room temperature.4,5 A convenient strategy to improve luminescence is to make use of cyclometallating ligands, whose strong ligand fields tend to favour emission efficiencies, as they raise the energies of otherwise deactivating metal-centred states, making them thermally inaccessible and thus reducing non-radiative decay pathways. Meanwhile, tridentate ligands have been found to offer an advantage over bidentate ligands in that they impart higher rigidity on the complex, inhibiting distortion and reducing non-radiative decay.6,7
Pt(II) complexes with tridentate ligands based on cyclometallated 1,3-di(2-pyridyl)benzene (dpyb),8 which offer the metal ion an N^C^N coordination environment, are amongst the brightest Pt-based emitters in solution at room temperature.9 This structural motif has also been found to lead to significant second-order nonlinear optical properties.10 Remarkably, the emission color of OLEDs based on these complexes can be easily tuned, for example, from blue to red by increasing the donor ability of the substituent at the central 5-position of the cyclometallating ring.11
On the other hand, OLEDs that emit in the near-infrared (NIR) region represent an intrinsically challenging target, owing to the tendency of non-radiative decay processes to increase as the excited-state energy decreases12 and, simultaneously, of the radiative decay constants to decrease. Two classes of NIR-emitting OLEDs based on metal complexes are known. The first utilizes lanthanide cations as the emitting centres with emission around 1000 nm but with a very low external electroluminescence quantum efficiency (EL QE).13 The second class uses d-block metal complexes with highly conjugated ligands, characterized by higher EL QE but much shorter λmax values. For example, efficient phosphorescent NIR-OLEDs based on Pt-porphyrins have been reported recently, with emission maxima at around 770 nm.14 The challenge is now to shift the λmax of transition metal-based OLEDs to lower energy, whilst maintaining a high EL QE efficiency.
One way to tune emission towards the red and NIR is to make use of bimolecular excited states; for example, excimer or aggregate states of square-planar Pt(II) complexes that undergo energy-minimising face-to-face interactions.4m,15 Recently some of us found that the complex PtLmesNCS {Lmes = 5-mesityl-1,3-di(2-pyridyl)-benzene} allows the preparation of OLEDs that emit squarely in the NIR region (λmax = 855 nm), through the formation of such aggregate species and their efficient emission.16
In this paper, we describe the effect of the incorporation of π-delocalized ArC![[double bond, length as m-dash]](https://www.rsc.org/images/entities/char_e001.gif) C– and ArC
C– and ArC![[triple bond, length as m-dash]](https://www.rsc.org/images/entities/char_e002.gif) C– substituents at the central 5-position of the phenyl ring of dpyb. The absorption, photoluminescence, and electroluminescence properties of the N^C^N-cyclometallated Pt(II) complexes are investigated, and we show how one of these novel compounds is a good candidate for the preparation of efficient NIR OLEDs.
C– substituents at the central 5-position of the phenyl ring of dpyb. The absorption, photoluminescence, and electroluminescence properties of the N^C^N-cyclometallated Pt(II) complexes are investigated, and we show how one of these novel compounds is a good candidate for the preparation of efficient NIR OLEDs.
Experimental
General comments
Solvents were dried by standard procedures: THF was freshly distilled from Na/benzophenone under a nitrogen atmosphere, N,N-dimethylformamide (DMF) was dried over activated molecular sieves and triethylamine (Et3N) was freshly distilled over KOH. All reagents were purchased from Sigma-Aldrich and were used without further purification. Reactions requiring anhydrous or oxygen-free conditions were performed under nitrogen. Thin layer chromatography (TLC) was carried out with pre-coated Merck F254 silica gel plates. Flash chromatography (FC) was carried out with Macherey-Nagel silica gel 60 (230–400 mesh).1H and 13C spectra were recorded at 400 MHz on a Bruker AVANCE-400 instrument. Chemical shifts (δ) for 1H and 13C spectra are expressed in ppm relative to internal Me4Si as standard. Signals are abbreviated as s, singlet; bs, broad singlet; d, doublet; t, triplet; q, quartet; m, multiplet. Mass spectra were obtained with a FT-ICR Mass Spectrometer APEX II & Xmass software (Bruker Daltonics) – 4.7 Magnet and Autospec Fission Spectrometer (FAB ionization). Elemental analyses were performed using an Exeter Analytical E-440 analyser.
Synthesis of new ligands and complexes
![[thin space (1/6-em)]](https://www.rsc.org/images/entities/char_2009.gif) :
:![[thin space (1/6-em)]](https://www.rsc.org/images/entities/char_2009.gif) 1 as an eluent, to give a pale yellow solid (220 mg; 60%). 1H-NMR (400 MHz, CDCl3): δ 7.59 (1H, t, J = 1.6 Hz), 7.57 (2H, d, J = 1.6 Hz), 7.33 (2H, d, J = 8.8 Hz), 7.29 (4H, t, J = 7.2 Hz, J = 8.4 Hz), 7.12 (4H, d, J = 8.4 Hz), 7.08 (2H, t, J = 7.2 Hz, J = 8.4 Hz), 6.98 (2H, d, J = 8.8 Hz). 13C-NMR (100 MHz, CDCl3): δ 148.7, 147.1, 133.6, 132.9, 132.8, 129.6, 127.3, 125.4, 123.9, 122.7, 121.9, 114.8, 92.6, 85.8.
1 as an eluent, to give a pale yellow solid (220 mg; 60%). 1H-NMR (400 MHz, CDCl3): δ 7.59 (1H, t, J = 1.6 Hz), 7.57 (2H, d, J = 1.6 Hz), 7.33 (2H, d, J = 8.8 Hz), 7.29 (4H, t, J = 7.2 Hz, J = 8.4 Hz), 7.12 (4H, d, J = 8.4 Hz), 7.08 (2H, t, J = 7.2 Hz, J = 8.4 Hz), 6.98 (2H, d, J = 8.8 Hz). 13C-NMR (100 MHz, CDCl3): δ 148.7, 147.1, 133.6, 132.9, 132.8, 129.6, 127.3, 125.4, 123.9, 122.7, 121.9, 114.8, 92.6, 85.8.
![[thin space (1/6-em)]](https://www.rsc.org/images/entities/char_2009.gif) :
:![[thin space (1/6-em)]](https://www.rsc.org/images/entities/char_2009.gif) 2 as the eluent, to give the product as a pale yellow solid (444 mg; 80%). 1H-NMR (400 MHz, CDCl3): δ 7.56 (2H, d, J = 1.6 Hz), 7.52 (1H, t, J = 1.6 Hz), 7.37 (2H, d, J = 8.8 Hz), 7.32–7.29 (4H, m), 7.14 (4H, d, J = 7.6 Hz), 7.11–7.04 (5H, m), 6.83 (1H, d, Jtrans = 16 Hz). 13C-NMR (100 MHz, CDCl3): δ 148.3, 147.4, 141.5, 132.3, 131.1, 130.1, 129.4, 127.9, 127.8, 127.6, 124.7, 123.7, 123.5, 123.3, 123.1.
2 as the eluent, to give the product as a pale yellow solid (444 mg; 80%). 1H-NMR (400 MHz, CDCl3): δ 7.56 (2H, d, J = 1.6 Hz), 7.52 (1H, t, J = 1.6 Hz), 7.37 (2H, d, J = 8.8 Hz), 7.32–7.29 (4H, m), 7.14 (4H, d, J = 7.6 Hz), 7.11–7.04 (5H, m), 6.83 (1H, d, Jtrans = 16 Hz). 13C-NMR (100 MHz, CDCl3): δ 148.3, 147.4, 141.5, 132.3, 131.1, 130.1, 129.4, 127.9, 127.8, 127.6, 124.7, 123.7, 123.5, 123.3, 123.1.
General procedure for the synthesis of HL1 and HL2
Under a nitrogen atmosphere, a mixture of the 5-substituted m-dibromobenzene derivative (1 equiv.), 2-(tri-n-butylstannyl)pyridine (3 equiv.), PdCl2(PPh3)2 (0.1 equiv.), CuO (3 equiv.) and DMF (0.1 M) was placed in a microwave reactor at 160 °C (250 W) for 45 min, controlling the flow rate of cooling air. After cooling to room temperature, the reaction mixture was poured into ethyl acetate and filtered. The filtrate was washed with water and the organic layer was dried over anhydrous Na2SO4 and concentrated under reduced pressure. The crude product obtained was purified by flash chromatography, using hexane–ethyl acetate 8![[thin space (1/6-em)]](https://www.rsc.org/images/entities/char_2009.gif) :
:![[thin space (1/6-em)]](https://www.rsc.org/images/entities/char_2009.gif) 2 as the eluent.
2 as the eluent.
Procedure for the synthesis of PtL1Cl and PtL2Cl (ref. 18)
Under a nitrogen atmosphere, a solution of K2PtCl4 (1 equiv.) and HL1 or HL2 (1 equiv.) in a AcOH–H2O 9![[thin space (1/6-em)]](https://www.rsc.org/images/entities/char_2009.gif) :
:![[thin space (1/6-em)]](https://www.rsc.org/images/entities/char_2009.gif) 1 mixture (0.3 M) was placed in a microwave reactor at 160 °C (250 W) for 45 min controlling the flow rate of cooling air. After cooling to room temperature, the reaction mixture was filtered. The precipitate was washed successively with methanol, water, ethanol and diethyl ether.
1 mixture (0.3 M) was placed in a microwave reactor at 160 °C (250 W) for 45 min controlling the flow rate of cooling air. After cooling to room temperature, the reaction mixture was filtered. The precipitate was washed successively with methanol, water, ethanol and diethyl ether.
Synthesis of PtL1NCS
A solution of PtL1Cl (125 mg; 1 equiv.) in dichloromethane (300 mL) was treated with a solution of sodium thiocyanate (15.1 mg; 1.1 equiv.) in methanol (2 mL). After stirring at room temperature under nitrogen for 24 h, the solution was filtered and the solvent evaporated to dryness affording the crude product that was washed first with methanol and then with ethanol.Yield 90.1 mg; 70%. 1H NMR (400 MHz, CD2Cl2): δ 8.60 (d, 2H, J = 5.2 Hz), 7.99 (m, 4H), 7.61 (d, 2H, J = 7.8 Hz), 7.38 (m, 10H), 7.21 (m, 4H), 7.04 (d, 2H, J = 7.8 Hz).
MS(FAB+): m/z 753 [M]. Anal. calcd (%) for C37H26N4PtS: C 58.96, H 3.48, N 7.43. Found: C 58.89, H 3.46, N 7.51%.
Photophysical measurements
Absorption spectra were recorded for solutions in dichloromethane within 1 cm pathlength quartz cuvettes using a Biotek Instruments XS spectrometer. Luminescence spectra were recorded using a FluoroMax-2 spectrofluorimeter equipped with an R928 photomultiplier tube. Spectra were corrected for the wavelength dependence of the detector and emission grating. Quantum yields were determined using appropriate standards. For the proligands, a solution of quinine sulfate in 1 M H2SO4 (aq.) was used (Φ = 0.548).19 For the Pt(II) complexes, [Ru(bpy)3]Cl2 in H2O (Φ = 0.028) (ref. 20) was used as the standard, and values were cross-checked against PtLHCl {LH = 1,3-di(2-pyridyl)-benzene} (Φ = 0.90).9a The luminescence lifetimes of the complexes were measured by time-correlated single-photon counting, following excitation with a pulsed laser diode at 374 nm or 405 nm. The emitted light was detected at 90° using a Peltier-cooled R928 photomultiplier tube after passage through a monochromator.21Density functional theory calculations
Calculations were performed using the Gaussian 09 suite of programmes22 with the PBE0 functional.23a The LANL2DZ basis set was used for Pt(II), with the inner core electrons replaced by a relativistic core potential, and the all-electron cc-PVDZ basis set was used for the ligands. A polarised continuum model (PCM) was used for the solvent dichloromethane. Geometries were fully optimised without symmetry constraints, and the triplet state geometries were calculated directly by minimisation of the SCF triplet state. Harmonic vibrational wavenumber calculations were performed to confirm that the structures obtained correspond to minima of the potential energy surface. Time-dependent calculations were carried out on the optimised structures to determine the relevant transitions and for the generation of density difference plots. The spectral simulations were performed by convolution using a Gaussian-shape function of 0.6 eV full-width at half-maximum, as described elsewhere,23b using the ten lowest-energy spin-allowed transitions.Procedure for OLED fabrication and assessment
OLEDs were fabricated by growing a sequence of thin layers on clean glass substrates pre-coated with a layer of indium tin oxide (ITO), 120 nm thick, with a sheet resistance of 20 Ω per square. A 2 nm-thick hole-injecting layer of Mo2Ox was deposited on top of the ITO by thermal evaporation under high vacuum of ∼10−6 hPa. All remaining organic layers were deposited in succession by thermal evaporation under high vacuum, followed by thermal evaporation of the cathode layer consisting of 0.5 nm thick LiF and a 100 nm thick aluminium cap. The emitting layer (EML) was evaporated by co-deposition of PtL2Cl and 4,4′,4′′-tris(N-carbazolyl)triphenylamine (TCTA) or 4,4-N,N′-dicarbazolyl-1,1′-biphenyl (CBP) to form a 30 nm-thick blend film (5 wt% Pt complex![[thin space (1/6-em)]](https://www.rsc.org/images/entities/char_2009.gif) :
:![[thin space (1/6-em)]](https://www.rsc.org/images/entities/char_2009.gif) 95 wt% TCTA or CBP), or by single deposition of the Pt(II) complex only, to form a 15 nm neat film. The current–voltage characteristics were measured with a Keithley Source-Measure unit, model 236, under continuous operation mode, while the light output power was measured with an EG&G power meter, and electroluminescence (EL) spectra recorded with a StellarNet spectroradiometer. All measurements were carried out at room temperature under an argon atmosphere and were reproduced for many runs, excluding chemical reaction with oxygen or moisture. The performance of the emissive layer was optimized by locating the EML between exciton-blocking layers of TCTA (or CBP) (80 nm thick) and 1,3,5-tris(N-phenylbenzimidazole-2-yl)benzene (TPBi) (25 nm thick), the latter acting also as an electron-transporting and hole-blocking layer.
95 wt% TCTA or CBP), or by single deposition of the Pt(II) complex only, to form a 15 nm neat film. The current–voltage characteristics were measured with a Keithley Source-Measure unit, model 236, under continuous operation mode, while the light output power was measured with an EG&G power meter, and electroluminescence (EL) spectra recorded with a StellarNet spectroradiometer. All measurements were carried out at room temperature under an argon atmosphere and were reproduced for many runs, excluding chemical reaction with oxygen or moisture. The performance of the emissive layer was optimized by locating the EML between exciton-blocking layers of TCTA (or CBP) (80 nm thick) and 1,3,5-tris(N-phenylbenzimidazole-2-yl)benzene (TPBi) (25 nm thick), the latter acting also as an electron-transporting and hole-blocking layer.
Results and discussion
Preparation of the new ligands and Pt(II) complexes
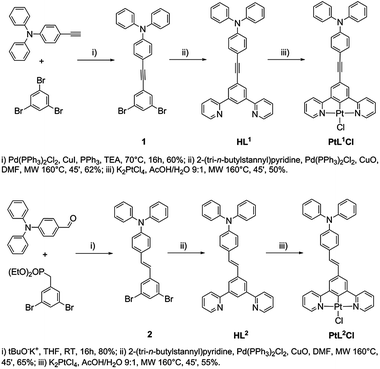
The new proligands 5-(p-(N,N-diphenylamino)phenyl-ethynyl)-1,3-di(2-pyridyl)benzene (HL1) and trans-5-(p-(N,N-diphenylamino)styryl)-1,3-di(2-pyridyl)benzene (HL2) were synthesized from 5-substituted m-dibromobenzene derivatives, as shown in Scheme 1.Complexes PtL1Cl and PtL2Cl were prepared by reaction of K2PtCl4 with HL1 and HL2 respectively, in a AcOH–H2O (9![[thin space (1/6-em)]](https://www.rsc.org/images/entities/char_2009.gif) :
:![[thin space (1/6-em)]](https://www.rsc.org/images/entities/char_2009.gif) 1 v/v) mixture placed in a microwave reactor at 160 °C for 45 min, as previously described for other Pt(II) complexes.18 The PtL1Cl complex was readily converted into PtL1NCS upon treatment with sodium thiocyanate in methanol–dichloromethane at room temperature. The two new ligands and their Pt(II) complexes were fully characterized by elemental analysis, mass spectrometry and NMR spectroscopy. 1H NMR spectroscopy confirms that the E (trans) configuration of the C
1 v/v) mixture placed in a microwave reactor at 160 °C for 45 min, as previously described for other Pt(II) complexes.18 The PtL1Cl complex was readily converted into PtL1NCS upon treatment with sodium thiocyanate in methanol–dichloromethane at room temperature. The two new ligands and their Pt(II) complexes were fully characterized by elemental analysis, mass spectrometry and NMR spectroscopy. 1H NMR spectroscopy confirms that the E (trans) configuration of the C![[double bond, length as m-dash]](https://www.rsc.org/images/entities/char_e001.gif) C double bond of HL2 is retained in the complex PtL2Cl.
C double bond of HL2 is retained in the complex PtL2Cl.
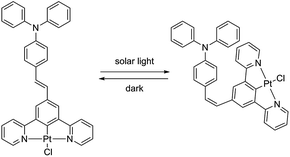
Interestingly it turned out that complex PtL2Cl, in solution in CH2Cl2 at room temperature, readily isomerizes to give the cis isomer upon exposure to ambient light, as revealed by the evolution of the 1H NMR spectrum (data are provided in Fig. S1 of the ESI†). The cis isomer reconverts into the thermodynamically more stable trans isomer in the dark at room temperature (Scheme 2). In contrast, no cis isomer is formed when a solid sample of PtL2Cl is left under solar light at room temperature for at least a few months.
Photophysical properties in solution
Absorption and photoluminescence data of the uncoordinated proligands and of the three Pt(II) complexes are presented in Table 1.| Compound | Absorptiona | Emissiona 298 K | Emissionb 77 K | |||
|---|---|---|---|---|---|---|
| λ max/nm (ε/M−1 cm−1) | λ max/nm | τ /ns | Φ lum | λ max/nm | τ/ns | |
a In degassed CH2Cl2.
b In diethyl ether–isopentane–ethanol (2![[thin space (1/6-em)]](https://www.rsc.org/images/entities/char_2009.gif) : :![[thin space (1/6-em)]](https://www.rsc.org/images/entities/char_2009.gif) 2 2![[thin space (1/6-em)]](https://www.rsc.org/images/entities/char_2009.gif) : :![[thin space (1/6-em)]](https://www.rsc.org/images/entities/char_2009.gif) 1 v/v).
c The lifetime values indicated for PtL1Cl and PtL1NCS are those at infinite dilution, obtained from a plot of τ−1versus concentration, as described previously.9a,21a The values in parenthesis are for air-equilibrated solution.
d Quantum yield and lifetime at the photostationary state formed upon irradiation with the UV lamp at 365 nm; emissive due to the cis form. 1 v/v).
c The lifetime values indicated for PtL1Cl and PtL1NCS are those at infinite dilution, obtained from a plot of τ−1versus concentration, as described previously.9a,21a The values in parenthesis are for air-equilibrated solution.
d Quantum yield and lifetime at the photostationary state formed upon irradiation with the UV lamp at 365 nm; emissive due to the cis form.
|
||||||
| HL1 | 252 (41![[thin space (1/6-em)]](https://www.rsc.org/images/entities/char_2009.gif) 900), 282 (42 900), 282 (42![[thin space (1/6-em)]](https://www.rsc.org/images/entities/char_2009.gif) 200), 359 (38 200), 359 (38![[thin space (1/6-em)]](https://www.rsc.org/images/entities/char_2009.gif) 400) 400) |
430 | 2.4 | 0.82 | 399 (F), 506, 535, 571 (P) | 1.4, 7.9 × 10⁸ |
| HL2 | 260 (32![[thin space (1/6-em)]](https://www.rsc.org/images/entities/char_2009.gif) 800), 286 (40 800), 286 (40![[thin space (1/6-em)]](https://www.rsc.org/images/entities/char_2009.gif) 200), 375 (33 200), 375 (33![[thin space (1/6-em)]](https://www.rsc.org/images/entities/char_2009.gif) 300) 300) |
459 | 2.5 | 0.92 | 420, 440 (F) | 1.9 |
| PtL1Cl | 240 (35![[thin space (1/6-em)]](https://www.rsc.org/images/entities/char_2009.gif) 100), 292 (27 100), 292 (27![[thin space (1/6-em)]](https://www.rsc.org/images/entities/char_2009.gif) 100), 338sh (18 100), 338sh (18![[thin space (1/6-em)]](https://www.rsc.org/images/entities/char_2009.gif) 200), 363 (22 200), 363 (22![[thin space (1/6-em)]](https://www.rsc.org/images/entities/char_2009.gif) 800), 416sh (6380) 800), 416sh (6380) |
496, 530, 569 [680 excimer] | 8400 (540) | 0.27 | 492, 508, 528, 566, 619 | 7400 |
| PtL1NCS | 240 (60![[thin space (1/6-em)]](https://www.rsc.org/images/entities/char_2009.gif) 500), 294 (49 500), 294 (49![[thin space (1/6-em)]](https://www.rsc.org/images/entities/char_2009.gif) 500), 337 (30 500), 337 (30![[thin space (1/6-em)]](https://www.rsc.org/images/entities/char_2009.gif) 000), 361 (34 000), 361 (34![[thin space (1/6-em)]](https://www.rsc.org/images/entities/char_2009.gif) 600) 600) |
496, 531, 570 [655 excimer] | 9400 (560) | 0.25 | 491, 528, 565, 617 | 8200 |
| PtL2Cl | 295 (21![[thin space (1/6-em)]](https://www.rsc.org/images/entities/char_2009.gif) 000), 378 (15 000), 378 (15![[thin space (1/6-em)]](https://www.rsc.org/images/entities/char_2009.gif) 700), 430sh (4900) 700), 430sh (4900) |
486, 502, 530 | 3800d | 0.003d | 481, 494, 527, 568 (cis) 634, 702, 776 (trans) | 6700 (cis) 13![[thin space (1/6-em)]](https://www.rsc.org/images/entities/char_2009.gif) 000 (trans) 000 (trans) |
Typically in complexes such as Pt(dpyb)Cl, bands in the 350–400 nm region have ε values of around 7000 M−1 cm−1, with no counterparts in the proligands, assigned to metal-to-ligand and intra-ligand charge-transfer transitions that are introduced upon cyclometallation.5,21 Such transitions will necessarily be present in the current complexes, but they are evidently superimposed on intense ligand-centred transitions. This leads to unusually high ε values in this region, around 3–4 times higher than in Pt(dpyb)Cl.
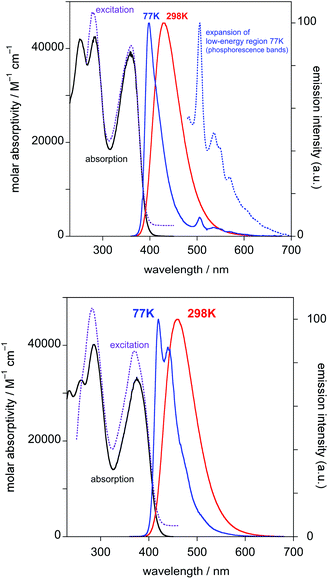
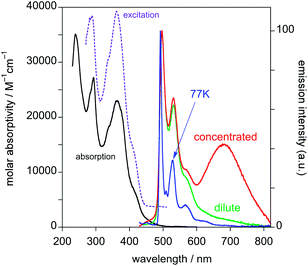
Both PtL1Cl and PtL1NCS complexes are intensely luminescent in dilute solution at room temperature, displaying vibrationally structured emission spectra with maxima in the green region at 496 nm and luminescence quantum yields of around 0.25 (Table 1 and Fig. 2; spectra for PtL1NCS are shown in Fig. S2 in the ESI†). The profile of the spectra, attributed to a primarily ligand-centred 3π–π* state, is in each case similar to that of the parent complex Pt(dpyb)Cl, as are the luminescence lifetimes of around 8 μs.9
Like the parent complex, PtL1Cl and PtL1NCS readily form excimers at elevated concentration in solution, which emit in the red region of the spectrum. Interestingly, although the change of the monodentate ligand from Cl− to NCS− has no significant influence on the emission wavelength of the monomeric complex, the excimer emission of PtL1NCS is somewhat blue-shifted relative to that of PtL1Cl (λmax = 655 and 680 nm, respectively). The formation of the excimer is accompanied by the expected decrease in relative intensity of the monomer bands, whilst the luminescence lifetime decreases. The gradients of the plots of the observed radiative rate constant (= 1/τ) versus concentration provide an indication of the propensity of such complexes to form excimers. The values of 1.9 × 10⁹ and 3.6 × 10⁹ M−1 s−1 are of the same order of magnitude as those found for 5-aryl-substituted derivatives of the parent Pt(dpyb)Cl.21
The behaviour of PtL2Cl, the complex incorporating the styryl substituent, is more complicated. In dichloromethane solution at 298 K, its absorption spectrum shows significant absorption to somewhat longer wavelengths than the alkynyl complexes PtL1X (Fig. 3 and Table 1), but the spectrum rapidly changes in daylight or upon irradiation in the near-UV, losing the long-wavelength absorption tail. A change in the absorption spectrum upon irradiation is consistent with the light-activated trans to cis isomerisation observed by 1H NMR spectroscopy described above. Around 7–10 minutes with a standard laboratory hand-held UV lamp (6 W, λ = 365 nm) is sufficient to reach a photostationary state. Apparently, then, the lowest-energy spin-allowed transitions of the trans form of the complex must be lower in energy than those of the cis form.
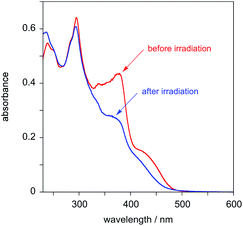 | ||
| Fig. 3 Absorption spectra of PtL2Cl in CH2Cl2 at 298 K before (red) and after (blue) irradiation with a UV lamp for 7 minutes. | ||
This tentative conclusion from the experimental data is supported by the results of time-dependent density functional theory (TD-DFT) calculations, carried out as described in the Experimental section. Examination of the 20 lowest-energy spin-allowed transitions at the ground-state geometry reveals that the cis form is indeed predicted to be blue-shifted relative to the trans (the simulated spectra using the ten lowest-energy singlet transitions are provided in Fig. S3†). The density difference plots for the lowest-energy singlet states show a significant degree of intraligand charge-transfer character from the styryl pendant to the dipyridylbenzene moiety (see Fig. S4 in the ESI†).
The photoluminescence also changes upon irradiation. The main observations can be summarised as follows:
(i) Before irradiation, the complex shows weak green phosphorescence in solution at room temperature when excited at wavelengths less than about 430 nm (Fig. 4). The structured emission profile, with the 0–0 vibrational band highest in intensity, is similar to that of Pt(dpyb)Cl.9,21a
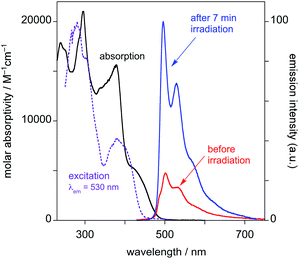 | ||
| Fig. 4 Emission spectra of PtL2Cl in CH2Cl2 at 298 K before and after irradiation with a UV lamp for 7 minutes (λex = 415 nm). | ||
(ii) Excitation into the long-wavelength absorption tail at λ > 450 nm gives no emission. Indeed, it can be seen that the excitation spectrum registered at λ = 530 nm lacks the low-energy tail that was observed in the absorption spectrum prior to irradiation.
(iii) After irradiation for 7 min with the UV lamp, the emission in the green region substantially increases in intensity (Fig. 4).
(iv) At 77 K in frozen glass (diethyl ether–iso-pentane–ethanol), the emission spectrum displays a set of vibrationally structured bands in the range 600–800 nm. Following irradiation (in solution at room temperature), and re-recording of the spectrum at 77 K, a new set of bands appears in the range 480–600 nm, the typical region for Pt(dpyb)Cl and its simple 5-alkyl derivatives,9,21a and the lower-energy bands lose intensity (Fig. 5).
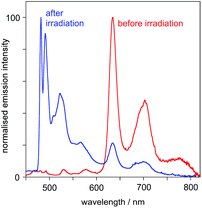 | ||
Fig. 5 Emission spectra of PtL2Cl at 77 K in diethyl ether–isopentane–ethanol (2![[thin space (1/6-em)]](https://www.rsc.org/images/entities/char_2009.gif) : :![[thin space (1/6-em)]](https://www.rsc.org/images/entities/char_2009.gif) 2 2![[thin space (1/6-em)]](https://www.rsc.org/images/entities/char_2009.gif) : :![[thin space (1/6-em)]](https://www.rsc.org/images/entities/char_2009.gif) 1 v/v) before and after UV irradiation. 1 v/v) before and after UV irradiation. | ||
We interpret these observations through the following assignments to the emission bands:
(A) The higher-energy emission in the 480–600 nm region can be attributed to the cis isomer of PtL2Cl, which emits – both at room temperature and at 77 K – much like Pt(dpyb)Cl and other derivatives with simple substituents in the 5-position of the aryl ring (e.g., PtL1Cl).
(B) The lower-energy bands in the 600–800 nm region – which are observed at 77 K only – can be assigned to the trans isomer, which shows no emission at room temperature in solution.
This assignment accounts for (i) the lack of emission in solution at room temperature upon excitation at λ > 450 nm, where the cis form does not absorb; (ii) the appearance of higher-energy bands (cis form) in the 77 K spectrum after irradiation and (iii) the increase in the room temperature emission intensity upon irradiation, as the cis form builds up. The fact that there is some emission from solution even before deliberate irradiation is probably due to the fact that isomerisation will occur as soon as the sample is exposed to the excitation source required to record the emission spectrum, and to the inevitable presence of some cis isomer formed as the sample is prepared. The observed low luminescence quantum yield observed for PtL2Cl in solution even in the cis form may be due to the competitive formation of a non-emissive excited state with a half-twisted conformation of the C![[double bond, length as m-dash]](https://www.rsc.org/images/entities/char_e001.gif) C unit. Similarly poor quantum yields were previously observed for a series of styryl-appended Pt(ppy)(acac) complexes, attributed to such a process.24
C unit. Similarly poor quantum yields were previously observed for a series of styryl-appended Pt(ppy)(acac) complexes, attributed to such a process.24
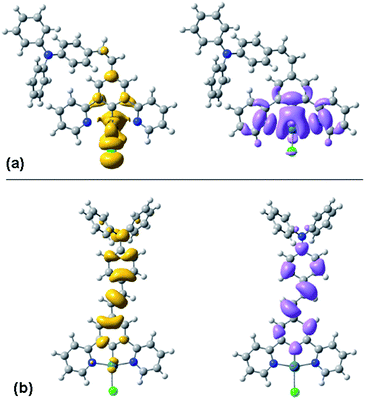
TD-DFT calculations are again informative in helping to understand the differing behaviour of the cis and trans forms. Fig. 6 shows the density difference plots for the lowest-energy triplet (T1) excited states of the two isomers, calculated at their triplet-state geometries. It can be seen that the triplet excited state of the cis form is largely located on the Pt(N^C^N)Cl moiety, with little involvement of the pendant. Indeed, the orbital parentage of the excited state is similar to that of the parent complex Pt(dpyb)Cl obtained using comparable calculations,21b consistent with the observation that the emission energy and the spectral profile of cis-PtL2Cl are similar to those of the parent. In contrast, the density difference plot for the triplet state of trans-PtL2Cl spans the metallated aryl ring, the C![[double bond, length as m-dash]](https://www.rsc.org/images/entities/char_e001.gif) C bond, and the pendent aniline unit (Fig. 6). There is a more extended conjugated unit, consistent with the unusually low emission energy compared to Pt(dpyb)Cl. Indeed, it is notable that the emission energy is not dissimilar to that of E-stilbene phosphorescence (λmax = 580 nm).25 It is also apparent from the density difference plot that metal orbitals seem to play a more minor role in the excited state compared to the cis. This might account for the longer lifetime of the emission bands of the trans compared to the cis form at 77 K (13 and 6.7 μs respectively, Table 1), since it is the influence of the metal that promotes the formally forbidden T1 → S0 phosphorescence process.
C bond, and the pendent aniline unit (Fig. 6). There is a more extended conjugated unit, consistent with the unusually low emission energy compared to Pt(dpyb)Cl. Indeed, it is notable that the emission energy is not dissimilar to that of E-stilbene phosphorescence (λmax = 580 nm).25 It is also apparent from the density difference plot that metal orbitals seem to play a more minor role in the excited state compared to the cis. This might account for the longer lifetime of the emission bands of the trans compared to the cis form at 77 K (13 and 6.7 μs respectively, Table 1), since it is the influence of the metal that promotes the formally forbidden T1 → S0 phosphorescence process.
OLED characterization
The three new complexes PtL1Cl, PtL1NCS, and PtL2Cl were examined as phosphors for OLEDs, in the form of neat films, where the intermolecular interactions might be expected to become important. OLEDs were fabricated by growing a sequence of thin layers on glass substrates pre-coated with indium tin oxide (ITO), transparent to the light generated in the emitting layer (EML) (see Experimental section for details). Holes were injected from the ITO/Mo2Ox anode, and passed through a 80 nm thick hole-transporting layer composed of TCTA. They recombine in the EML (15 nm thick layer of the pure Pt(II) complex) with electrons injected from an Al/LiF cathode and transported through a 25 nm layer of TPBi (1,3,5-tris(N-phenyl-benzimidazol-2-yl)benzene).Fig. 7 and 8 show the plots of luminance and electroluminescence intensity, respectively, versus voltage for the OLEDs prepared with the neat platinum(II) complexes as emitting layers, whilst Fig. 9 shows the electroluminescence quantum efficiencies (EL QE) versus the electric current density. Clearly, although the three complexes have a similar brightness and electroluminescence intensity, PtL2Cl is the best candidate for the preparation of OLEDs, since its device is characterized by a high electroluminescence quantum efficiency (QE). The much lower QE of the devices incorporating PtL1Cl and PtL1NCS can be attributed to some degradation, as confirmed by the unstable electroluminescence spectra of the related OLEDs (see ESI†).
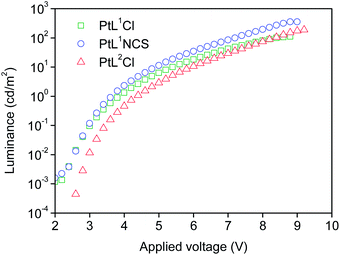 | ||
| Fig. 7 Luminance versus applied voltage of the OLEDs using the neat complexes as emitting layers. The device incorporating PtL1Cl is shown in green, PtL1NCS is in blue, and PtL2Cl in red. | ||
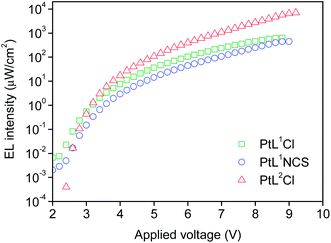 | ||
| Fig. 8 Electroluminescence intensity versus applied voltage of the OLEDs using the neat complex as EML; colours as in Fig. 7. | ||
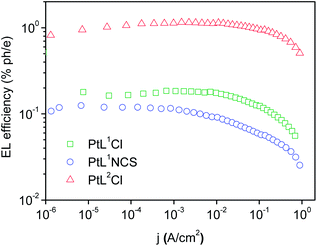 | ||
| Fig. 9 External quantum efficiencies versus electric current density for the OLEDs using the neat complex as EML; colours as in Fig. 8. | ||
The electroluminescence spectrum of the OLED based on neat PtL2Cl as an emitting layer is stable (all measurements were reproduced for many runs, excluding any irreversible chemical and morphological changes in the devices) and it exhibits a very broad, low-energy, structureless band around 800 nm (Fig. 10), described by CIE coordinates x = 0.673 and y = 0.315.
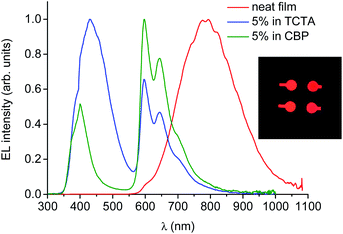 | ||
| Fig. 10 Electroluminescence spectra of OLEDs incorporating PtL2Cl as a neat film or doped in TCTA or CBP as the emitting layer at 8 V. Photo of the NIR-OLEDs (inset). | ||
This spectrum is very different from that typical of devices based on other reported platinum(II) derivatives with cyclometallated 1,3-di(2-pyridyl)benzene ligands, which exhibit excimer-like emission from neat films, with λmax around 685 nm.5c,d,g Such an EL spectrum, drastically shifted into the NIR spectral region, is of particular interest for these kinds of complexes. A comparably low-energy emission has been previously observed only for PtLmesNCS, as mentioned in the Introduction.16 As in the latter complex, the metal–metal interactions within the neat film apparently lead to the formation of low-energy aggregates that emit in the NIR region. The NIR OLED shows the best performance with an EL intensity of about 10 mW cm−2 at 9 V and a maximum QE of 1.2% ph/e at a current density of 10 mA cm−2. It is worth noting that the QE of this device remains fairly constant over a wide range of current density from 10−3 to 400 mA cm−2.
On the other hand, the EL spectra of the OLEDs with 5 wt% of PtL2Cl in TCTA or CBP are quite similar to one another and are clearly characterized by emission from the monomolecular excited states of the trans isomer around 600 nm together with a contribution of the TCTA or CBP emission bands (Fig. 10, blue and green lines respectively). The CIE coordinates are x = 0.302, y = 0.203 and x = 0.537, y = 0.203 for films in TCTA and CBP, respectively. The plots of luminescence versus applied voltage and external quantum efficiencies versus electric current density are shown in the ESI.†
Conclusions
In summary, we have prepared and characterized two new highly luminescent N^C^N pincer ligands incorporating triple ArC![[triple bond, length as m-dash]](https://www.rsc.org/images/entities/char_e002.gif) C– (HL1) or double ArCH
C– (HL1) or double ArCH![[double bond, length as m-dash]](https://www.rsc.org/images/entities/char_e001.gif) CH– (HL2) bonds at the 5-position of the central aryl ring, together with their cyclometallated platinum(II) complexes PtL1X (X = Cl, NCS) and PtL2Cl. Complexes PtL1X display high photoluminescence quantum yields in solution. They also have much higher molar absorptivities than the parent complex Pt(dpyb)Cl and its simple 5-aryl derivatives, the ε values in the 350–400 nm region being around 3–4 times greater. In the field of luminescent probes, for example in bioimaging and sensing, it is currently popular to refer to a “brightness” index, which is the product of the extinction coefficient and quantum yield, reflecting the importance of both quantities in determining suitability for practical use.26 In the case of the new complexes PtL1X, although the quantum yield is somewhat compromised compared to the parent (factor of 2), it is clear that their brightness would be significantly superior owing to the beneficial effect of the substituent on the ε values.
CH– (HL2) bonds at the 5-position of the central aryl ring, together with their cyclometallated platinum(II) complexes PtL1X (X = Cl, NCS) and PtL2Cl. Complexes PtL1X display high photoluminescence quantum yields in solution. They also have much higher molar absorptivities than the parent complex Pt(dpyb)Cl and its simple 5-aryl derivatives, the ε values in the 350–400 nm region being around 3–4 times greater. In the field of luminescent probes, for example in bioimaging and sensing, it is currently popular to refer to a “brightness” index, which is the product of the extinction coefficient and quantum yield, reflecting the importance of both quantities in determining suitability for practical use.26 In the case of the new complexes PtL1X, although the quantum yield is somewhat compromised compared to the parent (factor of 2), it is clear that their brightness would be significantly superior owing to the beneficial effect of the substituent on the ε values.
Contrary to the C![[triple bond, length as m-dash]](https://www.rsc.org/images/entities/char_e002.gif) C-substituted complexes, the photoluminescence quantum yield of PtL2Cl is very low in solution at room temperature, due to competitive photoinduced trans-to-cis isomerisation of the diphenyl-aminostyryl C
C-substituted complexes, the photoluminescence quantum yield of PtL2Cl is very low in solution at room temperature, due to competitive photoinduced trans-to-cis isomerisation of the diphenyl-aminostyryl C![[double bond, length as m-dash]](https://www.rsc.org/images/entities/char_e001.gif) C bond.
C bond.
OLEDs have been prepared using the new compounds as phosphorescent emitters. Remarkably, the best electroluminescence quantum efficiencies are obtained with PtL2Cl. The isomerisation process observed under photoexcitation evidently does not occur in the emissive layer under electrically driven conditions. This study highlights how photoluminescence performance in solution is not necessarily a good guide to electroluminescence efficiency in a device.
PtL2Cl appears as an excellent candidate for the preparation of NIR-OLEDs. The electroluminescence intensity of the studied NIR-OLED is three times higher than the previously reported NIR-OLED based on a neat film of PtLmesNCS,16 whilst the maximum external quantum efficiency is enhanced by 20%. The stability and the limited efficiency-roll-off of the NIR-OLED at high current density are good characteristics for applications requiring high NIR intensity. NIR-emitting systems have diverse potential applications, including communications and night vision-readable displays, as well as offering superior biocompatibility for medical systems since biological tissue is most transparent to light in the NIR.
Acknowledgements
This work was supported in Italy by MIUR (FIRB 2004: RBPR05JH2P) and Consorzio MIST E-R (project FESR-Tecnopolo AMBIMAT), and in the U.K. by EPSRC (EP/G06928X/1).Notes and references
- M. A. Baldo, D. F. O'Brien, Y. You, A. Shoustikov, S. Sibley, M. E. Thompson and S. R. Forest, Nature, 1998, 395, 151 CrossRef CAS PubMed.
- (a) Highly Efficient OLEDs with Phosphorescent Materials, ed. H. Yersin, Wiley-VCH, Weinheim, 2008 Search PubMed; (b) Organic light-emitting diodes: Materials, devices and applications, ed. A. Buckley, Woodhead, Cambridge, 2013 Search PubMed.
- (a) Y. Chi and P.-T. Chou, Chem. Soc. Rev., 2010, 39, 638 RSC; (b) P.-T. Chou, Y. Chi, M.-W. Chung and C.-C. Lin, Coord. Chem. Rev., 2011, 255, 2653 CrossRef CAS PubMed; (c) G. Zhou, W.-Y. Wong and X. L. Yang, Chem. – Asian J., 2011, 6, 1706 CrossRef CAS PubMed; (d) C. L. Ho and W.-Y. Wong, New J. Chem., 2013, 37, 1665 RSC.
- For reviews, see for example: (a) D. R. McMillin and J. J. Moore, Coord. Chem. Rev., 2002, 229, 113 CrossRef CAS; (b) S.-W. Lai and C.-M. Che, Top. Curr. Chem., 2004, 241, 27 CrossRef CAS; (c) B. Ma, P. Djurovich and M. E. Thompson, Coord. Chem. Rev., 2005, 249, 1501 CrossRef CAS PubMed; (d) F. N. Castellano, I. E. Pomestchenko, E. Shikhova, F. Hua, M. L. Muro and N. Rajapakse, Coord. Chem. Rev., 2006, 250, 1819 CrossRef CAS PubMed; (e) K. M.-C. Wong and V. W.-W. Yam, Coord. Chem. Rev., 2007, 251, 2477 CrossRef CAS PubMed; (f) J. A. G. Williams, Top. Curr. Chem., 2007, 281, 205 CrossRef CAS; (g) J. A. G. Williams, S. Develay, D. L. Rochester and L. Murphy, Coord. Chem. Rev., 2008, 252, 2596 CrossRef PubMed; (h) W.-Y. Wong and C.-L. Ho, Coord. Chem. Rev., 2009, 253, 1709 CrossRef CAS PubMed; (i) A. F. Rausch, H. H. H. Homeier and H. Yersin, Top. Organomet. Chem., 2010, 29, 193 CrossRef CAS; (j) Y. Chi and P.-T. Chou, Chem. Soc. Rev., 2010, 39, 638 RSC; (k) L. Murphy and J. A. G. Williams, Top. Organomet. Chem., 2010, 28, 75 CrossRef CAS; (l) C. A. Strassert, C.-H. Chien, M. D. Galvez Lopez, D. Kourkoulos, D. Hertel, K. Meerholz and L. De Cola, Angew. Chem., Int. Ed., 2011, 50, 946 CrossRef CAS PubMed; (m) J. Kalinowski, V. Fattori, M. Cocchi and J. A. G. Williams, Coord. Chem. Rev., 2011, 255, 2401 CrossRef CAS PubMed.
- Recent examples with Pt(II) include: (a) A. Y.-Y. Tam, D. P.-K. Tsang, M. Y. Chan, N. Y. Zhu and V. W.-W. Yam, Chem. Commun., 2011, 47, 3383 RSC; (b) C. A. Strassert, C.-H. Chien, M. D. Galvez Lopez, D. Kourkoulos, D. Hertel, K. Meerholz and L. De Cola, Angew. Chem., Int. Ed., 2011, 50, 946 CrossRef CAS PubMed; (c) W. Mroz, C. Botta, U. Giovanella, E. Rossi, A. Colombo, C. Dragonetti, D. Roberto, R. Ugo, A. Valore and J. A. G. Williams, J. Mater. Chem., 2011, 21, 8653 RSC; (d) E. Rossi, L. Murphy, P. L. Brothwood, A. Colombo, C. Dragonetti, D. Roberto, R. Ugo, M. Cocchi and J. A. G. Williams, J. Mater. Chem., 2011, 21, 15501 RSC; (e) V. N. Kozhevnikov, M. C. Durrant and J. A. G. Williams, Inorg. Chem., 2011, 50, 6304 CrossRef CAS PubMed; (f) S. C. F. Hui, P. K. Chow, G. S. M. Tong, S.-L. Lai, G. Cheng, C.-C. Kwok, K.-H. Low, M. Y. Ko and C.-M. Che, Chem. – Eur. J., 2013, 19, 69 CrossRef PubMed; (g) E. Rossi, A. Colombo, C. Dragonetti, D. Roberto, R. Ugo, A. Valore, L. Falciola, P. Brulatti, M. Cocchi and J. A. G. Williams, J. Mater. Chem., 2012, 22, 10650 RSC; (h) J. Zhang, F. C. Zhao, X. J. Zhu, W.-K. Wong, D. G. Ma and W.-Y. Wong, J. Mater. Chem., 2012, 22, 16448 RSC; (i) N. K. Allampally, C. A. Strassert and L. De Cola, Dalton Trans., 2012, 41, 13132 RSC; (j) X.-C. Hang, T. Fleetham, E. Turner, J. Brooks and J. Li, Angew. Chem., Int. Ed., 2013, 52, 6753 CrossRef CAS PubMed; (k) E. Turner, N. Bakken and J. Li, Inorg. Chem., 2013, 52, 7344 CrossRef CAS PubMed; (l) S. Culham, P.-H. Lanoë, V. L. Whittle, M. C. Durrant, J. A. G. Williams and V. N. Kozhevnikov, Inorg. Chem., 2013, 52, 10992 CrossRef CAS PubMed.
- (a) D. R. McMillin and J. J. Moore, Coord. Chem. Rev., 2002, 229, 113 CrossRef CAS; (b) R. McGuire, Jr, M. C. McGuire and D. R. McMillin, Coord. Chem. Rev., 2010, 254, 2574 CrossRef PubMed.
- (a) A. F. Rausch, L. Murphy, J. A. G. Williams and H. Yersin, Inorg. Chem., 2009, 48, 11407 CrossRef CAS PubMed; (b) A. F. Rausch, L. Murphy, J. A. G. Williams and H. Yersin, Inorg. Chem., 2012, 51, 312 CrossRef CAS PubMed; (c) L. Murphy, P. Brulatti, V. Fattori, M. Cocchi and J. A. G. Williams, Chem. Commun., 2012, 48, 5817 RSC.
- D. J. Cardenas, A. M. Echavarren and M. C. Ramirez de Arellano, Organometallics, 1999, 18, 3337 CrossRef CAS.
- (a) J. A. G. Williams, A. Beeby, E. S. Davies, J. A. Weinstein and C. Wilson, Inorg. Chem., 2003, 42, 8609 CrossRef CAS PubMed; (b) J. A. G. Williams, Chem. Soc. Rev., 2009, 38, 1783 RSC.
- E. Rossi, A. Colombo, C. Dragonetti, S. Righetto, D. Roberto, R. Ugo, A. Valore, J. A. G. Williams, M. G. Lobello, F. De Angelis, S. Fantacci, I. Ledoux-Rak, A. Singh and J. Zyss, Chem. – Eur. J., 2013, 19, 9875 CrossRef CAS PubMed.
- M. Cocchi, D. Virgili, V. Fattori, D. L. Rochester and J. A. G. Williams, Adv. Funct. Mater., 2007, 17, 285 CrossRef CAS.
- E. M. Kober, J. V. Caspar, R. S. Lumpkin and T. J. Meyer, J. Phys. Chem., 1986, 90, 3722 CrossRef CAS.
- (a) J. Kido and Y. Okamoto, Chem. Rev., 2002, 102, 2357 CrossRef CAS PubMed; (b) A. O'Riordan, E. O'Connor, S. Moynihan, P. Nockemann, P. Fias, R. Van Deun, D. Cupertino, P. Mackie and G. Redmond, Thin Solid Films, 2006, 497, 299 CrossRef CAS PubMed.
- (a) C. Borek, K. Hanson, P. I. Djurovich, M. E. Thompson, K. Aznavour, R. Bau, Y. Sun, S. R. Forrest, J. Brooks, L. Michalski and J. Brown, Angew. Chem., Int. Ed., 2007, 46, 1109 CrossRef CAS PubMed; (b) Y. Sun, C. Borek, K. Hanson, P. I. Djurovich, M. E. Thompson, J. Brooks and J. Brown, Appl. Phys. Lett., 2007, 90, 213503 CrossRef PubMed.
- (a) W. Lu, M. C. W. Chan, N. Zhu, C. M. Che, C. Li and Z. Hui, J. Am. Chem. Soc., 2004, 126, 7639 CrossRef CAS PubMed; (b) J. Kalinowski, M. Cocchi, L. Murphy, J. A. G. Williams and V. Fattori, Chem. Phys., 2010, 378, 47 CrossRef CAS PubMed.
- E. Rossi, A. Colombo, C. Dragonetti, D. Roberto, F. Demartin, M. Cocchi, P. Brulatti, V. Fattori and J. A. G. Williams, Chem. Commun., 2012, 48, 3182 RSC.
- E. Diez-Barra, J. C. Garcìa-Martìnez, S. Merino, R. del Rey, J. Rodrìguez-Lòpez, P. Sànchez-Verdù and J. Tejeda, J. Org. Chem., 2001, 66, 5664 CrossRef CAS PubMed.
- Z. Wang, E. Turner, V. Mahoney, S. Madakuni, T. Groy and J. Li, Inorg. Chem., 2010, 49, 11276 CrossRef CAS PubMed.
- S. R. Meech and D. Phillips, J. Photochem., 1983, 23, 193 CrossRef CAS.
- K. Nakamaru, Bull. Chem. Soc. Jpn., 1982, 55, 2697 CrossRef CAS.
- (a) S. J. Farley, D. L. Rochester, A. L. Thompson, J. A. K. Howard and J. A. G. Williams, Inorg. Chem., 2005, 44, 9690 CrossRef CAS PubMed; (b) D. L. Rochester, S. Develay, S. Záliš and J. A. G. Williams, Dalton Trans., 2009, 1728 RSC.
- M. J. Frisch, G. W. Trucks, H. B. Schlegel, G. E. Scuseria, M. A. Robb, J. R. Cheeseman, G. Scalmani, V. Barone, B. Mennucci, G. A. Petersson, H. Nakatsuji, M. Caricato, X. Li, H. P. Hratchian, A. F. Izmaylov, J. Bloino, G. Zheng, J. L. Sonnenberg, M. Hada, M. Ehara, K. Toyota, R. Fukuda, J. Hasegawa, M. Ishida, T. Nakajima, Y. Honda, O. Kitao, H. Nakai, T. Vreven, J. A. Montgomery, Jr, J. E. Peralta, F. Ogliaro, M. Bearpark, J. J. Heyd, E. Brothers, K. N. Kudin, V. N. Staroverov, R. Kobayashi, J. Normand, K. Raghavachari, A. Rendell, J. C. Burant, S. S. Iyengar, J. Tomasi, M. Cossi, N. Rega, J. M. Millam, M. Klene, J. E. Knox, J. B. Cross, V. Bakken, C. Adamo, J. Jaramillo, R. Gomperts, R. E. Stratmann, O. Yazyev, A. J. Austin, R. Cammi, C. Pomelli, J. W. Ochterski, R. L. Martin, K. Morokuma, V. G. Zakrzewski, G. A. Voth, P. Salvador, J. J. Dannenberg, S. Dapprich, A. D. Daniels, Ö. Farkas, J. B. Foresman, J. V. Ortiz, J. Cioslowski and D. J. Fox, Gaussian 09, 2009 Search PubMed.
- (a) P. Perdew, K. Burke and M. Ernzerhof, Phys. Rev. Lett., 1996, 77, 3865 CrossRef; (b) J. Preat, C. Michaux, A. Lewalle, E. A. Perpète and D. Jacquemin, Chem. Phys. Lett., 2008, 451, 37 CrossRef CAS PubMed.
- B. Yin, F. Niemeyer, J. A. G. Williams, J. Jiang, A. Boucekkine, L. Toupet, H. Le Bozec and V. Guerchais, Inorg. Chem., 2006, 45, 8584 CrossRef CAS PubMed.
- J. Saltiel, G.-E. Khalil and K. Schanze, Chem. Phys. Lett., 1980, 70, 233 CrossRef CAS.
- For example: A. Bourdrolle, M. Allali, A. D'Aléo, P. L. Baldeck, K. Kamada, J. A. G. Williams, H. Le Bozec, C. Andraud and O. Maury, ChemPhysChem, 2013, 14, 3361 CrossRef PubMed.
Footnote |
| † Electronic supplementary information (ESI) available: NMR data for trans–cis isomerisation of PtL2Cl in solution; absorption and emission spectra of PtL1NCS; simulated absorption spectra of cis and transPtL2Cl obtained by TD-DFT calculations and additional OLED data. See DOI: 10.1039/c3tc32086c |
| This journal is © The Royal Society of Chemistry 2014 |

