
 Open Access Article
 This Open Access Article is licensed under a
 Creative Commons Attribution 3.0 Unported Licence
Cellular uptake of ribonuclease A-functionalised core–shell silica microspheres†
G. F.
Chimonides
a,
J. M.
Behrendt
b,
E.
Chundoo
a,
C.
Bland
c,
A. V.
Hine
d,
A.
Devitt
c,
D. A.
Nagel
d and
A. J.
Sutherland
*a
aChemical Engineering & Applied Chemistry, School of Engineering & Applied Science, Aston University, Birmingham, B4 7ET, UK. E-mail: a.j.sutherland@aston.ac.uk
bSchool of Chemistry, University of Manchester, Oxford Road, Manchester, M13 9PL, UK
cAston Research Centre for Healthy Ageing, School of Life & Health Sciences, Aston University, Birmingham, B4 7ET, UK
dSchool of Life & Health Sciences, Aston University, Birmingham, B4 7ET, UK
First published on 27th August 2014
Abstract
Analysis of protein function in a cellular context ideally requires physiologically representative levels of that protein. Thus conventional nucleic acid-based transfection methods are far from ideal owing to the over expression that generally results. Likewise, fusions with protein transduction domains can be problematic whilst delivery via liposomes/nanoparticles typically results in endosomal localisation. Recently, polymer microspheres have been reported to be highly effective at delivering proteins into cells and thus provide a viable new alternative for protein delivery (protein transduction). Herein we describe the successful delivery of active ribonuclease A into HeLa cells via novel polymer core–silica shell microspheres. Specifically, poly(styrene-co-vinylbenzylisothiouronium chloride) core particles, generated by dispersion polymerisation, were coated with a poly(styrene-co-trimethoxysilylpropyl methacrylate) shell. The resultant core–shell morphology was characterised by transmission electron, scanning electron and confocal fluorescence microscopies, whilst size and surface charge was assessed by dynamic light scattering and zeta-potential measurements, respectively. Subsequently, ribonuclease A was coupled to the microspheres using simple carbodiimide chemistry. Gel electrophoresis confirmed and quantified the activity of the immobilised enzyme against purified HeLa RNA. Finally, the polymer–protein particles were evaluated as protein-transduction vectors in vitro to deliver active ribonuclease A to HeLa cells. Cellular uptake of the microspheres was successful and resulted in reduced levels of both intracellular RNA and cell viability.
Introduction
The study of a protein's activity within living cells is a fundamental requirement for understanding the role of that protein. Moreover, such studies also offer insight into how to modify this role and even how to prevent the protein from fulfilling its normal function altogether. To this end, a number of techniques for introducing proteins into cells have been developed. The most common of which are transfection-based methods,1 protein fusion-based methods,2 and liposomal/nanoparticle-based methods.3Unfortunately, for the delivery of functional proteins each of these method types is problematic. Transfection of DNA followed by intracellular protein expression, for example, whilst effective at introducing functionally active proteins into a cell, relies on normal transcription and translation processes and as such both precludes careful quantitative analysis and typically results in intracellular protein levels being far higher than normal. As an alternative approach, proteins can be produced as fusions with peptide sequences that possess known cell penetrating capabilities. An example of such a sequence is YGRKKRRQRRR which is the protein transduction domain of the HIV-TAT protein.4 Unfortunately, when protein-fusions produced in this way are incubated with cells, they typically enter the cells by one of a number of different endocytosis-based mechanisms e.g. receptor-mediated endocytosis, macropinocytosis etc. Regardless of which precise endocytosis mechanism is used to effect cellular entry, the process normally results in fusion with lysosomes, cellular organelles whose specific role is to degrade materials either no longer needed by the cell or else which have been taken up by the cell.5 A similar fate can befall entities delivered in liposomal preparations or indeed in/on nanoparticle preparations where, again, endocytosis is the typical mechanism of uptake for these delivery vectors. Consequently, whilst relatively robust small organic molecules, such as pharmaceutical molecules, can be delivered effectively in vivo using transduction domains, liposomes, nanoparticles etc., functionally-active proteins are far more prone to lysosomal degradation and cannot be delivered reliably in this manner.
It has been shown recently, by chemical analysis, microscopic analysis and gene expression, that polymer-based microspheres are taken up readily by all sorts of different cell lines via a non-endocytosis-reliant mechanism.6 Although it is difficult to discern the precise mechanism of uptake, it is thought to be via passive diffusion that involves a rearrangement of the cell membrane to allow the microsphere to pass through. This finding provides the opportunity for a good solution to the problem of functional protein delivery to cells. Originally observed and reported by the Bradley group,7 we and others have now also been able to show that polystyrene-based microspheres enter non-phagocytic cell lines easily and with very high efficiencies, typically more than 90% of the cells take up microspheres following a simple incubation process. This is a remarkable phenomenon given the relative size of the microspheres involved (typically 1–2 microns in diameter) to the size of cells (typically eukaryotic cells are 10–20 microns). Moreover, the microspheres can carry molecular cargoes, such as siRNAs8 and even proteins,9,10 with them into the cells. Pivotal for the delivery of functional proteins is the fact that this microsphere-based delivery method, termed beadfection, is non-endocytosis-based and thus enables the delivered proteins to avoid the harsh lysosomal environment.6
To date the only types of microsphere that have been employed in beadfection have been polystyrene-based. Silica-containing materials have not yet been evaluated. This would be a logical extension since silica particles have been used for drug delivery and are noted for their biocompatibility.11 Indeed, highly cross-linked silica-based nano- and microspheres, generated using sol–gel chemistry, have been used for both chemical sensing12–16 and biomedical applications.17–29 Silica can also be used to coat polymer particles to form hybrid materials suitable for use in the body.11 Moreover, the functionalised core–shell architecture that this approach creates is particularly attractive for beadfection since core and shell may bear different entities. For example, it would enable a reporter element, such as a fluorescent probe, to be located in the core whilst a protein may be attached to the shell.
Our previous work on beadfection had centred on delivering green fluorescent protein (GFP) into cells, primarily so we could use the inherent fluorescence of the protein to study the beadfection process.9,10 Whilst an excellent reporter element in its own right, GFP does not chemically modify other molecules within the cell.30 Accordingly, a better test of the beadfection process for importing functional proteins would be to import a pharmaceutically relevant protein. Ribonuclease A (RNase) is just such a protein and degrades RNA by cleavage of the phosphodiester bond in the backbone following pyrimidine bases. Moreover, RNase has been identified by several groups as a potential anti-cancer agent.31,32
Herein we describe our new and refined approach to beadfection for the delivery of functional proteins into cells. Specifically, the synthesis of polymeric-silica core–shell microspheres, prepared via seeded-emulsion and sol–gel polymerisation techniques is described. The multi-functionality of this system is exemplified by concomitant conjugation of two fluorescent probes and the functional protein, RNase. Finally, the delivery of the functional protein in vitro has been investigated with HeLa cells and demonstrates that the microspheres we have developed are an excellent platform with which to study functional protein transduction in vitro.
Results and discussion
Microsphere synthesis
Dual-functionalised microspheres were synthesised by dispersion polymerisation of styrene-based core microspheres, followed by seeded-emulsion and sol–gel polymerisation of an outer shell (Scheme 1). Amine-functionalised microspheres 3 produced in this way were characterised by scanning electron microscopy (SEM) and confocal fluorescence microscopy (Fig. 1). The former showed the microspheres were roughly spherical and approximately 1 micron in diameter, whilst the latter confirmed the core–shell structure of the particles. Transmission electron microscopy (TEM) also supported the core–shell structure (see ESI, Fig. S5†). Energy dispersive X-ray analysis (EDXA) of a single bead provided confirmation that the beads contained a high degree of both silica and oxygen (see ESI, Fig. S6†). | ||
| Scheme 1 Preparation of RNase-functionalised microspheres 6 with a TR (red)-labelled core and FITC (green)-labelled shell. (A) (i) Texas Red maleimide (TR), DMF, 16 h, (ii) TMSPM, styrene, DVB, AIBN, SDS, H2O, N2, 70 °C, 5 h to yield trimethoxysilane-functionalised microspheres 2. (B) APTMS, TEOS, FITC, NH4+OH−, H2O, 50 °C, 2 h to yield amine-functionalised microspheres 3. (C) SPDP, DMF, PBS, 1 h to yield pyridyl-functionalised microspheres 4. (D) 3-mercaptopropionic acid, DMF, 1 h to yield carboxylic acid-functionalised microspheres 5. (E) (i) EDAC, MES pH 5.5, H2O, 1 h, (ii) RNase, MES pH 5.5, H2O, 2 h to yield RNase-functionalised microspheres 6. | ||
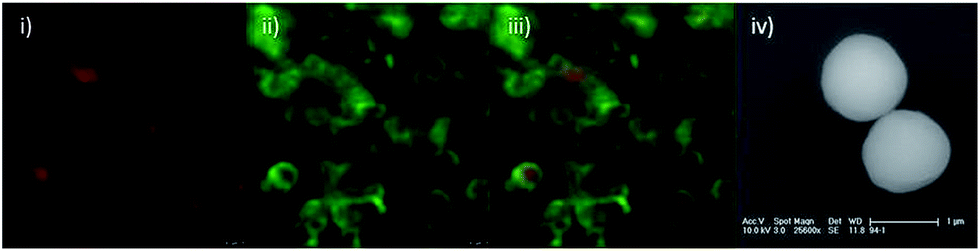 | ||
| Fig. 1 Confocal fluorescence microscopy and SEM micrographs of amine-functionalised core–shell microspheres 3 with TR (red)-labelled cores and FITC (green)-labelled shells. Confocal fluorescence images were obtained using a 488 nm excitation laser at 15% power, and a 100× oil emersion objective with 12× zoom; (i) fluorescence emission collected in Channel 1 between 590 nm and 630 nm, (ii) fluorescence emission collected in Channel 2 between 500 nm and 560 nm, (iii) overlay of Channel 1 and Channel 2, (iv) SEM micrograph, scale bar represents 1 μm. | ||
The core–shell synthetic strategy permits orthogonal functionality where thiouronium-functionalised core and amine-functionalised shell can be exploited independently. This was exemplified by further derivatisation of amine-functionalised microspheres 3 to produce RNase-functionalised microspheres 6 with two fluorescent markers (Texas Red in the core with a FITC-containing shell).
In a separate experiment, conjugation of RNase to the surface of the microspheres was assessed by fluorescence microscopy. This was achieved by the synthesis of core–shell microspheres without fluorescein isothiocyanate (FITC) in the silica shell 3a. After which, RNase partially labelled with FITC (for protocol see ESI†), was conjugated to these microspheres as depicted in Scheme 2. Confocal fluorescence microscopy confirmed the conjugation of RNase to the surface of the particles (Fig. 2). As a control experiment, the same procedure was conducted without the addition of the EDAC coupling reagent. Subsequent analysis of these control microspheres showed no fluorescence from the labelled RNase, verifying that non-specific adsorption of RNase did not occur (see ESI,† Fig. S7).
 | ||
| Scheme 2 Preparation of variants of RNase-functionalised microspheres used in different experiments. (6a) TR (red)-labelled core, unlabelled shell with FITC (green)-labelled RNase, (6b) no labels and (6c) unlabelled core and FITC (green)-labelled shell. Thiouronium-functionalised microspheres 1 synthesised by dispersion polymerisation with 4-VBTU, styrene, DVB, AIBN, PVP, EtOH, N2, 70 °C, 16 h. Followed by (A) (i) TR, DMF, 16 h, (ii) TMSPM, styrene, DVB, AIBN, SDS, H2O, N2, 70 °C, 5 h to yield trimethoxysilane-functionalised microspheres 2. (B) APTMS [(B) (ii) with FITC], TEOS, NH4+OH−, H2O, 50 °C, 2 h to yield amine-functionalised microspheres 3a, 3b and 3c. (C) SPDP, DMF, PBS, 1 h to yield pyridyl-functionalised microspheres 4a, 4b and 4c. (D) 3-mercaptopropionic acid, DMF, 1 h to yield carboxylic acid-functionalised microspheres 5a, 5b and 5c. (E) (i) EDAC, MES pH 5.5, H2O, 1 h, (ii) RNase [6a with FITC (green)-labelled RNase], MES pH 5.5, H2O, 2 h to yield RNase-functionalised microspheres 6a, 6b and 6c. | ||
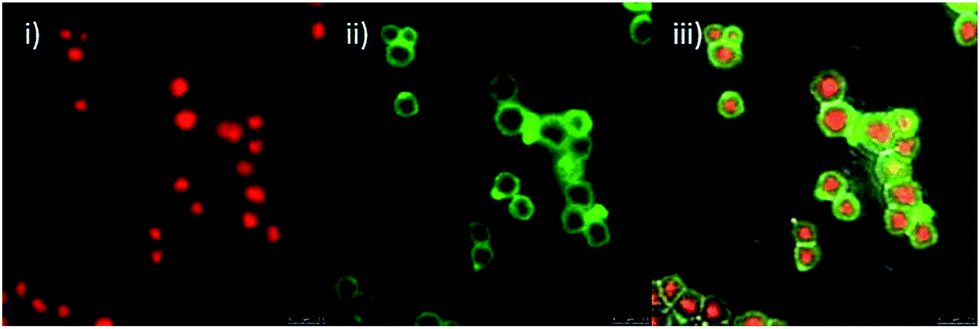 | ||
| Fig. 2 Confocal microscopy images of core–shell microspheres 6a having TR (red)-labelled cores, unlabelled shells and FITC (green)-labelled RNase conjugated to the outer shell. Images were obtained using a 488 nm excitation laser at 15% power, and a 100× oil emersion objective with 12× zoom; (i) fluorescence emission collected in Channel 1 between 590 nm and 630 nm, (ii) fluorescence emission collected in Channel 2 between 500 nm and 560 nm, (iii) overlay of Channel 1, Channel 2 and the phase channel. | ||
Characterisation of surface functionality
![[thin space (1/6-em)]](https://www.rsc.org/images/entities/char_2009.gif) :1 ratio with TEOS, results in an increased loading of amine groups. This was quantified by a two-step assay35 with amine-functionalised microspheres 3b. Firstly, Fmoc–Lys–(Fmoc)–OH was conjugated to the amine groups. Secondly, both Fmoc moieties were cleaved with DBU and amino acid loading quantified by the characteristic absorbance at 294 and 305 nm of the Fmoc cleavage product.35 These absorbance values were used to calculate the number of moles of cleaved Fmoc, and by extension the molar loading of our amine-functionalised microspheres 3b. This strategy also exemplifies this microsphere system as a versatile template for covalent attachment of other desired compounds. The assay confirms that the amine-loading can be tailored readily within a defined range of between 0.20 and 0.47 mmol g−1 (see ESI,† Fig. S2).
:1 ratio with TEOS, results in an increased loading of amine groups. This was quantified by a two-step assay35 with amine-functionalised microspheres 3b. Firstly, Fmoc–Lys–(Fmoc)–OH was conjugated to the amine groups. Secondly, both Fmoc moieties were cleaved with DBU and amino acid loading quantified by the characteristic absorbance at 294 and 305 nm of the Fmoc cleavage product.35 These absorbance values were used to calculate the number of moles of cleaved Fmoc, and by extension the molar loading of our amine-functionalised microspheres 3b. This strategy also exemplifies this microsphere system as a versatile template for covalent attachment of other desired compounds. The assay confirms that the amine-loading can be tailored readily within a defined range of between 0.20 and 0.47 mmol g−1 (see ESI,† Fig. S2).
| Microspheres | Zeta potential/mV | FWHM/mV |
|---|---|---|
| Thiouronium-functionalised microspheres 1 | +7.26 | 2.17 |
| Trimethoxysilane-functionalised microspheres 2 | −44.45 | 2.82 |
| Amine-functionalised microspheres 3 | −19.99 | 2.27 |
| Pyridyl-functionalised microspheres 4 | +12.74 | 2.91 |
| Carboxylic acid-functionalised microspheres 5 | −18.74 | 2.77 |
| RNase-functionalised microspheres 6 | +7.41 | 2.33 |
Activity of conjugated RNase
One unit of RNase degrades 100 ng of RNA per second and 1 mg of the RNase used in this study has approximately 35000 units of activity. A preliminary experiment demonstrated that our microspheres have no inherent degradative activity, whilst RNase retains activity when immobilised. Specifically, total RNA from HeLa cells was incubated with both carboxylic acid-functionalised microspheres 5b and RNase-functionalised microspheres 6b and the products compared with intact HeLa RNA using gel electrophoresis (Fig. 3). The similarity between the RNA products in lanes 1 (control) and 2 shows that RNA treated with carboxylic acid-functionalised microspheres 5b remains intact. In contrast, the small size of the product in lane 3 confirms there is high degradative activity displayed by RNase-functionalised microspheres 6b, as expected.
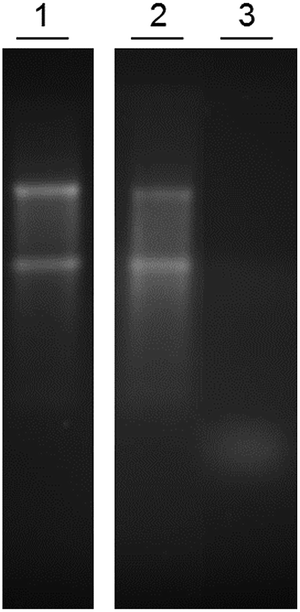 | ||
| Fig. 3 Gel electrophoresis to compare the activity of carboxylic acid-functionalised microspheres 5b against RNase-functionalised microspheres 6b. Each reaction was carried out with 1.5 μg of RNA. Lane (1) no treatment, (2) 5 μg of carboxylic acid-functionalised microspheres 5b (no RNase) for 5 minutes, (3) 5 μg of RNase-functionalised microspheres 6b for 5 minutes. | ||
To estimate the quantity of accessible, active RNase immobilised on microspheres 6b, RNA degradation catalysed by decreasing quantities of native RNase was compared with RNA degradation catalysed by decreasing quantities of microspheres 6b. Specifically, aliquots containing 0.100, 0.075, 0.050, 0.025 and 0.001 units of native RNase (2.86, 2.15, 1.43, 0.72 and 0.03 ng, respectively) were compared with 1000, 100, 10, and 1 ng of RNase-functionalised microspheres 6b under the conditions outlined in the Experimental section and the products examined by gel electrophoresis (Fig. 4). The smaller the RNA product, the further it migrates in electrophoresis (towards the bottom of the gel). Whilst the two discreet 28S and 18S bands are clearly visible in lanes 1 (untreated RNA) and 10 (1 ng of microspheres 6b), these bands are clearly eliminated in all other RNase-treated lanes. Moreover, there is clear correlation between the decreasing quantity of RNase (left to right) and increasing size of the RNA products. Visual inspection of Fig. 4 and intensity profile analysis (see ESI, Fig. S9†) suggests similar RNA degradation between 0.05 units of native RNase (lane 4) and 1000 ng of microspheres (lane 7); 0.025 units of RNase (lane 5) and 100 ng of microspheres (lane 8) and 0.001 units of RNase (lane 6) and 10 ng of microspheres (lane 9).
 | ||
| Fig. 4 Gel electrophoresis to compare the activity of native RNase with RNase-functionalised microspheres 6b. Each reaction was carried out with 1.5 μg of RNA for 3 minutes. Lane (1) control, no treatment, (2) 0.100 units of RNase, (3) 0.075 units of RNase, (4) 0.050 units of RNase, (5) 0.025 units of RNase, (6) 0.001 units of RNase, (7) 1000 ng of RNase-functionalised microspheres 6b (ca. 0.050 units of RNase), (8) 100 ng of RNase-functionalised microspheres 6b (ca. 0.025 units of RNase), (9) 10 ng of RNase-functionalised microspheres 6b (ca. 0.001 units of RNase), (10) 1 ng of RNase-functionalised microspheres 6b. | ||
Cellular delivery
In order to verify the internalisation of microspheres, adherent HeLa cells were incubated with RNase-functionalised microspheres without TR (red)-labelled cores 6c. After 36 hours, the cells were stained with PKH26 red membrane label according to the manufacturer's instructions, and detached by trypsinisation. Suspended cells were inspected by confocal fluorescence microscopy, and, as expected, RNase-functionalised microspheres were fully internalised by the HeLa cells (for micrographs see ESI, Fig. S10†). Previous work by the Bradley group has shown that particles of this size are taken up by the cells using a mechanism that is not endocytosis-based.6 Avoidance of endocytosis is desirable for the delivery of functional proteins, since this process typically results in the proteins being targeted to the lysosomes where they are broken down by the harsh degradative environment therein.Cellular delivery was investigated by incubating HeLa cells with increasing amounts of RNase-functionalised microspheres 6b (without TR or FITC), specifically 50 μg, 100 μg and 200 μg doses per well of 3 ml of media. Control cells were not incubated with microspheres. After staining with acridine orange, images were acquired by confocal fluorescence microscopy. Acridine orange is a molecular probe that emits green fluorescence when bound to DNA and emits red fluorescence when bound to RNA.36 Control cells appear healthy (maintaining their characteristic elongated diamond-like shape, with a smooth, defined outline37) in Fig. 5(i)–(iii), with both red and green fluorescence distributed throughout the entirety of each cell.
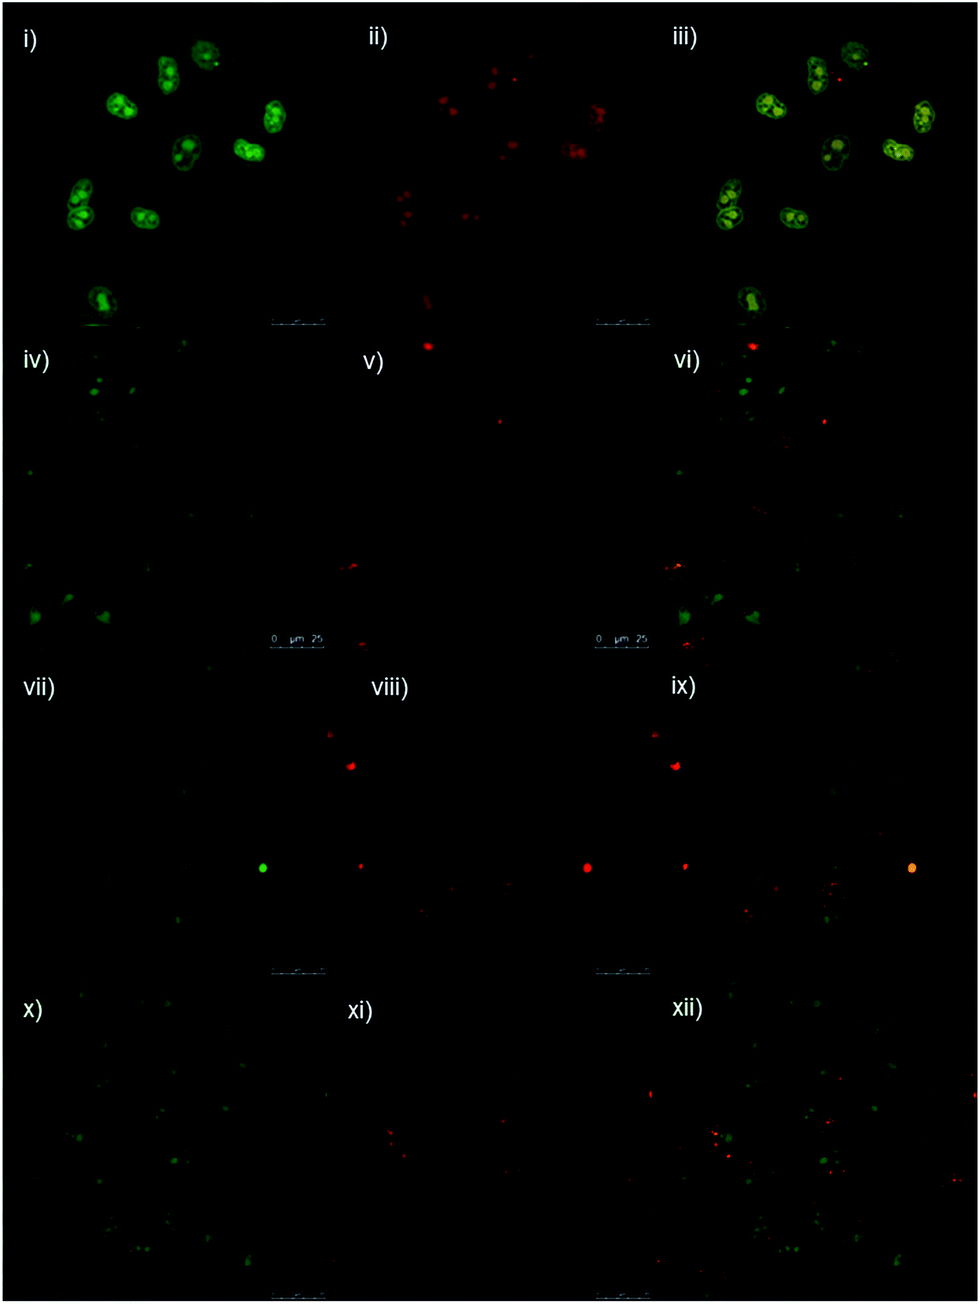 | ||
| Fig. 5 Confocal microscopy images to show the fluorescence emissions of cells stained with acridine orange. The 488 nm excitation laser was used at 15% power, with 10× objective. Cells incubated for 36 hours with (i), (ii) and (iii) no microspheres; (iv), (v) and (vi) 50 μg of RNase-functionalised microspheres 6c; (vii), (viii) and (ix) 100 μg of RNase-functionalised microspheres 6c; and (x), (xi) and (xii) 200 μg of RNase-functionalised microspheres 6c. Left-hand images shows fluorescence emission collected in Channel 1 between 500 nm and 560 nm (DNA); central images show fluorescence emission collected in Channel 2 between 590 nm and 630 nm (RNA); right hand images shows an overlay of the two Channels. | ||
This suggests that the control cells at the time of imaging were proceeding healthily through stages of mitosis, accounted for by the dividing cells that can be seen with two distinct nuclei. Treated cells appear unhealthy (having an uneven/textured outline as the cell membrane begins to become unstable, they become rounded in shape with a reduced cellular volume37) with a distinct decrease in both green (DNA, nuclear) and red (RNA, cytosolic) fluorescence after treatment with RNase-functionalised microspheres 6b. The decrease in red fluorescence corresponds to a decrease in cellular RNA, which suggests that the delivered RNase is indeed active. Furthermore, the ratio of green (DNA) to red (RNA) fluorescence increases. To quantify this, the relative amounts of fluorescence for each channel were calculated with LAS-AF software (Table 2). It should be noted that lower fluorescence values collected in Channels 1 and 2 for 100 μg of RNase-functionalised microspheres are likely due to the inevitable variability of microscopy sample preparation. However, as the conditions are identical for both channels the ratio remains valid. It is also important to note that the ratios are derived from a qualitative method and are therefore semi-quantitative in nature. Treated cells are rounded and deformed and nuclear changes are apparent, consistent with the onset of apoptosis. Green fluorescence appears to be more evenly distributed throughout the treated cells, with the nucleoli identifiable in each cell.
Whilst by no means optimised, it was intriguing to assess whether delivered RNase had any effect on the viability of the cells to which it had been delivered. Accordingly, a CellTiter-Blue® Cell Viability Assay was performed (see Experimental section). The results of this ‘proof of concept’ study are shown in Fig. 6 and indicate that beadfection of HeLa cells with RNase-functionalised microspheres 6b caused a decrease in cell viability, and significantly so, at the highest concentration of microspheres tested. This is a notable finding since a control experiment with the same concentration of microspheres, but critically, with no RNase attached did not appear to have any detrimental effect on cell viability.
 | ||
| Fig. 6 Graph showing CellTiter-Blue® Cell Viability Assay to compare the effect of native RNase, carboxylic acid-functionalised microspheres 5b and RNase-functionalised microspheres 6b upon cell viability. Lane (1) control, no treatment, (2) 84 ng of RNase, (3) 168 ng of RNase, (4) 335 ng of RNase, (5) 1.56 μg of carboxylic acid-functionalised microspheres 5b, (6) 3.13 μg of carboxylic acid-functionalised microspheres 5b, (7) 6.25 μg of carboxylic acid-functionalised microspheres 5b, (8) 1.56 μg of RNase-functionalised microspheres 6b, (9) 3.13 μg of RNase-functionalised microspheres 6b, (10) 6.25 μg of RNase-functionalised microspheres 6b. Data in each case represents the mean percentage results ± S. E. M. of cell fluorescence, calculated using cells from five different passage numbers, performed independently in quadruplet. P values, arising from Tukey's multiple comparisons test, of less than 0.0001 are indicated with four (****) asterisks. | ||
Conclusions
Polymer core–silica shell microspheres were prepared via seeded-emulsion and sol–gel polymerisation techniques. The particles were successfully labelled with two concomitant fluorescent markers and a functional RNase enzyme to exemplify the multifunctionality of the system. RNase immobilised on microspheres retained high levels of degradative activity. Delivery of the microspheres with the functional protein to HeLa cells decreased the levels of intracellular RNA and moreover caused a significant decrease in cell viability at the highest concentration tested. Thus the core–shell microspheres that we have developed have been shown to be ideal for in vitro functional protein transduction.Experimental section
Materials and instruments
3-Aminopropyl trimethoxysilane (APTMS); ammonium hydroxide in water 28% w/w; azobisisobutyronitrile (AIBN); 1,8-diazabicyclo[5.4.0]undec-7-ene (DBU); N,N-dimethylformamide (DMF); divinylbenzene (DVB); Dulbecco's modified Eagle's medium; N-ethyl-N′-(3-dimethylaminopropyl)carbodiimide hydrochloride (EDAC); fluorescein isothiocyanate (FITC); Fmoc protected Lysine (Fmoc–Lys(Fmoc)–OH); hexadecane; hydrochloric acid (HCl); 3-mercaptopropionic acid; 2-(N-morpholino)ethanesulphonic acid (MES); phosphate buffered saline (PBS); poly(N-vinyl pyrrolidone) (∼58000 g mol−1) (PVP); sodium dodecyl sulphate (SDS); styrene; succinimidyl 3-(2-pyridyldithio)propionate (SPDP); tetraethylorthosilicate (TEOS); tetrahydrofuran (THF); thiourea; 3-(trimethoxysilyl)propyl methacrylate (TMSPM); and 4-vinylbenzyl chloride (4-VBC) were purchased from Sigma-Aldrich and used as received except for styrene, which was washed with sodium hydroxide solution (1 M) and water and dried over magnesium sulfate prior to use. Acridine orange, BODIPY® TR cadaverine (BODIPY), Texas Red® maleimide (TR) and TRIzol® were purchased from Invitrogen. Foetal calf serum and non-essential amino acids were purchased from PAA, Yeovil, UK. 4-Vinylbenzylisothiouronium chloride (4-VBTU) was synthesised in-house according to our previous protocol.33
Microspheres and HeLa cells were characterised by confocal fluorescence microscopy on a Leica TCS SPS II Broadband confocal microscope with Leica Application Suite-Advanced Fluorescence (LAS-AF) software. The 488 nm excitation laser was used at 15% power, and fluorescence emission collected in two channels. One collected fluorescence in the red region between 590 nm and 630 nm, and the other collected fluorescence in the green region between 500 nm and 560 nm. SEM with Energy Dispersive X-ray Analysis (EDXA) was carried out with a Link System AN10000 and Cambridge Scanning Electron Microscope Stereoscan S90. The quantity of accessible amine groups present on amine-functionalised microspheres 3b was characterised by UV-vis absorbance spectroscopy on a Perkin Elmer UV-vis Spectrometer Lambda 12. RNase activity was characterised by gel electrophoresis, and images obtained on a Syngene G:BOX HR1.4 with GeneSys software. Zeta potential measurements were recorded on a Brookhaven Zeta Plus.
Synthesis of core–shell microspheres
Modification of core–shell microspheres and conjugation of RNase
Gel electrophoresis
The enzymatic activity of RNase-functionalised microspheres 6b was assessed by reaction with purified RNA, and characterised by gel electrophoresis. Specifically, HeLa cells were seeded at 1 million cells per well, in 6-well plates in DMEM. After 24 hours, the RNA was harvested and purified with TRIzol® according to the manufacturer's instructions. For each reaction, a 1 ml centrifuge tube was charged with 1.5 μg of RNA in 15 μl of 200 mM sodium acetate, 10 mM Tris HCl buffer (pH 7.5). 5 μg of carboxylic acid-functionalised microspheres 5b, or 5, 1, 0.1, 0.01, or 0.001 μg of RNase-functionalised microspheres 6b, or 2.86, 2.15, 1.43, 0.72 or 0.03 ng of native RNase, in 15 μl of 200 mM sodium acetate, 10 mM Tris HCl buffer (pH 7.5) were added to the RNA, mixed well and incubated for 1, 3 or 5 minutes at room temperature. After this time, 1 μl of sodium hypochlorite solution (11–15% available chlorine) was added (with mixing) to each to terminate the degradation reaction. Subsequently, 4 μl of RNA loading buffer was added to each to give the final reaction mixture for gel electrophoresis. A gel electrophoresis system, suitable for RNA, was made based on a protocol described previously by Jorcyk and co-workers.34 Specifically, a stock solution of TAE buffer was made up with 120 g of Tris base dissolved in 300 ml of deionised water, and to this 28 ml of anhydrous acetic acid and 50 ml of EDTA (500 mM) solution. 20 ml of TAE buffer was added to 980 ml of deionised water and mixed thoroughly. 200 ml of this was transferred to a 500 ml Schott bottle with magnetic stirrer bar inside, and 2 g of agarose added. The mixture was stirred magnetically for 1 minute, and 2 ml of sodium hypochlorite solution (11–15% available chlorine) was added. After this, the Schott bottle was removed from the stirrer plate and placed in the microwave with the lid fitted loosely, for a total of 2 minutes at 600 W, with gentle stirring at 20 second intervals. Subsequently, the gel was allowed to cool down slowly on the bench top and stirred, until around 50 °C (comfortable to touch). After this time 5 μl of ethidium bromide (10 mg ml−1 in H2O) was added and stirred thoroughly before casting into the gel mould. The gel was covered, allowed to set by cooling to room temperature, then placed in the electrophoresis tray, and covered with the remaining 800 ml of TAE 1% buffer. Each degradation reaction mixture was loaded into a lane in the gel and electrophoresed at a constant voltage of 8 V cm−1. The addition of hypochlorite, or bleach, inactivates all RNases in the system, to prevent any further degradation of RNA during the electrophoresis process.34Acridine orange assay with HeLa cells
HeLa 229 (human epithelial cells) were cultured in Dulbecco's modified Eagle's medium/C high glucose (4.5 mg ml−1) supplemented with 10% v/v foetal calf serum and 100 IU ml−1 penicillin and 100 mg ml−1 streptomycin supplemented with non-essential amino acids (the complete mixture is referred to as DMEM). Glass coverslips (12 mm diameter) were sterilised and one placed in the bottom of each well in a 6-well plate. HeLa cells were seeded at 250000 cells per well, on top of the coverslips, in 3 ml of DMEM. After 12 hours incubation at 37 °C, 5% CO2, the cells had adhered to the coverslips. RNase-functionalised microspheres 6b were prepared without TR or FITC fluorophores and suspended in DMEM. 0 μg (control), 50 μg, 100 μg or 200 μg of RNase-functionalised microspheres 6b were then added to the wells and mixed evenly throughout the media. After 36 hours of incubation at 37 °C, 5% CO2, excess media was removed from the well, and the cells on the coverslips were washed gently three times with 3 ml of PBS, using a pipette. Excess PBS was removed, and 150 μl of acridine orange in PBS (10 mg ml−1) was pipetted onto the cells on the coverslip and left for 5 minutes. The cells were again washed gently with PBS three times. Subsequently, the coverslips were carefully removed from the well with tweezers and placed cell-side down on microscope slides. The live cells were imaged immediately by confocal fluorescence microscopy.
CellTiter-Blue® Cell Viability Assay
HeLa cells were seeded in quadruplet into 96-well plates at 5000 cells per well in 200 μl of DMEM, and incubated for 24 hours at 37 °C, 5% CO2. After this time, cells were treated with microspheres; 6.25, 3.13 or 1.56 μg of carboxylic acid-functionalised microspheres 5b or RNase-functionalised microspheres 6b, or 335, 168 or 84 ng of native RNase was added to the wells, and control cells were left untreated. After 48 hours of incubation at 37 °C, 5% CO2, cells were washed (3 × 100 μl) with phenol red-free DMEM, with an auto-pipette. CellTiter-Blue® reagent was diluted with phenol red-free DMEM in a 1:6 ratio, and 120 μl of the solution added to each well (20 μl CellTiter-Blue® reagent, 100 μl phenol red-free DMEM per well). Cells were incubated for a further 4 hours at 37 °C, 5% CO2 and absorbance measured at 570 nm. Results were averaged and used to represent percentage cell viability. Absorption of treated cells was expressed as a percentage of control cells, which were taken as 100% viable. This experiment was repeated for five different passage numbers of cells.
Acknowledgements
This research was supported by the Engineering and Physical Sciences Research Council (EPSRC) of the UK through the provision of Industrial CASE (GFC) to AJS and grant number EP/D038057/1 (JMB and DAN) to AJS and AVH.Notes and references
- R. Assenberg, P. T. Wan, S. Geisse and L. M. Mayr, Curr. Opin. Struct. Biol., 2013, 13, 393–402 CrossRef PubMed.
- D. M. Copolovici, K. Langel, E. Eriste and U. Langel, ACS Nano, 2014, 8, 1972–1994 CrossRef CAS PubMed.
- S. Biswas and V. P. Torchilin, Adv. Drug Delivery Rev., 2014, 66, 26–41 CrossRef CAS PubMed.
- J.-W. Hu, B. R. Liu, C.-Y. Wu, S.-W. Lu and H.-J. Lee, Peptides, 2009, 30, 1669–1678 CrossRef CAS PubMed.
- J. Mercer and A. Helenius, Nat. Cell Biol., 2009, 11, 510–520 CrossRef CAS PubMed.
- L. M. Alexander, S. Pernagallo, A. Livigni, R. M. Sanchez-Martin, J. M. Brickman and M. Bradley, Mol. BioSyst., 2010, 6, 399–409 RSC.
- R. M. Sanchez-Martin, M. Muzerelle, N. Chitkul, S. E. How, S. Mittoo and M. Bradley, ChemBioChem, 2005, 6, 1341–1345 CrossRef CAS PubMed.
- J. M. Cardenas-Maestre, S. Panadero-Fajardo, A. M. Perez-Lopez and R. M. Sanchez-Martin, J. Mater. Chem., 2011, 21, 12735–12743 RSC.
- J. M. Behrendt, D. Nagel, E. Chundoo, L. M. Alexander, D. Dupin, A. V. Hine, M. Bradley and A. J. Sutherland, PLoS One, 2013, 8, e50713 CAS.
- D. Nagel, J. M. Behrendt, G. F. Chimonides, E. E. Torr, A. Devitt, A. J. Sutherland and A. V. Hine, Mol. Cell. Proteomics, 2014, 13, 1543–1551 CAS.
- I. I. Slowing, J. L. Vivero-Escoto, C.-W. Wu and V. S. Y. Lin, Adv. Drug Delivery Rev., 2008, 60, 1278–1288 CrossRef CAS PubMed.
- A. Burns, P. Sengupta, T. Zedayko, B. Baird and U. Wiesner, Small, 2006, 2, 723–726 CrossRef CAS PubMed.
- F. Gao, F. Luo, X. Chen, W. Yao, J. Yin, Z. Yao and L. Wang, Talanta, 2009, 80, 202–206 CrossRef CAS PubMed.
- H. J. Kim, H. Lee, J. H. Lee, D. H. Choi, J. H. Jung and J. S. Kim, Chem. Commun., 2011, 47, 10918–10920 RSC.
- B. Liu, F. Zeng, G. Wu and S. Wu, Chem. Commun., 2011, 47, 8913–8915 RSC.
- P. Teolato, E. Rampazzo, M. Arduini, F. Mancin, P. Tecilla and U. Tonellato, Chem.–Eur. J., 2007, 13, 2238–2245 CrossRef CAS PubMed.
- A. Azioune, A. Ben Slimane, L. Ait Hamou, A. Pleuvy, M. M. Chehimi, C. Perruchot and S. P. Armes, Langmuir, 2004, 20, 3350–3356 CrossRef CAS.
- J. E. Fuller, G. T. Zugates, L. S. Ferreira, H. S. Ow, N. N. Nguyen, U. B. Wiesner and R. S. Langer, Biomaterials, 2008, 29, 1526–1532 CrossRef CAS PubMed.
- X. He, J. Chen, K. Wang, D. Qin and W. Tan, Talanta, 2007, 72, 1519–1526 CrossRef CAS PubMed.
- X.-X. He, K. Wang, W. Tan, B. Liu, X. Lin, C. He, D. Li, S. Huang and J. Li, J. Am. Chem. Soc., 2003, 125, 7168–7169 CrossRef CAS PubMed.
- L. R. Hilliard, X. Zhao and W. Tan, Anal. Chim. Acta, 2002, 470, 51–56 CrossRef CAS.
- A. P. R. Johnston, B. J. Battersby, G. A. Lawrie, L. K. Lambert and M. Trau, Chem. Mater., 2006, 18, 6163–6169 CrossRef CAS.
- A. P. R. Johnston, B. J. Battersby, G. A. Lawrie and M. Trau, Chem. Commun., 2005, 848–850 RSC.
- C. R. Miller, R. Vogel, P. P. T. Surawski, K. S. Jack, S. R. Corrie and M. Trau, Langmuir, 2005, 21, 9733–9740 CrossRef CAS PubMed.
- M. Nakamura and K. Ishimura, J. Phys. Chem. C, 2007, 111, 18892–18898 CAS.
- L. M. Rossi, L. Shi, N. Rosenzweig and Z. Rosenzweig, Biosens. Bioelectron., 2006, 21, 1900–1906 CrossRef CAS PubMed.
- S. Santra, K. Wang, R. Tapec and W. Tan, J. Biomed. Opt., 2001, 6, 160–166 CrossRef CAS PubMed.
- R. Tapec, X. J. Zhao and W. Tan, J. Nanosci. Nanotechnol., 2002, 2, 405–409 CrossRef CAS PubMed.
- X. Zhao, R. Tapec-Dytioco and W. Tan, J. Am. Chem. Soc., 2003, 125, 11474–11475 CrossRef CAS PubMed.
- K. Nienhaus and G. U. Nienhaus, Chem. Soc. Rev., 2014, 43, 1088–1106 RSC.
- M. Michaelis, J. Matousek, J. U. Vogel, T. Slavik, K. Langer, J. Cinatl, J. Kreuter, D. Schwabe and J. Cinatl, Anti-Cancer Drugs, 2000, 11, 369–376 CrossRef CAS PubMed.
- D. Horák, B. Rittich, J. Šafář, A. Španová, J. Lenfeld and M. J. Beneš, Biotechnol. Prog., 2001, 17, 447–452 CrossRef PubMed.
- J. M. Behrendt, M. Afzaal, L. M. Alexander, M. Bradley, A. V. Hine, D. Nagel and A. J. Sutherland, J. Mater. Chem., 2009, 19, 215–221 RSC.
- P. S. Aranda, D. M. LaJoie and C. L. Jorcyk, Electrophoresis, 2012, 33, 366–369 CrossRef CAS PubMed.
- M. Gude, J. Ryf and P. White, Lett. Pept. Sci., 2002, 9, 203–206 CAS.
- Z. Darzynkiewicz, G. Juan and E. F. Srour, Differential Staining of DNA and RNA, in Current Protocols in Cytometry, John Wiley & Sons, Inc., 2001, vol. 30, pp. 7.3.1–7.3.16 Search PubMed.
- G. Kroemer, L. Galluzzi, P. Vandenabeele, J. Abrams, E. S. Alnemri, E. H. Baehrecke, M. V. Blagosklonny, W. S. El-Deiry, P. Golstein, D. R. Green, M. Hengartner, R. A. Knight, S. Kumar, S. A. Lipton, W. Malorni, G. Nuñez, M. E. Peter, J. Tschopp, J. Yuan, M. Piacentini, B. Zhivotovsky and G. Melino, Cell Death Differ., 2009, 16, 3–11 CrossRef CAS PubMed.
Footnote |
| † Electronic supplementary information (ESI) available: A visual guide to the fluorescently-labelled microspheres used in this study, a scheme of the full synthesis of RNase-functionalised microspheres 6, characterisation of surface functionality, FTIR spectroscopy data, laser diffractometry data, TEM and energy dispersive X-ray analysis data, fluorescent labelling of RNase and micrographs that confirm internalisation of microspheres into cells. See DOI: 10.1039/c4tb01130a |
| This journal is © The Royal Society of Chemistry 2014 |