 Open Access Article
Addressing the optimal silver content in bioactive glass systems in terms of BSA adsorption
Klára
Magyari
*a,
Cristina
Gruian
ab,
Béla
Varga
c,
Raluca
Ciceo-Lucacel
a,
Teodora
Radu
a,
Heinz-Jürgen
Steinhoff
b,
György
Váró
c,
Viorica
Simon
a and
Lucian
Baia
*a
aBabes-Bolyai University, Faculty of Physics & Institute of Interdisciplinary Research in Bio-Nano-Sciences, 400084 Cluj-Napoca, Romania. E-mail: lucian.baia@phys.ubbcluj.ro; klara.magyari@ubbcluj.ro; Fax: +40-264-591906; Tel: +40-264-405300
bDepartment of Physics, University of Osnabrück, 49069 Osnabrück, Germany
cInstitute of Biophysics, Biological Research Centre of the Hungarian, Academy of Sciences, 6726 Szeged, Hungary
First published on 24th June 2014
Abstract
Bioactive glasses doped with silver are aimed to minimize the risk of microbial contamination; therefore, the influence of silver on the bioactive properties is intensely investigated. However, information related to the role played by silver, when added to the bioactive glass composition, on biocompatibility properties is scarce. This aspect is essential as long as the silver content can influence blood protein adsorption onto the surface of the glass, thus affecting the material's biocompatibility. Therefore, from the perspective of the biocompatibility standpoint, the finding of an optimal silver content in a bioactive glass is an extremely important issue. In this study, silver-doped bioactive glasses were prepared by a melt-derived technique, which eliminates the pores' influence in the protein adsorption process. The obtained glasses were characterized by X-ray diffraction, UV-vis, X-ray photoelectron (XPS) and Fourier transform infrared (FT-IR) spectroscopy; afterwards, they were investigated in terms of protein adsorption. Both UV-vis and XPS spectroscopy revealed the presence of Ag+ ions in all silver containing samples. By increasing the silver content, metallic Ag0 appears, the highest amount being observed for the sample with 1 mol% AgO2. Electron paramagnetic resonance measurements evidenced that the amount of spin-labeled serum albumin attached to the surface increases with the silver content. The results obtained by analyzing the information derived from atomic force microscopy and FT-IR measurements indicate that the occurrence of metallic Ag0 in the samples' structure influences the secondary structure of the adsorbed protein. Based on the results derived from the protein response upon interaction with the investigated glass calcium-phosphate based system, the optimal silver oxide concentration was determined for which the secondary structure of the adsorbed protein is similar with that of the free one. This concentration was found to be 0.5 mol%.
1. Introduction
It is well known that the presence of silver oxide in bioactive glass composition reduces the risk of microbial contamination through leakage of silver ions,1,2 due to their oligodynamic activity.3,4 Phosphate-based glasses in the P2O5–CaO–Na2O system have a high level of interest as bone filling material and for scaffold fabrication in bone tissue engineering due to their high solubility and chemical similarity with the inorganic phase of human bone.5 Ahmed et al.6 demonstrated that an incorporation of up to 2 mol% Ag2O into ternary system P2O5–CaO–Na2O confirms the antibacterial activity. Nevertheless, in the body fluid, the release of silver ions is obstructed by the self-assembling of an apatite layer on the bioactive glass surface.7 Another important aspect that has to be considered for bone tissue engineering type materials is their bioactivity. It was recently shown that phosphate glasses doped with 1 mol% Ag2O preserve their in vitro bioactivity.8When biomaterials are introduced into the body, they first come into contact with blood proteins, which are spontaneously adsorbed on their surface, and then cellular attachment, proliferation and migration occurs.9,10 Although surface–protein interactions are not completely elucidated, surface chemistry has been shown to play a fundamental role in protein adsorption.11,12 Several studies have shown that the conformation of proteins changes upon adsorption onto the surface of the materials, thus affecting the material biocompatibility and further cellular interactions.9–11,13–15 It is already known that bovine serum albumin (BSA) displays high binding affinity towards silver nanoparticles, which in turn trigger changes in its spatial structure.16–18 The changes in the secondary structure of BSA may thus be affected by the silver content in glass.
The role played by silver in the antibacterial6,19–22 and bioactive8,23,24 behaviour of glass was intensely studied lately, but little work has been focused on evaluating the biocompatibility of these glasses. Consequently, this study aims to investigate the way silver content in bioactive glass influences protein adsorption, as the first event occurring upon interaction with body fluids. Furthermore, it is proposed to determine the optimal Ag2O concentration in the bioactive glass, in terms of interaction with proteins. To this end, bovine serum albumin (BSA) was considered as a model protein, since it displays high structural homology with human serum albumin.12 Serum albumin is the most abundant protein, accounting for 60–70% of the measured plasma proteins and is the first protein surrounding foreign bodies when they come in contact with blood.25 The albumin structure is predominantly helical (Fig. 1) with the remaining polypeptides occurring in turns or flexible regions between the subdomains.26 Albumin is considered to greatly reduce the acute inflammatory response to biomaterials.27
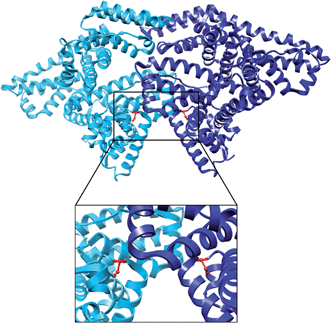 | ||
| Fig. 1 The crystal structure of bovine serum albumin dimer obtained by X-ray crystallography (pdb 4F5S). The two monomers are coloured in cyan and blue, respectively. Each native cysteine at position 34 is coloured in red, and the atoms are shown as balls and sticks. The region surrounding the two Cys34 positions is enlarged in the lower part. | ||
It has already been demonstrated that the sol–gel derived bioactive glass 45S5 eluted more protein per unit mass than the melt-derived 45S5 glass.28 To eliminate the influence of porosity on the adsorption process, in the present study, bioactive glasses were prepared by the conventional melt quenching method. Prior to protein attachment, samples of P2O5·CaO·Na2O system doped with Ag2O were subjected to structural analysis by X-ray diffraction (XRD), UV-Vis, X-ray photoelectron spectroscopy (XPS) and Fourier transform infrared (FT-IR) spectroscopy. Conformational changes induced in the BSA structure as a consequence of interaction with the investigated samples were followed by FT-IR spectroscopy and atomic force microscopy (AFM). Spin labeling in combination with electron paramagnetic resonance (EPR) spectroscopy was employed to quantify the amount of protein attached on each glass sample. EPR spectroscopy provides a detailed structural, dynamic and quantitative information for biomolecules not only in solution but can also be applied to adsorbed or encapsulated spin-labeled proteins as reported recently.29–31 This method enables determining the protein amount in the overall mass of the sample, by counting the number of spins contributing to the paramagnetic signal. The EPR spectra were further used to monitor local structural changes in BSA following the adsorption process. In the present study (4-(2-iodoacetamido)-2,2,6,6-tetramethyl-1-piperidinyloxy) iodoacetamide (IA) spin label was used to label the cysteine residue located at position 34 of bovine serum albumin, which contains the unique free thiol group that is not involved in a disulfide bridge (Fig. 1). BSA adsorption onto the investigated systems was explored in conditions close to its physiological environment (phosphate buffer solution at pH 7.4), by following the EPR signal of the paramagnetic centre attached.
2. Materials and methods
2.1. Formation of glass
The 60P2O5·20CaO·(20 − x)Na2O·xAg2O with x = 0, 0.3, 0.5, 0.8 and 1 mol% bioactive glasses were prepared by the conventional melt quenching method using NH4·H2PO4, CaCO3, Na2CO3·10H2O and AgNO3 as starting materials. The mixtures corresponding to the desired compositions were melted in air, in sintered corundum crucibles, in an electric furnace at 1200 °C for 30 min. The melted mixtures were then quickly cooled at room temperature by pouring and pressing between two copper plates.Contact angle was measured using drop shape analysis in the sessile drop method with 2 μl water for the characterization of the surfaces.
2.2. Protein adsorption
Bovine serum albumin (BSA) (Sigma-Aldrich, molar mass 69 kDa) solutions of different concentrations were prepared in phosphate buffer solution (PBS) pH 7.4 to test protein adsorption by means of different investigation methods. Before protein adsorption, the samples were cleaned with plasma cleaner.Glass powders for FT-IR and glass pieces for AFM measurements were immersed in BSA solutions of 100 μM (∼6.9 mg ml−1) and 7 μM (∼0.5 mg ml−1), respectively, and afterwards placed in an incubator at a constant temperature of 37 °C for 30 min. The solution was then removed from the samples, rinsed three times with PBS, and air dried.
For the spin labeling procedure, a solution of 100 μM bovine serum albumin in phosphate buffer (pH 7.4) was incubated for 48 hours at 37 °C with 6-fold molar excess of (4-(2-iodoacetamido)-2,2,6,6-tetramethyl-1-piperidinyloxy) spin label. Unbound IA was removed by repeated dilution steps with sodium phosphate buffer, pH 7.4, using centrifugal filter units with 30 kDa molecular weight cut-off (Amicon/Millipore, Carrigtwohill, Co. Cork, Ireland). Labeling efficiency (spin label per protein molecule) was determined to be 100% (±5%). Considering the location of the Cys34 residue, which is hidden in a hydrophobic crevice and, therefore, not so easily accessible, we assume that this high value of spin label efficiency is given by the additional labeling of other thiol groups. BSA has 35 cysteines in total, 34 of them being involved in disulphide bridges. It was previously shown that between pH 7 and pH 10, a gradual reduction of S–S bonds occurs in bovine serum albumin, so that up to three disulfide bonds are reducible in the protein, thus becoming available for spin labeling.32,33
For protein adsorption experiments, the glass pieces were milled to micrometric-sized particles. The powder samples (150 mg) were afterwards incubated for 30 min at 37 °C in spin-labeled BSA solution (100 μM). Afterwards, the samples were washed three times with buffer solution to remove the unattached protein molecules.
2.3. Methods
3. Results and discussion
3.1. Structural characterization
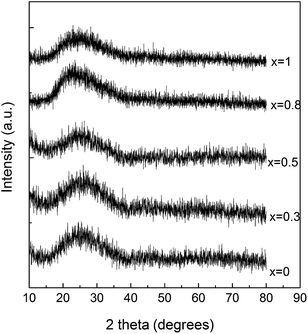
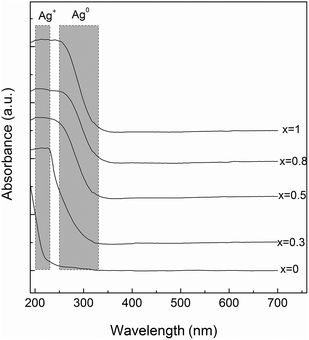
The obtained samples with 60P2O5·20CaO·(20 − x)Na2O·xAg2O (x = 0, 0.3, 0.5, 0.8 and 1 mol%) composition prepared by a conventional melt quenching method were transparent and colourless. The X-ray diffraction patterns consist of a very broad peak (Fig. 2) and confirm the vitreous character of all samples.In order to obtain further insight into the structure of the investigated glass samples, UV-vis absorption spectra were recorded. The silver atoms, ions, and clusters exhibit different optical properties that can be evidenced by means of UV-vis spectroscopy. Thus, the electronic transitions involving the Ag+ ion are visible in the 190–230 nm spectral range, and the electronic transitions of metallic Ag0 appear in the 250–330 nm spectral range, while isolated and aggregated Ag nanoparticles absorb at wavelengths higher than 400 nm.23,35,36 The UV-vis absorption spectra recorded for the investigated samples evidenced absorption bands only for the silver containing glasses (Fig. 3). The glasses with lower concentration of silver (x = 0.3 and 0.5) exhibit only absorption bands in the 190–230 nm spectral range, associated with the presence of Ag+ ion, although the sample containing 0.5 mol% AgO2 slightly exhibits the presence of metallic Ag0. However, as the silver amount increases (x = 0.8 and 1) close to the absorption band recorded for the Ag+ ion, the UV-vis spectra reveal the presence of the metallic Ag0, as shown by the presence of the electronic absorption signal that occurs in the 250–300 nm spectral range.
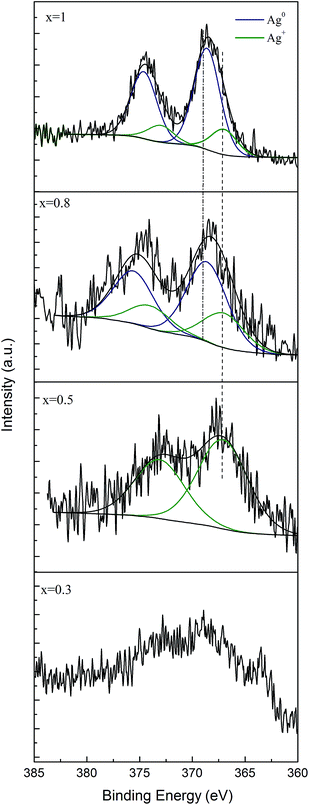
To investigate the chemical state of silver in these glasses, an XPS analysis was performed. The Ag 3d spectrum consists of a doublet for the Ag d5/2 and Ag d3/2 components due to spin–orbit splitting, at the binding energies of 368.6 and 374.6 eV, respectively (Fig. 4).23,37,38 To further examine the chemical state of silver in the investigated glass with 0.5, 0.8 and 1 mol% Ag2O, the Ag 3d photoelectron peaks were deconvoluted. Silver content of the glass with 0.3% Ag2O is very small; thus the deconvolution could not be performed. For the Ag d5/2 component, two contributions were considered centred at binding energies of 368.6 and 367.2 eV and are assigned to Ag0 and Ag+, respectively.37 By calculating the peak area ratios of the deconvoluted peaks in the sample with x = 0.8, it was determined that about 66.71% of the silver atoms are in the Ag0 chemical state, while 32.7% are in the Ag+ chemical state. Higher percentage of metallic Ag0 (87.1%) is in turn present in the sample with x = 1. The deconvolution of Ag 3d photoelectron peaks for the sample containing 0.5 mol% silver oxide provides only one component, attributed to the Ag+ chemical state. These findings confirm the results obtained by UV-vis spectroscopy, i.e. with increasing the silver content in the glass, the amount of metallic silver increases.
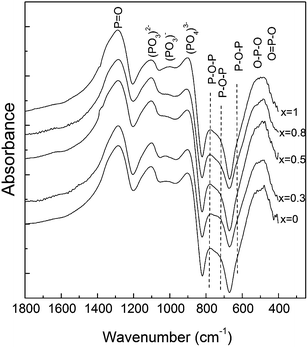
The FT-IR spectra of the obtained glass samples have characteristic absorption bands of phosphate based glasses (Fig. 5).6,8,36,39–41 The bands in the region 400–600 cm−1 can be attributed to bending vibrations of bridging phosphorus such as O–P–O and/or O![[double bond, length as m-dash]](https://www.rsc.org/images/entities/char_e001.gif) P–O.6,39,40 The IR bands and shoulders observed at around 772 and 715 cm−1 for x = 0 are attributed to the P–O–P bending and asymmetric vibrations, respectively.40,41
P–O.6,39,40 The IR bands and shoulders observed at around 772 and 715 cm−1 for x = 0 are attributed to the P–O–P bending and asymmetric vibrations, respectively.40,41
The absorption band at around 905 cm−1 is attributed to the (PO4)3− symmetric stretching vibrations, indicating that a considerable part of the phosphate network still remains linked even after an addition of a relatively high amount of silver.36 The band observed at around 1280 cm−1 can be assigned to the P![[double bond, length as m-dash]](https://www.rsc.org/images/entities/char_e001.gif) O stretching vibrations,40 while the bands at approximately 1100 cm−1 and at 1020 cm−1 are due to the (PO3)2− stretching vibrations.36,40
O stretching vibrations,40 while the bands at approximately 1100 cm−1 and at 1020 cm−1 are due to the (PO3)2− stretching vibrations.36,40
3.2. Protein adsorption
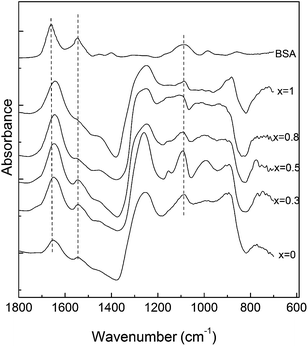
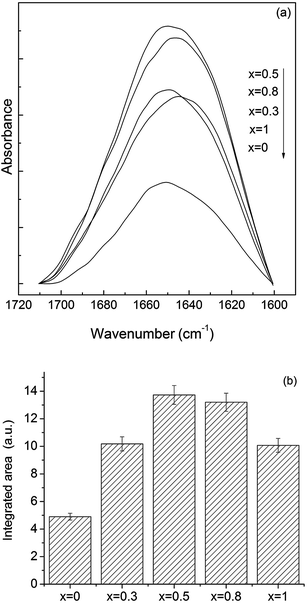
Wettability of the surface plays an important role in the conformational changes that a protein undergoes during adsorption on a surface. In order to clarify this aspect, the contact angle of the studied surfaces was measured. Since in all the cases the value determined for the contact angle was 37° ± 3°, one can infer that the used Ag2O content does not affect the hydrophobic character of the surface.After BSA adsorption, the FT-IR spectra of the samples containing Ag2O show the presence of the two characteristic bands of proteins: amide I band at 1650 cm−1 and amide II band at 1550 cm−1 (Fig. 6). The integrated area of amide I of BSA adsorbed onto the glass surfaces was normalized to the absorption band at 1280 cm−1 and subjected to quantitative comparison (Fig. 7) by assuming that there is a small probability that this type of vibration will be affected by the silver addition. The maximum value of the integrated area has been obtained for the sample with 0.5 mol% silver oxide content.
It was reported that the change of the intensities ratio of amide I/II bands indicates that the secondary structure of the protein may be affected.11,42 In the case of the investigated samples, the amide I/II intensity ratio increases progressively (from 2.1 for 0.5 mol% Ag2O to 2.7 for 1 mol% Ag2O), suggesting that the secondary structure of the protein is gradually, more intensely affected, as the silver content increases. The most important question that arises now is related to the role played by the silver content on the induced conformational changes. In order to get more insights into the mentioned aspect, EPR measurements were further performed.
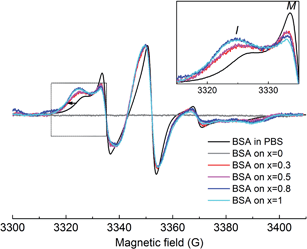
The EPR spectrum of spin-labeled BSA reveals the presence of two spectral components clearly visible in the lower field spectral line (Fig. 8). As discussed in the Materials and Methods section, besides the free thiol at position 34, additional cysteines were labeled, as one to three disulphide bonds were broken in each protein, as a consequence of the pH value used. Component I (immobile) represents a fraction of the nitroxide population having the spin label reorientational freedom restricted due to secondary and tertiary interactions, as result of Cys34 location in a hydrophobic crevice of 9.5–10 Å in depth43 and/or the local restrictions of the other labelled disulphide bridges (it was previously shown that all 17 disulphide bonds in BSA have buried locations within the protein molecule26). The resulting EPR spectrum is characterized by broad lines and large apparent hyperfine splittings. In contrast, component M (mobile) is characterized by narrow linewidth of the central line and small apparent hyperfine splitting, representing a nitroxide subpopulation with higher spin label mobilities, indicating that the nitroxide moiety is more free in the solvent.
Upon adsorption on the sample's surface, the immobile component increases at the expense of the mobile component (see inset of Fig. 8), evidencing local conformational changes in the vicinity of the labeled cysteines, as consequence of the adsorption process. The linewidth increase observed in the lower field spectral line for all the EPR spectra recorded in the adsorbed state (shown by the arrow in Fig. 8) suggests that the movement of the entire BSA molecule is hampered by interactions with the substrate samples. As silver concentration increases, the EPR spectra show stronger immobilization of spin labels on the substrate, indicating an enhanced interaction of the BSA molecule on the samples with higher silver content. This behaviour was previously reported on methemoglobin attached on silver-containing bioactive glass, and it was attributed to the interaction between silver ions and thiol groups in proteins.23,24 Another study also emphasized the strong interaction between silver nanoparticles and sulphur-containing peptides/amino acids.44 Since the free thiol groups in the BSA molecule were blocked by the spin label, we assume that additional thiol groups involved in disulfide bridges in the BSA molecule are broken during the adsorption process. The aggressiveness of this process is strongly dependent on the silver content in the sample: over 0.5 mol% Ag2O, the protein suffers more severe conformational changes. It may be possible that in samples with higher silver content (0.8 and 1 mol% Ag2O), the surroundings of the labelled cysteines are completely unfolded, and thus, these regions have direct contact with the bioactive glass surface. This would imply that at silver oxide contents higher than 0.5 mol%, the interaction between bioactive glass and BSA results in the unfolding of a large fraction of the protein structure. Furthermore, the amount of the protein attached to the sample can be also interpreted as a result of the strong interaction owed to the presence of silver in the sample. As silver content increases, more protein attaches on the sample's surface (see Fig. 9). Furthermore, no protein was found to be attached to the sample without silver content, most probably because the marker concentration from the adsorbed protein was under the detection limit. This is clear evidence that the main interaction between the BSA molecule and the sample's surface occurs especially through the medium of silver ions. On the other hand, the lack of a signal from the protein attached on the silver-free glass suggests that the best way of interpreting the achieved data is from a qualitative perspective.
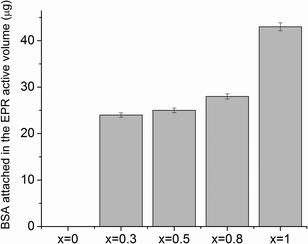 | ||
| Fig. 9 BSA attached in the EPR active volume (μg) after adsorption onto the investigated samples. Errors are estimated to ±2%, due to experimental settings and uncertainties in baseline subtraction. | ||
The secondary structure conformation of BSA after adsorption on the glass surfaces was analysed by deconvolution of the amide I absorption band from the FT-IR spectrum.42 The secondary structure of lyophilized BSA is typical, dominated by α helices (1649–1657 cm−1), but it also contains a small amount of β-sheet (1618–1641 and 1674–1695 cm−1) and β-turn (1662–1686 cm−1) structure.45 After adsorption, in all cases, a new band appears around 1608 cm−1 that can be associated with the existence of β-sheet aggregation/amino acid side chain residues.46 The secondary structure of BSA, after its adsorption on the glass with 0.5 mol% Ag2O, evidenced only minor changes that are within the error limit. In contrast, in the case of samples with 0.8 and 1 mol% Ag2O, one can observe that BSA loses a large fraction of its helical structure, and a concurrent increase in β-sheet and β-turn structural components occurs (Fig. 10 and 11). These results support the hypothesis highlighted by EPR spectroscopy that a large fraction of the protein structure is unfolded on the bioactive glasses with silver contents higher than 0.5 mol%. Interestingly, the UV-vis spectra showed that metallic Ag0 appears in these samples (Fig. 3). Regarding the sample without silver oxide content, one observes that the secondary structure of BSA is affected as a consequence of a small amount of protein adsorption.
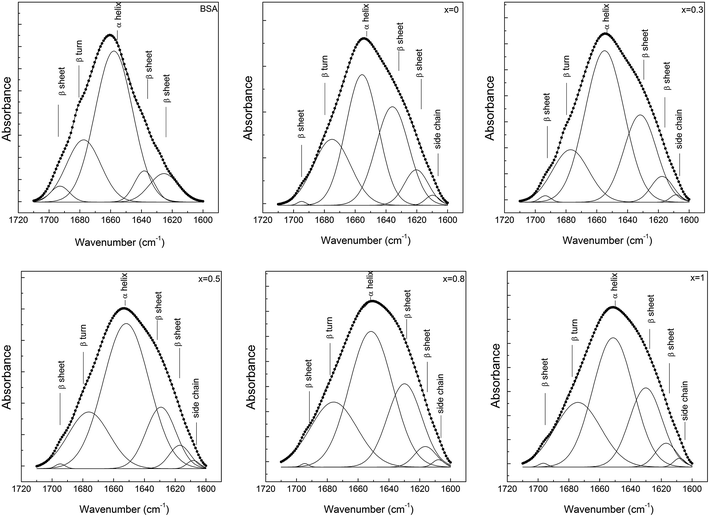 | ||
| Fig. 10 Deconvolution of the amide I (1700–1600 cm−1) absorption band of the lyophilized BSA, before and after its adsorption on the bioactive 60P2O5·20CaO·(20 − x)Na2O·xAg2O glass samples' surfaces. | ||
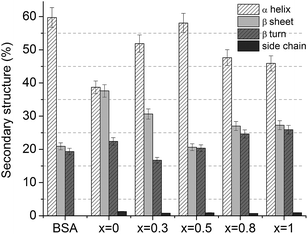 | ||
| Fig. 11 Distribution of secondary structures in lyophilized and adsorbed BSA onto 60P2O5·20CaO·(20 − x)Na2O·xAg2O glass samples' surfaces. | ||
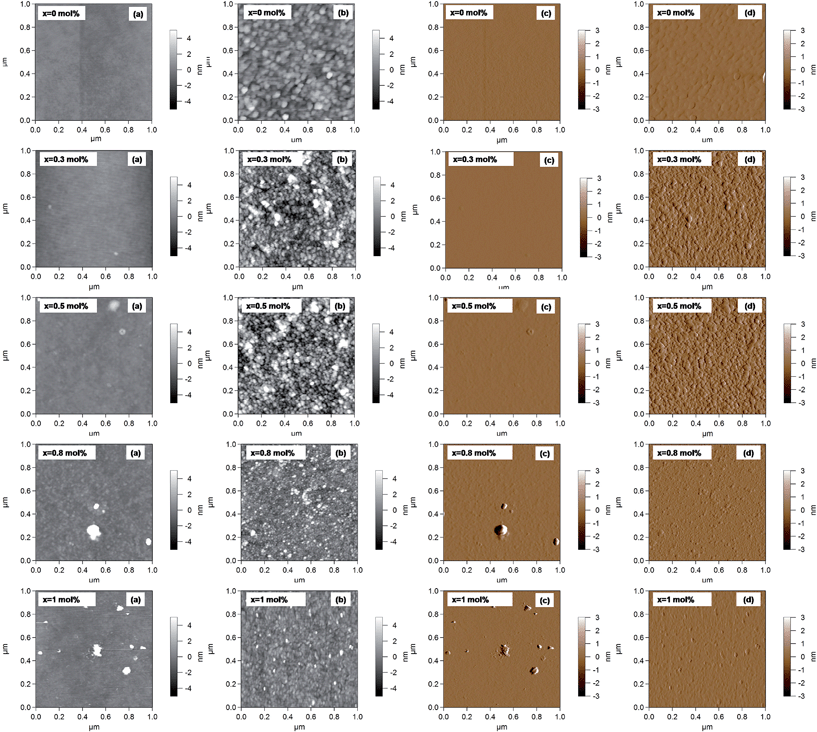
To visualize the BSA adsorption on the glass surfaces, the AFM technique was used (Fig. 12). In order to compare the surface changes induced by BSA adsorption, the surface roughness was determined from 1 × 1 μm2 images (Fig. 13).47,48 The AFM images revealed that the surface roughness begins to increase with the addition of silver oxide in the glasses, peaking at 0.5 mol%, after which it begins to decrease (Fig. 13). These results support the hypothesis highlighted by FT-IR and EPR spectroscopy, namely that the BSA structure unfolds on the high (x = 0.8 and x = 1) silver content samples. The attached protein layer is, therefore, more uniform on these two samples, resulting in an increase of surface smoothness.
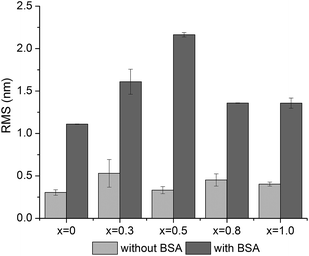 | ||
| Fig. 13 Root-mean-square (RMS) roughness before and after BSA adsorption determined by AFM from 1 × 1 μm2 images. | ||
All results presented in this study suggest that increasing the silver content in glass samples increases albumin adsorption on the surface, but metallic Ag0 appearance in the glass samples affects the protein secondary structure. This is in agreement with results obtained by other research groups that silver ions are active species in the biological system, since BSA can bind free silver ions, thus reducing its cellular toxicity.17 Negatively charged surfaces such as OH, SH and COOH, which activate the coagulation cascade via adsorption on various sites like those represented by the silver species, could also represent a possible reason for the important conformational change of the protein that appears for high silver content. Nevertheless, for the deep understanding of the role played by the silver amount present in the composition of a bioactive glass on protein conformational changes, other detailed investigations are needed.
4. Conclusions
The 60P2O5·20CaO·(20 − x)Na2O·xAg2O (0≤ x ≤1 mol%) melt-derived bioactive glass system was studied with respect to the influence of silver content on serum albumin adsorption. The XPS and UV-vis spectra revealed that in the samples with the lowest Ag2O content (x = 0.3 and 0.5), only Ag+ ions are present, while metallic Ag0 starts to appear for Ag2O content exceeding 0.8 mol%. Room temperature EPR spectra of spin-labelled protein revealed that silver content in the sample increases the adsorption potential of albumin on the sample's surface. Nevertheless, the appearance of metallic Ag0 in samples with 0.8 and 1 mol% Ag2O results in severe alteration of the BSA secondary structure, as a consequence of protein unfolding, and this effect was revealed by EPR, FT-IR spectroscopy and AFM. All results presented here suggest that the optimal silver oxide concentration in the investigated bioactive glass system for which the secondary structure of the adsorbed protein is similar with that of free protein is 0.5 mol%. This silver content represents the best compromise for the two important issues related to the protein adsorption process on the involved bioactive glass surface: the amount of the attached protein and the lack of conformational changes induced in the protein structure.Acknowledgements
CG and HJS gratefully acknowledge the support by the DAAD programme “Ostpartnerschaften”.References
- J. J. Blaker, A. R. Boccaccini and S. N. Nazhat, J. Biomater. Appl., 2005, 20, 81–98 CrossRef CAS PubMed.
- M. Bellantone, H. D. Williams and L. L. Hench, Antimicrob. Agents Chemother., 2002, 46, 1940–1945 CrossRef CAS PubMed.
- S. S. Djokie and R. E. Burrell, J. Electrochem. Soc., 1998, 145, 1426–1431 CrossRef PubMed.
- S. Di Nunzio, C. Vitale Brovarone, S. Spriano, D. Milanese, E. Verné, V. Bergo, G. Maina and P. Spinelli, J. Eur. Ceram. Soc., 2004, 24, 2935–2942 CrossRef CAS PubMed.
- A. Hoppe, N. S. Guldal and A. R. Boccaccini, Biomaterials, 2011, 32, 2757–2774 CrossRef CAS PubMed.
- A. A. Ahmed, A. A. Ali, D. A. R. Mahmoud and A. M. El-Fiqi, Solid State Sci., 2011, 13, 981–992 CrossRef CAS PubMed.
- V. Simon, C. Albon and S. Simon, J. Non-Cryst. Solids, 2008, 354, 1751–1755 CrossRef CAS PubMed.
- R. Ciceo Lucacel, A. O. Hulpus, V. Simon and I. Ardelean, J. Non-Cryst. Solids, 2009, 355, 425–429 CrossRef CAS PubMed.
- R. A. Latour, in The Encyclopedia of Biomaterials and Bioengineering, ed. G. E. Wnek and G. L. Bowlin, Taylor & Francis, New York, 2005, pp. 1–15 Search PubMed.
- K. Wang, C. Zhou, Y. Hong and X. Zhang, Interface Focus, 2012, 2, 259–277 CrossRef PubMed.
- P. Roach, D. Farrar and C. C. Perry, J. Am. Chem. Soc., 2005, 127, 8168–8173 CrossRef CAS PubMed.
- X. M. He and D. C. Carter, Nature, 1992, 358, 209–2015 CrossRef CAS PubMed.
- E. Vanea, K. Magyari and V. Simon, J. Optoelectron. Adv. Mater., 2010, 12, 1206–1212 CAS.
- K. Magyari, O. Popescu and V. Simon, J. Mater. Sci.: Mater. Med., 2010, 21, 1913–1920 CrossRef CAS PubMed.
- K. Magyari, L. Baia, O. Popescu, S. Simon and V. Simon, Vib. Spectrosc., 2012, 62, 172–179 CrossRef CAS PubMed.
- N. Shahabadi, M. Maghsudi and Z. Ahmadipour, Spectrochim. Acta, Part A, 2012, 92, 184–188 CrossRef CAS PubMed.
- S. Kittler, C. Greulich, J. S. Gebauer, J. Diendorf, L. Treuel, L. Ruiz, J. M. Gonzalez-Calbet, M. Vallet-Regi, R. Zellner, M. Koller and M. Epple, J. Mater. Chem., 2010, 20, 512–518 RSC.
- R. Liu, F. Sun, L. Zhang, W. Zong, X. Zhao, L. Wang, R. Wu and X. Hao, Sci. Total Environ., 2009, 407, 4181–4188 Search PubMed.
- A. Vulpoi, V. Simon, H. Ylänen and S. Simon, J. Compos. Mater., 2014, 48, 63–70 CrossRef PubMed.
- A. Balamurugan, G. Balossier, D. Laurent-Maquin, S. Pina, A. H. Rebelo, J. Faure and J. M. Ferreira, Dent. Mater., 2008, 24, 1343–1351 CrossRef CAS PubMed.
- S. P. Valappil, M. Coombes, L. Wright, G. J. Owens, R. J. M. Lynch, C. K. Hope and S. M. Higham, Acta Biomater., 2012, 8, 1957–1965 CrossRef CAS PubMed.
- R. K. Kunkalekar, M. S. Prabhu, M. M. Naik and A. V. Salker, Colloids Surf., B, 2013, 113, 429–434 CrossRef PubMed.
- A. Vulpoi, C. Gruian, E. Vanea, L. Baia, S. Simon, H. J. Steinhoff, G. Goller and V. Simon, J. Biomed. Mater. Res., Part A, 2012, 100, 1179–1186 CrossRef CAS PubMed.
- C. Gruian, A. Vulpoi, E. Vanea, B. Oprea, H. J. Steinhoff and S. Simon, J. Phys. Chem. B, 2013, 117, 16558–16564 CrossRef CAS PubMed.
- A. Krajewski, R. Malavolti and A. Piancastelli, Biomaterials, 1996, 17, 53–60 CrossRef CAS.
- D. C. Carter and J. X. Ho, Adv. Protein Chem., 1994, 45, 153–203 CrossRef CAS.
- L. Tang and J. W. Eaton, Am. J. Clin. Pathol., 1995, 103, 466–471 CAS.
- M. S. Bahniuk, H. Pirayesh, H. D. Singh, J. A. Nychka and L. D. Unsworth, Biointerphases, 2012, 7, 41 CrossRef CAS PubMed.
- K. Jacobsen, W. L. Hubbell, O. P. Ernst and T. Risse, Angew. Chem., 2006, 45, 3874–3877 CrossRef CAS PubMed.
- C. Gruian, A. Vulpoi, H. J. Steinhoff and S. Simon, J. Mol. Struct., 2012, 1015, 20–26 CrossRef CAS PubMed.
- E. Vanea, C. Gruian, C. Rickert, H. J. Steinhoff and V. Simon, Biomacromolecules, 2013, 14, 2582–2592 CrossRef CAS PubMed.
- T. Peters Jr, All About Albumin: Biochemistry, Genetics and Medical Applications, Academic Press, San Diego, 1st edn., 1995 Search PubMed.
- M. T. Stankovich and A. J. Bard, J. Electroanal. Chem. Interfacial Electrochem., 1978, 86, 189–199 CrossRef CAS.
- J. L. Hutter and J. Bechhoefer, Rev. Sci. Instrum., 1993, 64, 1868 CrossRef CAS PubMed.
- J. Lu, J. Bravosuarez, A. Takahashi, M. Haruta and S. Oyama, J. Catal., 2005, 232, 85–95 CrossRef CAS PubMed.
- L. Baia, D. Muresan, M. Baia, J. Popp and S. Simon, Vib. Spectrosc., 2007, 43, 313–318 CrossRef CAS PubMed.
- O. Akhavan, M. Abdolahad, Y. Abdi and S. Mohajerzadeh, J. Mater. Chem., 2011, 21, 387–393 RSC.
- T. Radu, D. Benea, R. Ciceo-Lucacel, L. Barbu-Tudoran and S. Simon, J. Phys. Chem. C, 2012, 116(33), 17975–17979 CAS.
- R. Ciceo Lucacel, O. Ponta and V. Simon, J. Non-Cryst. Solids, 2012, 358, 2803–2809 CrossRef CAS PubMed.
- Y. M. Moustafa and K. El-Egili, J. Non-Cryst. Solids, 1998, 240, 144–153 CrossRef CAS.
- K. El-Egili, H. Doweidar, Y. M. Moustafa and I. Abbas, Phys. B, 2003, 339, 237–245 CrossRef CAS PubMed.
- A. Barth, Biochim. Biophys. Acta, Gen. Subj., 2007, 1767, 1073–1101 CrossRef CAS PubMed.
- M. Oblak, A. Prezelj, S. Pecar and T. Solmajer, J. Biosci., 2004, 59, 880–886 CAS.
- A. V. Novikov, R. A. Bublyaev, N. V. Krasnov, Y. P. Kozmin and O. A. Mirgorodskaya, Protein Pept. Lett., 2010, 17, 1392–1397 CrossRef CAS.
- S. Nafisi, G. Bagheri Sadeghi and A. PanahYab, J. Photochem. Photobiol., B, 2011, 105, 198–202 CrossRef CAS PubMed.
- S. Y. Lin, Y. S. Wei, T. F. Hsieh and M. J. Li, Biopolymers, 2004, 75, 393–402 CrossRef CAS PubMed.
- N. Seidel, J. Sitterberg, W. Vornholt, U. Bakowsky, M. Keusgen and T. Kissel, Biomaterials, 2012, 33, 1929–1938 CrossRef CAS PubMed.
- M. Holmberg and X. Hou, Colloids Surf., B, 2011, 84, 71–75 CrossRef CAS PubMed.
| This journal is © The Royal Society of Chemistry 2014 |

