Fabrication and characterization of TiO2–ZrO2–ZrTiO4 nanotubes on TiZr alloy manufactured via anodization
Sepideh
Minagar
a,
Christopher C.
Berndt
ab,
Thomas
Gengenbach
c and
Cuie
Wen
*a
aFaculty of Engineering and Industrial Sciences, Swinburne University of Technology, Hawthorn, Victoria 3122, Australia. E-mail: cwen@swin.edu.au; Fax: +61 3 9214 5050; Tel: +61 3 9214 5651
bDepartment of Materials Science and Engineering, Stony Brook University, Stony Brook, 11794, NY, USA
cCSIRO Materials Science and Engineering, Clayton, Victoria 3168, Australia
First published on 4th November 2013
Abstract
Titanium and its alloys are able to grow a stable oxide layer on their surfaces and have been used frequently as substrates for anodization in an electrochemical surface treatment. A nanotubular oxide layer is formed in the presence of fluorine anion (F−) via anodization due to the competition between oxide formation and solvatization. In this study, a highly ordered titania–zirconia–zirconium titanate (TiO2–ZrO2–ZrTiO4) nanotubular layer was formed on the surface of Ti50Zr alloy via anodic oxidation in an F− containing electrolyte. The sizes of the nanotubes (i.e., the inner and outer diameters, and wall thicknesses), morphology, crystal structure, hydrophilic properties and components of the TiO2–ZrO2–ZrTiO4 nanotubular layer before and after annealing were examined by scanning electron microscopy (SEM), thin film X-ray diffraction, X-ray photoelectron spectroscopy (XPS) analysis and water contact angle measurements. The results indicated that the inner diameter, outer diameter and wall thickness of the as-formed TiO2–ZrO2–ZrTiO4 nanotubes were distributed in the ranges of 3–120 nm, 12–165 nm and 3–32 nm, respectively, and depended on the F− concentration of the electrolyte and the applied potential during anodization. The number of smaller nanotubes increased with increasing F− concentration and the mean nanotube inner and outer diameters increased with increasing applied potential. The as-formed TiO2 and ZrTiO4 nanotubes exhibited an amorphous structure and the as-formed ZrO2 nanotubes displayed an orthorhombic structure. These phases transformed into anatase TiO2 and orthorhombic ZrO2 and ZrTiO4 after annealing. The hydrophilic properties of the TiO2–ZrO2–ZrTiO4 nanotubular layer were affected by the size distribution of the nanotubes. The surface roughnesses and the nanotubular character transformed the nanotubes to exhibit superhydrophilic properties after annealing. The TiO2–ZrO2–ZrTiO4 nanotubular surface on Ti50Zr alloy exhibited higher surface energy than that of the TiO2 nanotubular surface on commercially pure (CP) titanium.
1 Introduction
Titanium (Ti) is the fourth most plentiful metal on earth, lighter (4.5 g cm−3), stronger (480 MPa yield strength) and more expensive than steels (∼7.8 g cm−3 and 175–750 MPa yield strength, respectively).1 Titanium alloys possess exceptional high specific strength and excellent corrosion resistance because of their ability to form a protective oxide layer on their surfaces.2 Applications in aerospace, biomedical and cryogenic industries are examples where titanium and its alloys are used other than as an alloying element for other metals.1,2 Titania (TiO2) that forms on titanium at room temperature is amorphous3 but in crystalline form it exists in 3 phases as brookite, anatase and rutile. Titania has a wide range of applications, such as paint pigment, whitener for paper and rubber and as a finishing agent in porcelain enamels.1 The electrical and optical properties of TiO2 depend on their band gaps, that is 3.0 eV for rutile, 3.2 eV for anatase and 3.2–3.5 eV for the amorphous phase; all of which are influenced by the relative Ti3+ content.3 The TiO2 surface has been employed in gas phase adsorption and catalysis functions; for example CO oxidation, selective reduction of NOx and O2 and water decomposition. The reactive sites are the surface defects such as OH groups, oxygen vacancies and the presence of Ti3+.3 Improved functionalities of TiO2 in the above mentioned applications can be obtained by increasing its specific surface area.An important example where surface modification can be implemented to beneficially alter material characteristics concerns the fabrication of TiO2 nanotubes by the anodic oxidation method. The nanotube arrays are able to impart the substrates with novel functionalities in various applications such as photoelectrochemistry, photocatalysis, dye sensitized solar cells, and electrochromic devices. Anodization, an electrochemical method that has been used for fabrication of nanotubes for over a decade;4–9 is simple, reproducible and versatile. Titanium oxide nanotubes with desirable morphological characteristics can be obtained by controlling the electrochemical conditions such as the applied potential, time of anodization and type and concentration of the electrolyte. The shape and the capillary force of the nanotubes, along with a highly ordered morphology and large surface area, make them an excellent choice for the before-mentioned applications. In the specific instance of biomaterial applications, the highly ordered nanostructured TiO2 promotes osseointegration because the size of integrins and focal contacts of cell–implant interactions is also in the nano scale (∼10 nm).3,10 The effects of different inner and outer diameters of nanotubes and the spaces between them on bone cells during cell culture have been studied extensively.4,5,11,12 Post processing by annealing the TiO2 nanotubes on the titanium alloy surface transforms the phase structure from amorphous to anatase or a mixture of anatase and rutile. Furthermore, growing hydroxyapatite on the surface of these so-formed nanotubes would improve cell behavior such as adhesion, proliferation, morphology, migration, survival and differentiation due to beneficial changes in the topographical and chemistry properties.13–16 Other applications of TiO2 nanotubes include gas sensing (CO, H2, NOx), solution sensing (O2 gas), a substitute for carbon based supports in methanol fuel cells, as nano test tubes and biosensors.3
Zirconium is one of the sister metallic elements of titanium and hafnium, also forms a very stable, cohesive and protective oxide on its surface.17 Zirconium has excellent mechanical, chemical and thermal properties that enable it to be used as catalyst and corrosion resistant structure materials such as pressure vessels, heat exchangers, pumps and valves as well as alloying element for titanium β type alloys.18 Acid and NOx reduction catalyst, optoelectronic and biomedical application have been reported for zirconium oxide known as zirconia.19–21 Zirconia nanotubes can grow on the surface of zirconium by anodization in aqueous and organic electrolyte containing F− ion under different formation conditions22–24 which was discussed in more detail in our previous review.25
There has been much interest in fabricating nanotubes onto the surface of binary titanium alloys; for example, Ti–Zr,26,27 Ti–Ta,27,28 Ti–Nb,27,29 Ti–Al,27 Ti–Mo30 and Ti–W.31 Metal oxide nanotubes have been formed on the surfaces of these alloys and the diameter, shape and distribution of nanotubes were related to the alloy element concentration.26,27,29,32–35 Only a few studies have examined the fabrication of ZrTiO4 nanotubes for applications as microwave resonant components, optical devices and refractory ceramics.26,34–36 The functionalities of nanotubes fabricated on titanium alloys for biomedical applications have also been encouraging; hence the focus of this current investigation.
It has been reported that Ti50Zr (wt%) alloy possesses superior mechanical properties37 and excellent biocompatibility.38,39 Nanotubular oxide layer has been fabricated on its surface and the effect of Zr content on the morphology of anodic oxide layers27,40 and their corrosion behaviours,39,41 crystal structure and optical properties36 have been discussed previously. The formation of single layer35 or multilayers34 of self-organized zirconium titanate nanotubes, and the control of their morphologies and compositions26 have also been reported. Cell biological responses of osteoblasts on anodized titania zirconia nanotubes42 and the effect of surface energy for its functionality43 as well as antibacterial properties of different sizes of titania zirconia nanotubes44 have also been investigated.
This study investigated the fabrication of TiO2–ZrO2–ZrTiO4 nanotubes onto the surface of the Ti50Zr alloy by anodization and contrasted these to TiO2 nanotubes fabricated on the surface of a commercial pure titanium (CP-Ti). A new approach for the characterization of nanotubes, for the first time, in terms of the size distribution of the nanotubes was described and this was affected by the fluoride ion (F−) concentration of the electrolyte and the applied potential. The hydrophilic properties and the roughness changes of the nanotubular surfaces before and after annealing were characterized using a new set of surface roughness parameters such as Sskw, Sku and SI to describe the topography of nanotubular surface.
2 Experimental
Ti50Zr alloy (wt% hereafter) discs with a diameter 8 mm and 2 mm thick were prepared by casting followed by wire-cutting. The disc samples were polished down to a finish of 1 μm diamond paste and then degreased by sonication in methanol, isopropanol, acetone and ethanol. Finally, they were washed with deionized water and dried using a nitrogen (N2) gas stream. CP-Ti foils 10 × 10 mm degreased and washed by means of an identical procedure.The Ti50Zr discs were spot-welded to titanium foil and connected to the anode of an electrochemical cell; the CP-Ti foils were connected to the anode directly. Two electrode configurations were set up using a DC power supply with a 1 cm2 platinum plate as a counter electrode, and placed 4 cm from the working electrode. Electrochemical experiments were performed at room temperature with the electrolyte composed of 1 M (NH4)2SO4 with the addition of small amounts of NH4F (Sigma-Aldrich reagent grades). Electrolytes with different concentrations of fluorine anions (F−) ranging from 0.1 to 0.5 wt% were used to investigate its effect on the nanotube morphologies. After the electrochemical treatment the samples were rinsed with deionized water for 5 min and dried with N2 stream.
The metallographic characterization of the samples was carried out using a field-emission scanning electron microscope (FESEM, ZEISS SUPRA 40 VP). Annealing of the samples was carried out in air at 500 °C for 3 h in a muffle furnace (Nabertherm LT15/13/P330). Phase characterization was performed by means of X-ray Diffraction (XRD, Bruker D8) using Cu Kα incident radiation at 40 kV and 40 mA with a scanning step size of 0.02° from 10 to 90° (2θ). The surface chemistry was analyzed using X-ray photoelectron spectroscopy (XPS, AXIS Ultra DLD, Kratos Analytical Inc., Manchester, UK) with a monochromated Al Ka source at a power of 180 W (15 kV and 12 mA) and a hemispherical analyzer operating in the fixed transmission mode with a standard aperture (analysis area: nominally 0.3 mm × 0.7 mm). Roughness parameters were measured using a 3D-Profilometer (Bruker, Contour GT-K1) and analyzed using the SurfVision software. Water contact angle was measured using a goniometer (NRL C.A. Goniometer, Ramé-hart, Inc.).
The nanotube size distribution measurements were generated from 100 nanotubes on different positions for each of three samples. An average of three readings per sample was acquired for the roughness parameters, water contact and surface energy measurements.
3 Results and discussion
3.1 Formation of TiO2–ZrO2–ZrTiO4 nanotubes
The application of a suitable voltage to the surface of a metal (M) allows the formation of Mn+ ions that can (i) dissolve, or (ii) react with existing O2− and form an insoluble metal oxide layer on the surface of metal, or (iii) partially dissolve due to the composition and conditions of the electrolyte.25Titania nanotubes can be formed on the surface of titanium when it is used as working electrode in an electrochemical cell with platinum as counter electrode and applying a constant voltage between 1 and 30 V in an aqueous electrolyte, or between 5 and 150 V in an organic electrolyte.25,45 The oxidation and reduction reactions at anode and cathode of the cell forms titanium dioxide in the early minutes, according to the reactions described by eqn (1)–(4). The reaction in aqueous electrolyte for water can be given:
| 2H2O ⇆ 2O2− + 4H+ | (1) |
The oxidation reaction at the interface of the titanium surface and electrolyte at a constant applied potential is:
| Ti ⇆ Ti4+ + 4e− | (2) |
| Ti4+ + 2O2− ⇆ TiO2 | (3) |
The reduction reaction at the surface of counter electrode, normally platinum, under these conditions is:
| 4H+ + 4e− ⇆ 2H2 | (4) |
In terms of formation of TiO2–ZrO2–ZrTiO4 or TiZrO4 the following reactions are possible:
| Zr ⇆ Zr4+ + 4e− | (5) |
| Zr4+ + 2O2− ⇆ ZrO2 | (6) |
| 2Ti4+ + 2Zr4+ + 8O2− ⇆ TiO2 + ZrO2 + ZrTiO4 or TiZrO4 | (7) |
The presence of F− allows a complex of titanium and fluoride that is soluble in the electrolyte to be created according to the mechanism proposed in eqn (8) and (9) and a porous layer forms. Nanotubes grow when there is equilibrium between the oxidation of titanium and dissolution of the hexafluorotitanate anion.3
| Ti4+ + 6F− ⇆ [TiF6]2− | (8) |
| Zr4+ + 6F− ⇆ [ZrF6]2− | (9) |
If fluorine ions are not present in the electrolyte, then the thickness of the oxide layer is limited and the current exponentially decays due to decreasing availability of Ti4+, Zr4+ and O2− at the interface between the titanium alloy surface and the titanium–zirconium oxide layer. The Ti4+ and Zr4+ at the interface of the oxide layer and electrolyte will be precipitated as a hydroxide layer if a soluble condition is not provided. In the presence of fluorine ions, a soluble complex of Ti4+ and Zr4+ forms as presented by eqn (8) and (9).
The ionic radius of F− is smaller in comparison to that of O2−. Thus, more fluoride anions will be available at the interface of the titanium surface and the oxide layer since this will be a diffusion controlled process relative to the larger size of O2−.46
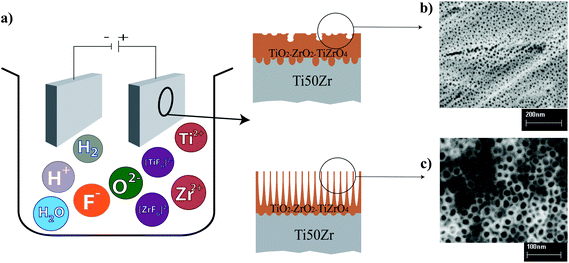
Fig. 1 shows an illustration of the electrochemical cell employed for fabricating TiO2 nanotubes layer.
The nanotube inner and outer diameters, layer thickness and the shape (wavy or smooth walls) depend on the applied potential, time of anodization and the type and concentration of the electrolyte. Four categories of electrolytes for anodizing titanium dioxide nanotubes have been reported; i.e., (i) acidic, (ii) buffered, (iii) polar organic electrolytes, and (iv) nonfluoride based electrolyte.47 For all of these electrolytes, the diameter of the anodized nanotubes is controlled by the applied potential and the nanotube diameter increases as the voltage increases. The nanotube length (in other words, the nanotube layer thickness) is controlled by the anodization time and this increases with increasing time until a steady state is reached at which stage there is no growth in thickness.26
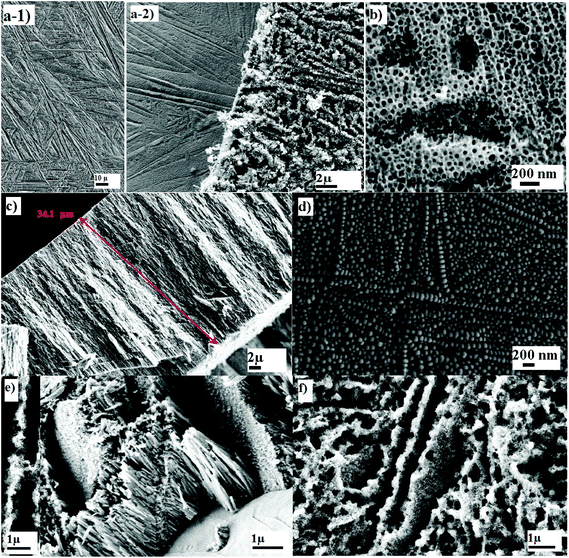
Titania–zirconia–zirconium titanate (TiO2–ZrO2–ZrTiO4) nanotubes were fabricated on the surface of Ti50Zr alloy via anodization at an applied potential of 5–20 V and time of 2 h in the electrolyte of 0.1–0.5 wt% of NH4F. Fig. 2 shows SEM images of the nanotubes on the Ti50Zr alloy. Fig. 2(a-1) shows the microstructure of Ti50Zr alloy after etching which is a needle-like structure. Fig. 2(a-2) shows two images; the left shows the surface after peeling of the nanotubes, demonstrating that the original grain structure of the alloy is reflected in the subsequent growth of the nanotubes. A needlelike morphology composed of different orientations of the nanotubes can be observed from the top view of the nanotubes on the right of Fig. 2(a-2); and a high magnification top view image, as shown in Fig. 2(b), shows the equivalent patch-like regions when the time or the applied potential is not sufficient enough. The cross-section view of the nanotubes, Fig. 2(c), indicates an average thickness (i.e., nanotube length) of 34.1 μm. The bottom view of the nanotubes reveals different sizes; in particular, features located along the grain boundaries appeared to be larger than those inside phases, Fig. 2(d).
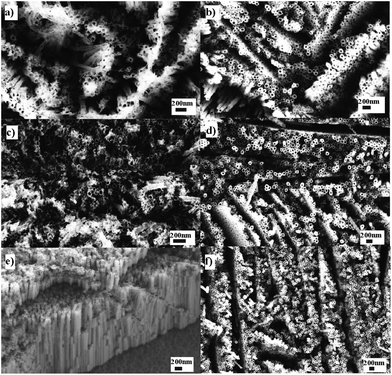
In this study, we investigated the effect of the F− concentration in the electrolyte on the nanotube parameters at constant applied potential and anodization time, as well as the effects of the applied potential on the nanotube parameters at constant F− concentration in the electrolyte and the anodization time. The SEM images of the TiO2–ZrO2–ZrTiO4 nanotubes fabricated on Ti50Zr alloy under different anodization conditions and subsequently annealed at 500 °C for 3 h are shown in Fig. 3. The top view of the TiO2–ZrO2–ZrTiO4 nanotubes fabricated in 0.4 wt% NH4F at 20 V for 2 h is shown in Fig. 3(a). The nanotubes after annealing at 500 °C for 3 h exhibited a slightly larger mean inner and outer diameter, Fig. 3(b). By increasing the F− concentration to 0.5 wt% NH4F, the nanotubes fabricated at the same applied potential of 20 V for 2 h revealed slightly smaller mean inner diameters and larger mean outer diameters, Fig. 3(c). The cross-section view of the nanotubes fabricated at 0.5 wt% NH4F at a lower applied potential of 15 V for 2 h is shown in Fig. 3(e) and the top view of the nanotubes annealed at 500 °C for 3 h is exhibited as Fig. 3(f).
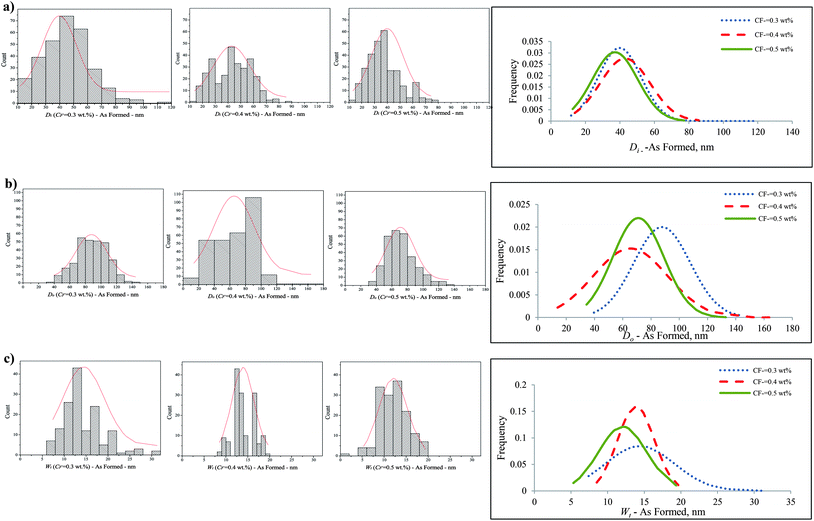
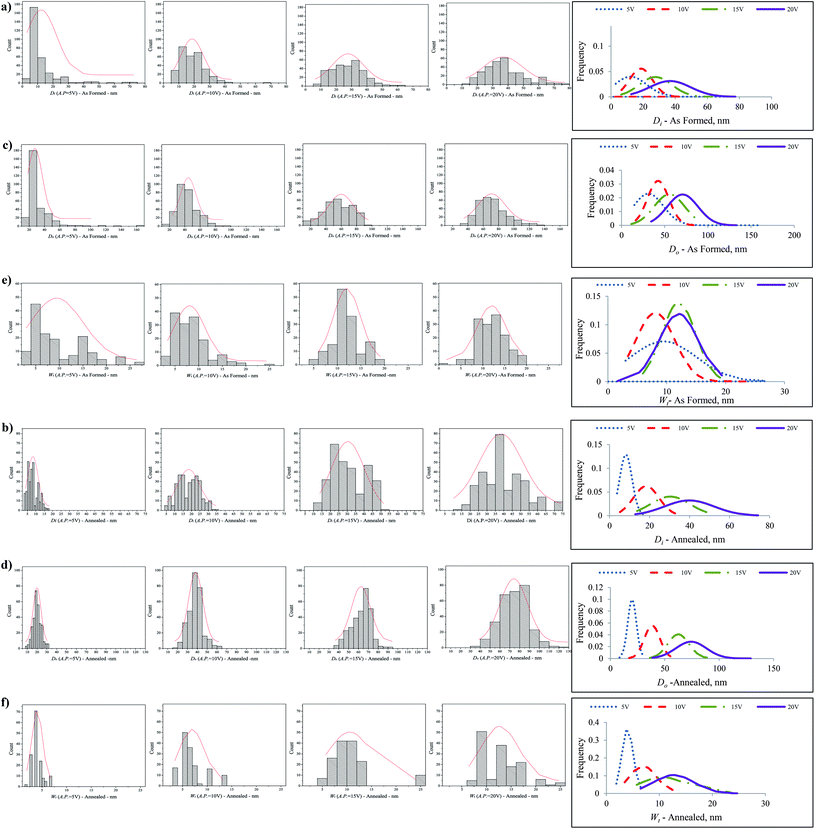
In this study, we denote the F− concentration in the electrolyte, nanotube inner diameter, outer diameter and wall thickness as CF−, Di, Do, and Wt respectively. The Di, Do and Wt of the nanotubes anodized in the electrolyte with CF− increasing from 0.3 to 0.5 wt% were measured and are quantitatively presented in Fig. 4.
During anodization, a nanoporous oxide layer was observed growing on the surface of the Ti50Zr alloy after 15 min in an electrolyte with F− concentrations ranging from 0.1–0.5 wt% at an applied potential of 20 V. Although nanotubes grew underneath this nanoporous layer after 2 h as shown in Fig. 2(b), the nanoporous layer existed when the F− concentration was low; i.e., about 0.1–0.2 wt%. The mean inner diameter (Di) of the nanotubes was 40.3 ± 12.6 nm, the mean outer diameter (Do) was 66.6 ± 14.6 nm, and the mean wall thicknesses (Wt) was 10.0 ± 2.4 nm when the Ti50Zr alloy was anodized in an electrolyte with a CF− = 0.1 wt%. When the CF− increased to 0.2 wt%, the mean Di increased to 44.2 ± 13.0 nm, the mean Do increased to 72.7 ± 13.0 nm and the mean Wt decreased to 9.2 ± 1.8 nm.
As shown in Fig. 4, when the CF− increased from 0.3 to 0.5 wt%, the percentage of nanotubes with both Di < 40 nm and 40 < Di < 80 nm increased; similarly, the percentage of nanotubes with both Do < 60 nm and 60 < Do < 120 nm increased; and also the number of nanotubes with Wt < 10 nm increased. The percentage of nanotubes with Wt ranging from 10 to 20 nm did not show an obvious change. The mean Di, Do and Wt achieved for CP-Ti in the same condition showed similar trends. It can be seen that the distribution of both Di and Do increased with an increase in CF−, while the distribution of Wt decreased slightly when CF− increased. These nanotubes were open at the top and closed at the bottom. After 2.75 h anodization, almost all the nanotubes were separated (Fig. 2(e)). When the time of anodization was extended to 6.25 h, the top features of the nanotubes were damaged randomly with 2 μm observable holes (Fig. 2(f)).
The different distribution of Di, Do and Wt of the TiO2–ZrO2–ZrTiO4 nanotubes is related to the different chemical and electrochemical properties of titanium and zirconium. The standard electrode potential of Zr → Zr4+ is 1.553 V, less than that of Ti → Ti4+, 2.132 V.48 Thus zirconium competes with titanium during anodization, and will oxidize first under the same electrochemical conditions. Also the standard enthalpies of formation of ZrO2 and TiO2 are different, that is, −264.199 and −228.360 gram calories per mole, respectively.49 Hence nanotubes of two different heights formed on the surface of the Ti50Zr alloy. Such a pattern caused different roughness parameters in comparison to the single phase of titania nanotubes formed on pure titanium. The nanotubes formed on the α phase of Ti50Zr exhibit smaller Di, Do and Wt. This morphological difference arises because the α phase contains more zirconium compared to the β phase of the alloy, and the solubility equilibrium constant of (NH4)2ZrF6 is higher than that of (NH4)2TiF6. In terms of CP-Ti, although there was still a nanoporous layer on the surface of nanotubes with large pore size that caused some difficulties for measuring the actual distribution of the size of the nanotubes, the inner and outer diameter increased specifically when CF− increased.
Fig. 5 shows the Di, Do and Wt of TiO2–ZrO2–ZrTiO4 nanotubes anodized in an electrolyte with a constant CF− of 0.5 wt% for 2 h when the applied potential varied from 5 to 20 V. On anodization of Ti50Zr with the applied potential increased from 5 to 20 V at a constant CF− of 0.5 wt% for 2 h, the percentage of nanotubes with Di < 20 nm decreased; but the number of nanotubes with 20 < Di < 40 and 40 < Di < 60 nm increased; similarly, the number of nanotubes with Do < 40 nm decreased but the number of nanotubes with both with 40 < Do < 80 and 80 < Do < 120 nm increased; however, the number of nanotubes with Wt both <5 nm and 5 < Wt < 15 nm increased.
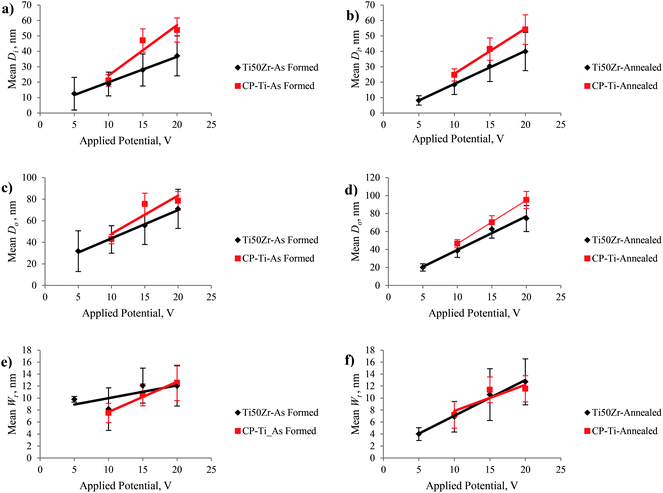
There was a nanoporous layer on the top of the nanotubular surface when the titanium alloy was anodized at the applied potential of 5 V. It is assumed that increasing the applied potential provides a larger anodic current for nanotube formation and leads to an increase in inner and outer nanotube diameter.26,46 It can be concluded that increasing applied potential did not affect the Wt of nanotubes. The mean sizes of as-formed TiO2–ZrO2–ZrTiO4 nanotubes on Ti50Zr were smaller than those of as-formed single phase TiO2 nanotubes on pure titanium. Fig. 6 and 7 demonstrate the mean nanotube size of Ti50Zr and CP-Ti with changing CF− and applied potential. As abovementioned, it was impossible to measure Di, Do and Wt of fabricated TiO2 nanotubes on CP-Ti anodized at 5 V because a nanoporous layer covered the entire nanotubular surface.
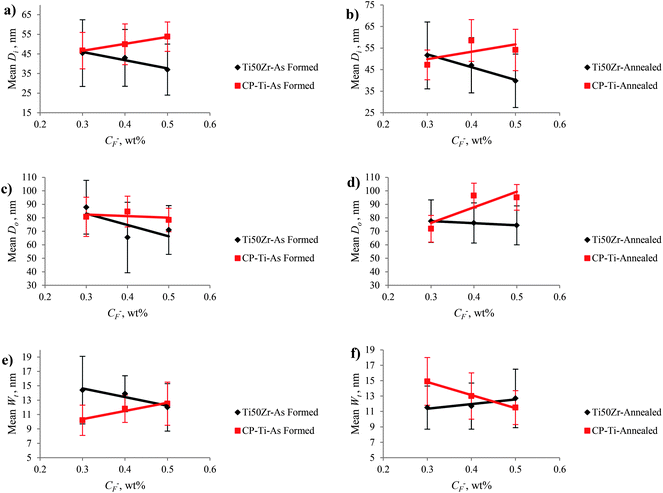 | ||
| Fig. 6 Mean nanotube size of Ti50Zr and CP-Ti as a function of CF−: (a) Di for As Formed, (b) Di for annealed (c) Do for As Formed, (d) Do for annealed, (e) Wt for As Formed and (f) Wt for annealed. | ||
The EDS results of the as-formed TiO2–ZrO2–ZrTiO4 nanotubes showed that there was a layer of TiO2 and ZrO2. Fig. 8(b) shows the EDS result measured at the bottom of the nanotubular layer. The oxygen and fluorine concentrations were higher than those at the top of the nanotubular layer as shown in Fig. 8(a).
 | ||
| Fig. 8 EDS analysis for the (a) top and (b) bottom of TiO2–ZrO2–ZrTiO4 nanotubes formed in 0.5 wt% NH4F at 20 V after 2 h. | ||
3.2 Surface roughness of the TiO2–ZrO2–ZrTiO4 nanotubular surface
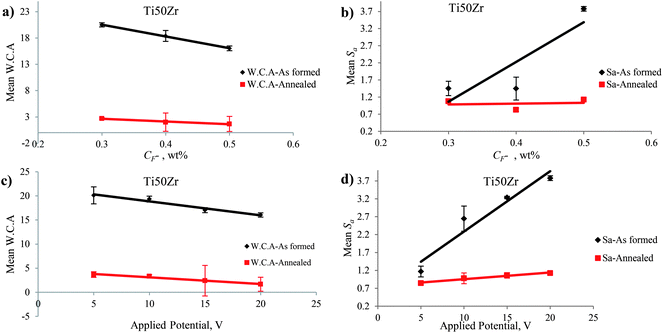
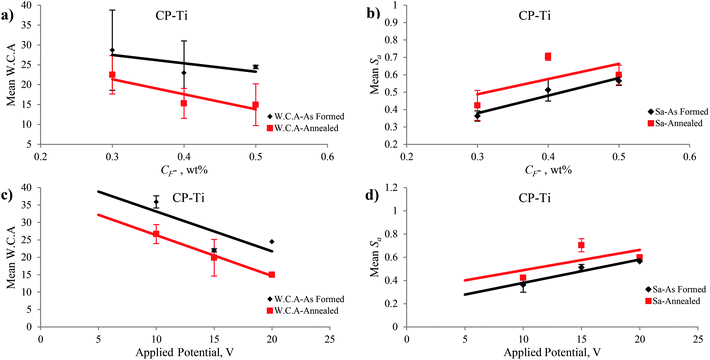
There are three types of parameters for characterizing surface topography: (i) the amplitude parameters, (ii) the spacing parameters, and (iii) hybrid parameters. These parameters can be determined with a 3D profiler that is coupled with SurfVision software. Amplitude parameters such as mean roughness (Sa) and Root Mean Square (RMS) roughness (Sq) that measure the vertical characteristics of surface deviations have been used in this study and evaluated over the complete 3D surface. These parameters represent an overall description of the surface textures that enable the differentiation of peaks, valleys, and the spacing of surface textures.50 In this study, the roughness amplitude parameters of Sa and Sq increased with increasing both the CF− from 0.3 to 0.5 wt% and the applied potential from 5 to 20 V (Fig. 9(b) and (d)). As it can be seen in Fig. 9(b), the difference between Sa of nanotubular layer fabricated in CF− = 0.4 and CF− = 0.5 wt% was higher than the difference between Sa of nanotubular layer fabricated in CF− = 0.3 and CF− = 0.4 wt% according to the different chemical and electrochemical reaction rates of titanium and zirconium in the alloy.The nanotubular layers of TiO2–ZrO2–ZrTiO4 grown on the surface of Ti50Zr were nanoscale in the horizontal dimension. However, the layers exhibited different heights depending on the microstructure (i.e., different phases of α and β) of the surface due to the different chemical and electrochemical reaction rates of titanium and zirconium in the alloy. The surface roughness parameters were on the micrometer scale and displayed higher values than on CP-Ti before anodization. The degree of symmetry of the surface heights about the mean plane is represented by Sskw, the skewness of a 3D surface texture, and it is the third central moment of the profile amplitude probability density function.50 The sign of Sskw indicates the dominant nature of topography. For example, Sskw > 0 implies high peaks; whereas Sskw < 0 indicates valley structures such as deep scratches.50 Almost the entire as-formed TiO2–ZrO2–ZrTiO4 nanotubular surface exhibited negative Sskw or a lesser value in comparison to that of the as-formed TiO2 nanotubes (Table 1).
| Anodization conditions | As-formed | Annealed | |||||
|---|---|---|---|---|---|---|---|
| Surface area index SI | S skw | S ku | Surface area index SI | S skw | S ku | ||
| a All the surface was covered by a nanoporous layer. | |||||||
| 0.3–20 V | Ti50Zr | 4.96 ± 0.73 | −1.79 ± 0.43 | 6.64 ± 2.18 | 4.34 ± 0.22 | −0.23 ± 0.08 | 21.05 ± 2.81 |
| CP-Ti | 1.57 ± 0.07 | 1.34 ± 0.59 | 8.11 ± 6.08 | 1.47 ± 0.05 | −0.85 ± 0.41 | 3.84 ± 1.35 | |
| 0.4–20 V | Ti50Zr | 8.05 ± 1.59 | −2.98 ± 0.66 | 16.85 ± 6.36 | 5.58 ± 1.13 | −2.52 ± 1.13 | 39.44 ± 3.85 |
| CP-Ti | 1.80 ± 0.06 | 0.67 ± 0.22 | 3.40 ± 0.27 | 2.12 ± 0.06 | −0.18 ± 0.18 | 2.49 ± 0.19 | |
| 0.5–20 V | Ti50Zr | 13.18 ± 0.38 | 0.61 ± 0.02 | 2.11 ± 0.03 | 3.12 ± 0.06 | −1.43 ± 0.12 | 16.60 ± 1.60 |
| CP-Ti | 1.71 ± 0.07 | −0.67 ± 0.12 | 3.30 ± 0.12 | 1.49 ± 0.01 | −0.80 ± 0.03 | 2.97 ± 0.07 | |
| 0.5–15 V | Ti50Zr | 10.99 ± 2.04 | 0.25 ± 0.37 | 2.08 ± 0.28 | 4.16 ± 0.3 | −0.93 ± 0.09 | 17.03 ± 3.49 |
| CP-Ti | 2.20 ± 0.13 | 0.83 ± 0.25 | 3.38 ± 0.69 | 2.61 ± 0.13 | 0.27 ± 0.29 | 2.37 ± 0.33 | |
| 0.5–10 V | Ti50Zr | 10.69 ± 6.56 | 0.06 ± 0.34 | 2.03 ± 0.06 | 2.66 ± 0.30 | −2.02 ± 0.18 | 12.41 ± 2.50 |
| CP-Ti | 1.31 ± 0.03 | 0.33 ± 0.19 | 3.68 ± 0.09 | 1.29 ± 0.02 | 0.01 ± 0.07 | 2.75 ± 0.03 | |
| 0.5–5 V | Ti50Zr | 5.29 ± 2.53 | 0.85 ± 0.45 | 3.86 ± 2.26 | 2.53 ± 0.07 | −1.15 ± 0.15 | 10.30 ± 2.33 |
| CP-Tia | — | — | — | — | — | — | |
The nature of the height distribution is indicated by Sku, i.e., the kurtosis of the 3D surface texture that is the fourth central moment of the profile amplitude probability density function and describes the sharpness of distribution.50Sku is 3.0 when the surface heights are normally distributed. For Sku < 3.0, the distribution is platykurtoic, indicating a few high peaks and low valleys. For Sku > 3.0, the distribution is leptokurtoic and indicates many high peaks and low valleys. Almost all of the as-formed TiO2–ZrO2–ZrTiO4 nanotubular surfaces were platykurtoic and all of the as-formed TiO2 nanotubular surfaces were leptokurtoic (Table 1); thereby reinforcing the changing natures of the topography dependent of the forming mechanism.
The surface index (SI) is calculated using Surfvision software by the following equation:
| SI = Sp/SL | (10) |
3.3 Hydrophilic properties of the nanotubular surfaces
Hydrophobicity and hydrophilicity are the terms that are defined by the wetting properties of a surface by water.51 Accepted definitions generally consider water contact angle as follows: (i) superhydrophobic: static water contact angle >150°, (ii) hydrophobic: water contact angle between 90° and 150°, (iii) hydrophilic: water contact angle between 10° and 90°, and (iv) superhydrophilic: water contact angle less than 10°.52 Parameters such as type of the material, surface roughness, heterogeneities of the surface, chemical composition and presence of contamination; as well as parameters related to the ambient conditions, can influence the wettability of a surface.51 In this study, the nanotubular surfaces of TiO2–ZrO2–ZrTiO4 nanotubes anodized in all conditions were hydrophilic. The hydrophilicity of the anodized nanotubular surface did not change obviously on increasing CF−, but it increased with an increase in the applied potential. Fig. 9 and 10 show the mean roughness (Sa) and mean water contact angle (W.C.A.) of the as-formed TiO2–ZrO2–ZrTiO4 nanotubular surfaces, annealed TiO2–ZrO2–ZrTiO4 nanotubular surfaces, and the as-formed TiO2 and annealed TiO2 nanotubular surfaces as a function of the CF− and the applied potential.The wettability of the nanotubular surface increased when roughness parameters increased. It is noticeable that the wettability of nanotubular surface on Ti50Zr was higher than that of the nanotubular surface on CP-Ti. According to the Owens–Wendt (OW) method,53 surface energy can be calculated using the following equation:
(1 + cos![[thin space (1/6-em)]](https://www.rsc.org/images/entities/char_2009.gif) θ)γL = 2(√γdLγd+S√γpSγpL) θ)γL = 2(√γdLγd+S√γpSγpL) | (11) |
| Anodization conditions | As-formed | Annealed | |||||||
|---|---|---|---|---|---|---|---|---|---|
| Contact angle (θ) | γ dS (mJ m−2) | γ pS (mJ m−2) | γ S = γdS + γpS (mJ m−2) | Contact angle (θ) | γ dS (mJ m−2) | γ pS (mJ m−2) | γ S = γdS + γpS (mJ m−2) | ||
| a All the surface was covered by a nanoporous layer. | |||||||||
| 0.3–20 V | Ti50Zr | 20.50 ± 0.40 | 15.98 | 52.67 | 68.65 | 2.70 ± 0.17 | 14.93 | 58.71 | 73.64 |
| CP-Ti | 28.68 ± 10.08 | 22.45 | 41.87 | 64.32 | 22.50 ± 4.82 | 12.95 | 55.56 | 68.51 | |
| 0.4–20 V | Ti50Zr | 18.40 ± 1.04 | 17.88 | 51.39 | 69.27 | 2.00 ± 1.73 | 14.15 | 59.77 | 73.92 |
| CP-Ti | 22.97 ± 8.06 | 0.58 | 86.36 | 86.94 | 15.30 ± 3.75 | 13.57 | 57.84 | 71.41 | |
| 0.5–20 V | Ti50Zr | 16.03 ± 0.45 | 16.93 | 53.37 | 70.30 | 1.67 ± 1.44 | 15.44 | 58.10 | 73.54 |
| CP-Ti | 24.47 ± 0.45 | 14.39 | 52.65 | 67.04 | 14.97 ± 5.25 | 3.33 | 77.92 | 81.25 | |
| 0.5–15 V | Ti50Zr | 17.40 ± 0.53 | 17.89 | 51.77 | 69.66 | 2.40 ± 3.17 | 14.70 | 59.03 | 73.73 |
| CP-Ti | 22.00 ± 1.70 | 11.00 | 58.58 | 69.58 | 19.87 ± 2.70 | 7.52 | 65.58 | 73.10 | |
| 0.5–10 V | Ti50Zr | 19.33 ± 0.61 | 15.62 | 53.62 | 69.24 | 3.33 ± 0.29 | 14.42 | 59.33 | 73.75 |
| CP-Ti | 35.90 ± 11.46 | 17.44 | 42.19 | 59.63 | 26.67 ± 0.49 | 12.27 | 54.19 | 66.46 | |
| 0.5–5 V | Ti50Zr | 20.11 ± 1.76 | 15.99 | 52.83 | 68.82 | 3.67 ± 0.58 | 14.98 | 58.57 | 73.55 |
| CP-Tia | — | — | — | — | — | — | — | — | |
3.4 Effect of annealing on the TiO2–ZrO2–ZrTiO4 nanotubes
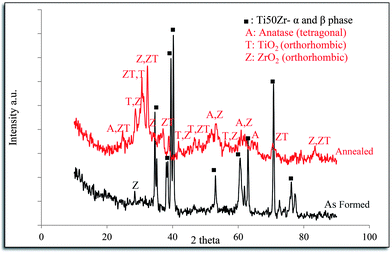
TiO2 and ZrTiO4 nanotubes with an amorphous structure and ZrO2 with an orthorhombic structure were fabricated via anodization under the conditions of 0.5 wt% NH4F, 20 V for 2 h. The amorphous TiO2 and ZrTiO4 nanotubes transformed into (i) tetragonal anatase TiO2, (ii) a mixture of orthorhombic TiO2 and ZrO2 similar to srilankite, and (iii) orthorhombic ZrTiO4 after annealing at 500 °C for 3 h; as indicated by the XRD patterns in Fig. 11. Varghese et al.14 reported that amorphous TiO2 nanotubes transformed to anatase and rutile preferably along the length and the curvatures of the nanotubes rather than wall thickness by annealing. A crystalline cubic phase of ZrO2 accompanied by the phase of TiZrO4 or ZrTiO4 formed on the surface of Ti50Zr alloy via anodization.23,35After annealing at 500 °C for 3 h some changes in inner and outer diameter and wall thickness of the nanotubes formed on Ti50Zr via anodization were observed which can explain the formation of crystalline phases of TiO2–ZrO2–ZrTiO4. Annealing also caused significant diversity in the roughness parameters and hydrophilic properties of the nanotubular surfaces fabricated under different CF− and applied potential conditions. After annealing the values of Sa and Sq decreased for the nanotubular surface fabricated at each applied potential of 5 to 20 V. The surface parameters increased when the applied potential increased from 5 to 10 V, but decreased when the applied potential increased from 15 to 20 V. Almost all the annealed TiO2–ZrO2–ZrTiO4 nanotubular surfaces exhibited more negative Sskw values compared to the annealed TiO2 nanotubular surfaces, although both exhibited cracks after annealing that would have influenced the results. After annealing, the value of Sku of the TiO2–ZrO2–ZrTiO4 nanotubular surfaces increased but those for TiO2 nanotubular surfaces decreased. Annealed TiO2–ZrO2–ZrTiO4 nanotubular surfaces exhibited a higher surface index than the annealed TiO2 nanotubular surfaces.
The hydrophilicity of the TiO2–ZrO2–ZrTiO4 nanotubular surfaces on Ti50Zr increased significantly after annealing for both anodizing conditions; i.e., for increasing CF− and applied potential. That is, the hydrophilicity increased with increases in both the Di and Do. After annealing, almost all the TiO2–ZrO2–ZrTiO4 nanotubular surfaces anodized under all the conditions exhibited superhydrophilic properties. In contrast, the TiO2 nanotubular surfaces fabricated on CP-Ti showed hydrophilic properties. In general, the surface energy of the annealed TiO2–ZrO2–ZrTiO4 nanotubular surfaces was higher than those of annealed TiO2 nanotubular surfaces and the as-formed TiO2–ZrO2–ZrTiO4 nanotubular surfaces. This result was reflected in lower water contact angles.
X-ray photoelectron spectroscopy (XPS) was used to evaluate the chemistry of the nanotubes. The XPS spectra of as-formed and annealed TiO2–ZrO2–ZrTiO4 are shown in Fig. 12.
 | ||
| Fig. 12 XPS spectra for the as-formed and the annealed TiO2–ZrO2–ZrTiO4 nanotubes. (a) O 1s, (b) Ti 2p, and (c) Zr 3d. | ||
The nanotubular surface consisted of 48.55 at% O, 13.43 at% Ti, 8.64 at% Zr for the as-formed nanotubes, and 51.23 at% O, 14.57 at% Ti and 8.35 at% Zr after annealing. The remaining atomic percentages arose from carbon contamination and remnant fluorine. The F residue after annealing was 0.15 at% in comparison to 3.23 at% for the as-formed nanotubes. The Ti 2p3/2 and Zr 3d5/2 peaks have binding energies of 458.7–458.8 and 182.5–182.7 eV, respectively, which represent the fully oxidized titanium ion in its Ti4+ and zirconium ion in its Zr4+ state. A small splitting of the O 1s spectrum at 532.27 (As formed) and 532.21 eV (annealed) showed the existence of ZrTiO4. This is because of the different coordinations of oxide ions (Zr–O–Zr, Ti–O–Ti and Zr–O–Ti)55 as well as shifting to lower binding energy (Zr 3d5/2) due to phase transformation during annealing.
4 Conclusions
Nanotubes formed on Ti50Zr alloy via anodization have potential biomedical applications such as promoting cell interaction; biomedical coatings; and drug delivery and release of other payloads. The different phase components of Ti50Zr alloy led to the formation of TiO2–ZrO2–ZrTiO4 nanotubes that are mostly microscopically needlelike and separated from each other by an interspace. A distribution of nanotubes with different sizes including inner diameter Di, outer diameter Do and wall thickness Wt, resulting from the different zirconium contents in the α and β phases of the alloy, was observed. The effects of the F− concentration (CF−) in the electrolyte, the applied potential on the nanotube characteristics was revealed. The conclusions are as follows:1. Because of the different chemical and electrochemical reaction rates of titanium and zirconium with O2− and F− in the electrolytes, an increase in the CF− led to an increase in the number of nanotubes with smaller Di, Do and Wt.
2. Increasing the applied potential has the consequence of increasing the anodic current. The number of nanotubes with smaller Di and Do decreased; the number of nanotubes with larger Di and Do increased; and the Wt of the nanotubes fabricated at 5 and 10 V did not changed much in contrast to the Wt of the nanotubes fabricated at 15 and 20 V, although they exhibited thicker walls.
3. The mean roughness (Sa) and the Root Mean Square (RMS) roughness (Sq) of the nanotubular surfaces increased on increasing both the CF− and the applied potential.
4. The hydrophilic properties of the anodized TiO2–ZrO2–ZrTiO4 nanotubular surface of Ti50Zr increased with an increase in the CF− and the applied potential, which is related to changes in the distribution of the nanotube size. The water contact angle on these surfaces decreased when the roughness parameters of the surface increased. The surface energy followed the same increasing trend of hydrophilic properties. The TiO2–ZrO2–ZrTiO4 nanotubular surfaces of Ti50Zr exhibited higher surface energy than those of TiO2 nanotubular surfaces on CP-Ti.
5. The surface area index SI increased with increasing CF− and applied potential, which is linked to changes in the nanotube size distribution.
6. Annealing changed the phase structure, Di, Do and Wt of nanotubes, surface roughness, hydrophilic property and surface energy; i.e., (i) the amorphous nanotubes changed to a mixture of anatase, orthorhombic TiO2 and ZrO2, and orthorhombic ZrTiO4, (ii) the mean of Di and Do increased at higher voltage (e.g. 15 and 20 V) and Wt did not change much, (iii) Sa and Sq decreased, and (vi) the hydrophilicity and surface energy increased.
7. The mixed nanotubes of TiO2–ZrO2–ZrTiO4 on Ti50Zr alloy with a variety of nanotube size distribution and other related properties such as hydrophilicity and roughness are more promising for biomedical applications than the 100% TiO2 nanotubes on CP-Ti.
Acknowledgements
This research is supported by the Australian Research Council (ARC) through the ARC Discovery Project DP110101974. SM would like to acknowledge the State Government of Victoria in Australia for supporting and funding this research project through a Victorian International Research Scholarship. The technical assistance of Messieurs Brian Dempster and Andrew Moore is gratefully acknowledged.References
- M. Halka and B. Nordstrom, in Transition Metals, Facts On File, New York, 2010, ch. 2, pp.12–39 Search PubMed.
- F. C. Campbell, in Elements of Metallurgy and Engineering Alloys, ASM International, Materials Park, OH, USA, 2008, pp. 527–545 Search PubMed.
- P. Roy, S. Berger and P. Schmuki, Angew. Chem., Int. Ed., 2011, 50, 2904–2939 CrossRef CAS PubMed.
- J. Park, S. Bauer, K. Von Der Mark and P. Schmuki, Nano Lett., 2007, 7, 1686–1691 CrossRef CAS PubMed.
- J. Park, S. Bauer, K. A. Schlegel, F. W. Neukam, K. von der Mark and P. Schmuki, Small, 2009, 5, 666–671 CrossRef CAS PubMed.
- H. H. Park, I. S. Park, K. S. Kim, W. Y. Jeon, B. K. Park, H. S. Kim, T. S. Bae and M. H. Lee, Electrochim. Acta, 2010, 55, 6109–6114 CrossRef CAS PubMed.
- S. Oh and S. Jin, Mater. Sci. Eng., C, 2006, 26, 1301–1306 CrossRef CAS PubMed.
- S. Oh, K. S. Brammer, Y. S. J. Li, D. Teng, A. J. Engler, S. Chien and S. Jin, Proc. Natl. Acad. Sci. U. S. A., 2009, 106, 2130–2135 CrossRef CAS PubMed.
- S. Oh, K. S. Brammer, K.-S. Moon, J.-M. Bae and S. Jin, Mater. Sci. Eng., C, 2011, 31, 873–879 CrossRef CAS PubMed.
- S. Minagar, J. Wang, C. C. Berndt, E. P. Ivanova and C. Wen, J. Biomed. Mater. Res., Part A, 2013, 101, 2726–2739 CrossRef PubMed.
- C. Von Wilmowsky, S. Bauer, R. Lutz, M. Meisel, F. W. Neukam, T. Toyoshima, P. Schmuki, E. Nkenke and K. A. Schlegel, J. Biomed. Mater. Res., Part B, 2009, 89, 165–171 CrossRef PubMed.
- K. S. Brammer, S. Oh, C. J. Cobb, L. M. Bjursten, H. v. d. Heyde and S. Jin, Acta Biomater., 2009, 5, 3215–3223 CrossRef CAS PubMed.
- A. Roguska, M. Pisarek, M. Andrzejczuk, M. Dolata, M. Lewandowska and M. Janik-Czachor, Mater. Sci. Eng., C, 2011, 31, 906–914 CrossRef CAS PubMed.
- O. K. Varghese, D. Gong, M. Paulose, C. A. Grimes and E. C. Dickey, J. Mater. Res., 2003, 18, 156–165 CrossRef CAS.
- Y. Bai, I. S. Park, H. H. Park, M. H. Lee, T. S. Bae, W. Duncan and M. Swain, Surf. Interface Anal., 2011, 43, 998–1005 CrossRef CAS.
- R. Narayanan, H. J. Lee, T. Y. Kwon and K. H. Kim, Mater. Chem. Phys., 2011, 125, 510–517 CrossRef CAS PubMed.
- R. H. Nielsen, J. H. Schlewitz, H. Nielsen and S. Updated by, in Kirk-Othmer Encyclopedia of Chemical Technology, John Wiley & Sons, Inc., 2000, vol. 26, pp. 621–664 Search PubMed.
- R. T. Webster and T. W. C. Albany, in ASM Handbook, ASM International, 1990, pp. 1099–1201 Search PubMed.
- T. Yamaguchi, Catal. Today, 1994, 20, 199–217 CrossRef CAS.
- K. A. Bethke, M. C. Kung, B. Yang, M. Shah, D. Alt, C. Li and H. H. Kung, Catal. Today, 1995, 26, 169–183 CrossRef CAS.
- R. Hahn, S. Berger and P. Schmuki, J. Solid State Electrochem., 2010, 14, 285–288 CrossRef CAS.
- H. Tsuchiya and P. Schmuki, Electrochem. Commun., 2004, 6, 1131–1134 CrossRef CAS PubMed.
- H. Tsuchiya, J. M. Macak, L. Taveira and P. Schmuki, Chem. Phys. Lett., 2005, 410, 188–191 CrossRef CAS PubMed.
- S. Berger, J. Faltenbacher, S. Bauer and P. Schmuki, Phys. Status Solidi RRL, 2008, 2, 102–104 CrossRef CAS.
- S. Minagar, C. C. Berndt, J. Wang, E. Ivanova and C. Wen, Acta Biomater., 2012, 8, 2875–2888 CrossRef CAS PubMed.
- K. Yasuda and P. Schmuki, Electrochim. Acta, 2007, 52, 4053–4061 CrossRef CAS PubMed.
- H. Tsuchiya, J. Nakata, S. Fujimoto, S. Berger and P. Schmuki, Anodic porous and tubular oxide layers on Ti alloys, Honolulu, HI, 2008, pp. 359–367 Search PubMed.
- P. Capellato, B. S. Smith, K. C. Popat and A. P. R. A. Claro, Mater. Sci. Eng., C, 2012, 32, 2060–2067 CrossRef CAS PubMed.
- A. Ghicov, S. Aldabergenova, H. Tsuchyia and P. Schmuki, Angew. Chem., Int. Ed., 2006, 45, 6993–6996 CrossRef CAS PubMed.
- P. Agarwal, I. Paramasivam, N. K. Shrestha and P. Schmuki, Chem.–Asian J., 2010, 5, 66–69 CrossRef CAS PubMed.
- I. Paramasivam, Y. C. Nah, C. Das, N. K. Shrestha and P. Schmuki, Chem.–Eur. J., 2010, 16, 8993–8997 CrossRef CAS PubMed.
- H. Tsuchiya, T. Akaki, J. Nakata, D. Terada, N. Tsuji, Y. Koizumi, Y. Minamino, P. Schmuki and S. Fujimoto, Corros. Sci., 2009, 51, 1528–1533 CrossRef CAS PubMed.
- H. Tsuchiya, T. Akaki, J. Nakata, D. Terada, N. Tsuji, Y. Koizumi, Y. Minamino, P. Schmuki and S. Fujimoto, Electrochim. Acta, 2009, 54, 5155–5162 CrossRef CAS PubMed.
- K. Yasuda and P. Schmuki, Electrochem. Commun., 2007, 9, 615–619 CrossRef CAS PubMed.
- K. Yasuda and P. Schmuki, Adv. Mater., 2007, 19, 1757–1760 CrossRef CAS.
- G. Liu, H. Lu, Z. Chen, F. Li, L. Wang, J. Watts, G. Q. Lu and H. M. Cheng, J. Nanosci. Nanotechnol., 2009, 9, 6501–6510 CrossRef CAS PubMed.
- E. Kobayashi, S. Matsumoto, H. Doi, T. Yoneyama and H. Hamanaka, J. Biomed. Mater. Res., 1995, 29, 943–950 CrossRef CAS PubMed.
- Y. Li, C. Wong, J. Xiong, P. Hodgson and C. Wen, In vitro cytotoxicity of binary Ti alloys for bone implants, Gold Coast, QLD, 2009, pp. 295–298 Search PubMed.
- W. G. Kim, H. C. Choe, Y. M. Ko and W. A. Brantley, Electrochemical characteristics of nanotube formed Ti-Zr alloy, Quebec City, QC, 2008, pp. 462–465 Search PubMed.
- W. G. Kim, H. C. Choe, Y. M. Ko and W. A. Brantley, Thin Solid Films, 2009, 517, 5033–5037 CrossRef CAS PubMed.
- W. G. Kim and H. C. Choe, Trans. Nonferrous Met. Soc. China, 2009, 19, 1005–1008 CrossRef CAS.
- S. Sista, A. Nouri, Y. Li, C. Wen, P. D. Hodgson and G. Pande, J. Biomed. Mater. Res., Part A, 2013 DOI:10.1002/jbm.a.34638.
- S. Sista, C. e. Wen, P. D. Hodgson and G. Pande, J. Biomed. Mater. Res., Part A, 2011, 97, 27–36, DOI:10.1002/jbm.a.34738.
- S. Grigorescu, C. Ungureanu, R. Kirchgeorg, P. Schmuki and I. Demetrescu, Appl. Surf. Sci., 2013, 270, 190–196 CrossRef CAS PubMed.
- Y. Wang, C. Wen, P. Hodgson and Y. Li, J. Biomed. Mater. Res., Part A, 2013 Search PubMed.
- J. M. Macak, H. Tsuchiya, A. Ghicov, K. Yasuda, R. Hahn, S. Bauer and P. Schmuki, Curr. Opin. Solid State Mater. Sci., 2007, 11, 3–18 CrossRef CAS PubMed.
- C. P. Xin, in Biological and Biomedical Coatings Handbook: Processing and Characterization, ed. S. Zhang, CRC Press, Hoboken, 2011, pp. 203–236 Search PubMed.
- in CRC Materials Science and Engineering Handbook, ed. J. F. S. a. W. Alexander, CRC Press, Boca Raton, 2000, ch. 9, tbl. 309 Search PubMed.
- in CRC Materials Science and Engineering Handbook, ed. J. F. S. a. W. Alexander, CRC Press, Boca Raton, 2000, ch. 4, tbl. 67 Search PubMed.
- E. S. Gadelmawla, M. M. Koura, T. M. A. Maksoud, I. M. Elewa and H. H. Soliman, J. Mater. Process. Technol., 2002, 123, 133–145 CrossRef.
- S. A. S. N. Z. C. EL-010, Standard Australia, GPO Box 5420, Sydney, NSW 2001, Australia, 2005, p. 15.
- H. K. Webb, J. Hasan, V. K. Truong, R. J. Crawford and E. P. Ivanova, Curr. Med. Chem., 2011, 18, 3367–3375 CrossRef CAS.
- D. K. Owens and R. C. Wendt, J. Appl. Polym. Sci., 1969, 13, 1741–1747 CrossRef CAS.
- J. R. Dann, J. Colloid Interface Sci., 1970, 32, 302–320 CrossRef CAS.
- H. Ikawa, T. Yamada, K. Kojima and S. Matsumoto, J. Am. Ceram. Soc., 1991, 74, 1459–1462 CrossRef CAS.
| This journal is © The Royal Society of Chemistry 2014 |

