
 Open Access Article
 This Open Access Article is licensed under a Creative Commons Attribution-Non Commercial 3.0 Unported Licence
Nanoporous hematite structures to overcome short diffusion lengths in water splitting†
Hyo-Jin
Ahn
,
Myung-Jun
Kwak
,
Jung-Soo
Lee
,
Ki-Yong
Yoon
and
Ji-Hyun
Jang
*
School of Energy & Chemical Engineering, Ulsan National Institute of Science and Technology (UNIST), Ulsan, 689–798, Republic of Korea. E-mail: clau@unist.ac.kr
First published on 10th October 2014
Abstract
In this report, we show that by creating a nanoporous haematite (α-Fe2O3) structure using boric acid (H3BO3) treatment, the chronic issue of the short diffusion length of carriers in α-Fe2O3 for photoelectrochemical (PEC) applications can be successfully addressed. The slow release of Fe3+ ions because of the presence of H3BO3 leads to the creation of smaller dimension FeOOH nanorods, creating nanoporous α-Fe2O3 nanorods, composed of ∼15 nm α-Fe2O3 domains. The nanoporous α-Fe2O3 suppresses recombination by providing the facile extraction of holes from the surface of favorably sized α-Fe2O3 domains. The optimized nanoporous sample showed a photocurrent density of 1.41 mA cm−2 at a reversible hydrogen electrode of 1.23 V, which is 1.7 times higher than that of pristine hematite. The electrochemical impedance spectroscopy and incident photon-to-current efficiency data, and Mott–Schottky plots confirmed the superior performance of the nanoporous samples. Our impressive results may pave the way for designing devices for advanced energy conversion applications as well as fabricating a high efficiency hematite-based PEC system.
Photoelectrochemical (PEC) water splitting cells which use solar energy to produce hydrogen or oxygen gas are a promising technology for solving the energy crisis and environmental problems.1–6 Since Fujishima and Honda first reported a PEC water splitting system using a titanium dioxide semiconductor, n-type semiconductors have been considered to be promising photoanode materials for PEC water splitting cells.7,8 Hematite (α-Fe2O3) is a very attractive material among n-type semiconductors for PEC water splitting because of its relatively narrow band gap (2.1–2.2 eV) and superior chemical stability in electrolytes.9,10 More importantly, compared to rare semiconductor materials (As, Ga, In, Se, and so on), which are commonly used in monolithic photovoltaic-PEC cells, α-Fe2O3 is very cheap and abundant, and therefore, able to achieve high solar-to-hydrogen (STH) efficiency economically.11 However, although theoretical prediction of STH efficiency and water splitting photocurrent of α-Fe2O3 is 16.8% and 12.6 mA cm−2, respectively, the performance of the state-of-the-art α-Fe2O3-based water splitting systems is still low because of poor electrical conductivity,12,13 short carrier lifetime,14 and short hole diffusion length.15 To solve these problems, various efforts have been tried, such as doping of α-Fe2O3 with other elements,16 controlling its morphology,17 or applying catalysts on the surface of α-Fe2O3.18,19 The elemental doping of α-Fe2O3 uses a relatively simple procedure and has attracted much attention as a way to improve α-Fe2O3 performance by increasing its electronic conductivity and carrier life time.16,20–22 However, the use of rare metal dopants such as Pt, Si, and Ti and so on increases the overall price of the PEC cell. Alternatively, it has been reported that forming oxygen vacancies in semiconductors such as TiO2 and α-Fe2O3 by treatment with reducing agents could enhance the PEC performance by increasing the donor density. In particular, Fe2+ ions in α-Fe2O3 with oxygen vacancies could dramatically increase the conductivity of the α-Fe2O3via a polaron hopping mechanism.23
Controlling the nanostructure morphology of α-Fe2O3 has been another efficient way to overcome the disadvantages of α-Fe2O3 by increasing its surface area and reducing the path length of hole transport. For example, diverse morphologies of α-Fe2O3 such as mesoporous nanotubes/nanowires and three-dimensional nano-structures have exhibited much improved PEC performance compared to normal film type α-Fe2O3.24–26 Although the control of α-Fe2O3 morphology has produced highly enhanced performance, the fabrication process involves complex steps and the resulting particle sizes are above 50–80 nm which are still significantly larger than the 2–4 nm hole diffusion length.10,27 In this work, the fabrication of boric acid (H3BO3) treated α-Fe2O3 with optimized sizes using a cheap and broadly applicable hydrothermal growth method is reported. The dissociation constant of the [FeB(OH)4]2+ complex controls the rate of formation of β-FeOOH, and accounts for the final nanoporous morphology of α-Fe2O3 nanorods with ∼15 nm sized α-Fe2O3 nanodomains inside them. The nanoporous α-Fe2O3 exhibited a 1.7 times increase in PEC performance compared to optimized worm-like α-Fe2O3 at 1.23 V, versus a reversible hydrogen electrode (RHE), because of the enhanced surface area, increased donor density, and reduced recombination rate.
To elucidate the effect of H3BO3 treatment, X-ray photoelectron spectroscopy (XPS) and X-ray diffraction (XRD) data were acquired from pristine hematite (P-H), 5 wt% H3BO3 treated hematite (B5-H), 10 wt% H3BO3 treated hematite (B10-H) and 20 wt% H3BO3 treated hematite (B20-H), as shown in Fig. 1.
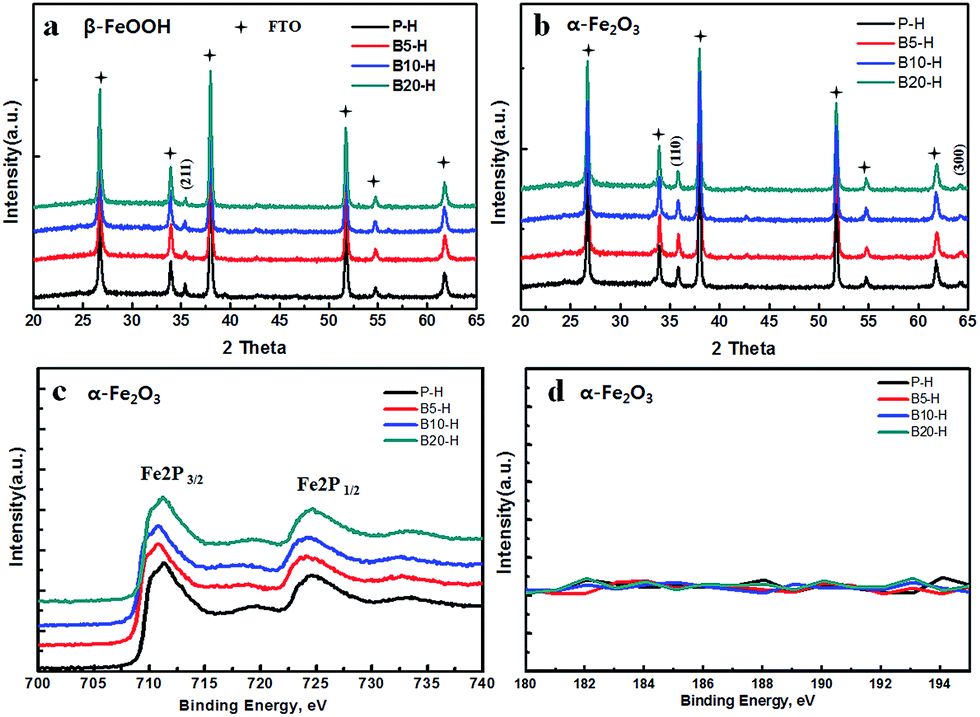 | ||
| Fig. 1 (a) XRD data of β-FeOOH, (b) XRD data of α-Fe2O3, (c) XPS of the Fe 2p peak of α-Fe2O3 in P-H, B5-H, B10-H and B20-H, and (d) XPS of B 1s. | ||
Pristine worm-like hematite was prepared via a two-step process (FeOOH formation at 10 °C overnight and subsequent conversion into Fe2O3via heat treatment at 550 °C for 1 h) as reported elsewhere.27 B5-H, B10-H, and B20-H were prepared by simply mixing the β-FeOOH precursor solution with 5 wt%, 10 wt% and 20 wt% of H3BO3 during the β-FeOOH formation process. The as-prepared β-FeOOH was annealed at 550 °C for the conversion into the corresponding α-Fe2O3. The XRD data of the as-synthesized β-FeOOH and α-Fe2O3 are shown in Fig. 1a and b. The diffraction patterns of both samples for P-H were well matched with the patterns of the reference β-FeOOH and α-Fe2O3 (JCPDS card no. 00-034-1266 and 01-075-5065, respectively), which is interestingly the same as with H3BO3 treated samples. The crystal lattice of α-Fe2O3 in the (110) direction (which is perpendicular to the fluorine doped tin oxide (FTO) substrate) has been known to play a key role in the transport of electrons.22 Importantly, all the H3BO3 treated samples in Fig. 1b show a similar peak intensity at 35.62°, which corresponds to the (110) plane of α-Fe2O3, indicating that the crystallinity of P-H had not deteriorated up to this amount of H3BO3 treatment.
The surface properties of H3BO3 treated samples were investigated using XPS analysis. Fig. 1c and d show the region of the binding energy of Fe 2p and B 1s, respectively. All of the samples in Fig. 1c showed clear Fe 2p3/2 peaks at around 711.0 eV and Fe 2p1/2 peaks at 725.0 eV, which confirms the formation of Fe3+ in α-Fe2O3. However, it should be noted that the B 1s peak at 190.1 eV was not detected for the H3BO3 treated samples (B5-H, B10-H, and B-20H), indicating that boron ions were not incorporated into the α-Fe2O3 lattices even after the H3BO3 treatment process (Fig. 1d). In addition, the conductivity, surface state and absorption spectra of the H3BO3 treated samples remain the same, indicating that H3BO3 does not affect the electric and optical properties of hematite as shown in Fig. S10–S12 (ESI†).
Fig. 2 shows the scanning electron microscopy (SEM) and transmission electron microscopy (TEM) images of α-Fe2O3 (P-H and B5-H) grown on the FTO substrate. The SEM images do not reveal great differences between the overall morphology of P-H and B5-H (5% H3BO3 treated hematite), in that both are composed of closely packed α-Fe2O3 nanorods with diameters of 60–80 nm and a height of 380–400 nm, except for the appearance of a slightly aggregated morphology in the B5-H sample. The inset images in Fig. 2a and b demonstrate the similar height of B5-H and P-H. However, the TEM image reveals a great difference in the morphologies of P-H and B5-H (Fig. 2c and d). Compared to the sharp and comb-patterned surface morphology of pristine P-H (Fig. 2c), B5-H (Fig. 2d) presents a nanoporous structure composed of smaller α-Fe2O3 nanodomains inside α-Fe2O3 nanorod. Such nanoporous hematite structures, with ∼15 nm sized α-Fe2O3 domains as shown in the inset of Fig. 2d, are more desirable in α-Fe2O3-based PEC systems where performance is greatly hampered by the short hole diffusion length of α-Fe2O3 (2–4 nm), because they provide easier and shorter pathways from the place where the holes are generated to the surface where the oxidation reactions occur.
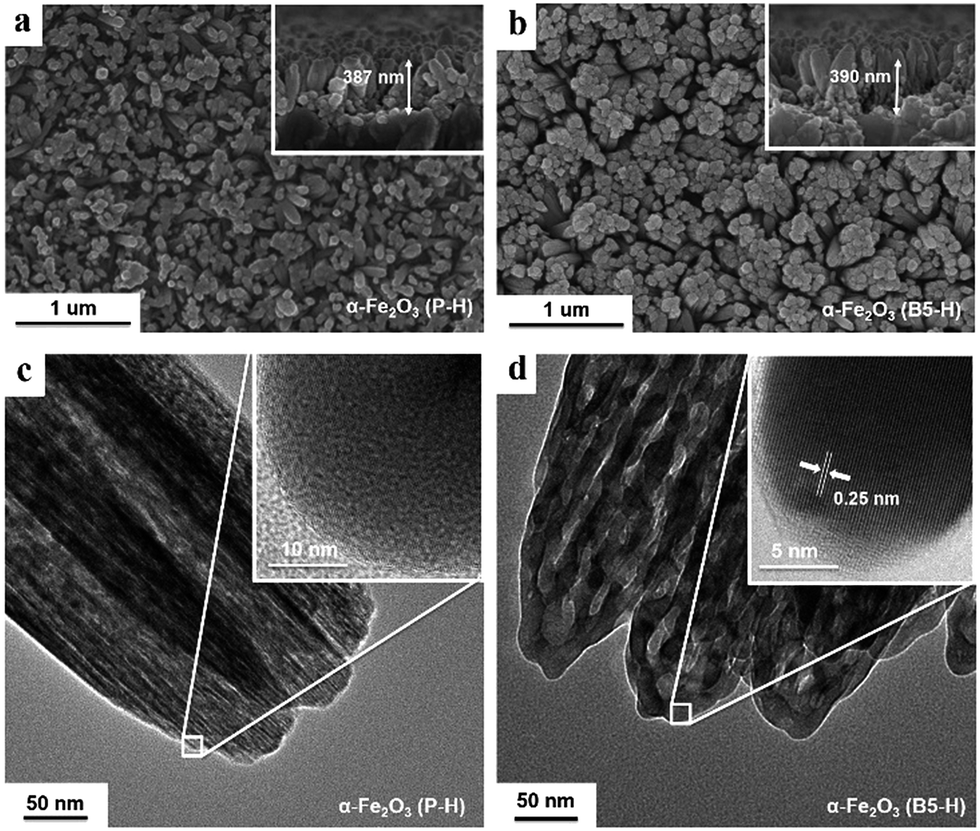 | ||
| Fig. 2 SEM images and TEM images of α-Fe2O3. (a) SEM image of P-H. (b) SEM image of B5-H; the insets in (a) and (b) are the cross-sectional images of α-Fe2O3. (c) TEM image of P-H. (d) TEM image of B5-H; the insets in (c) and (d) are the high resolution TEM images of P-H and B5-H. | ||
In addition, the nanoporous α-Fe2O3 structures found in B5-H ensure a larger number of reaction sites. The surface areas of P-H, B5-H, B10-H and B20-H, obtained by Brunauer–Emmett–Teller (BET) analysis, were 4.56 m2 g−1, 10.54 m2 g−1, 9.96 m2 g−1 and 3.10 m2 g−1, respectively (Fig. S4†). The surface area of H3BO3 treated α-Fe2O3 increased 2–3 times, was greatest for B5-H, and decreased with the increase of H3BO3 concentration. Because the average size of α-Fe2O3 nanorods of B20-H is larger than that of P-H as is clear in Fig. S3,† the surface area of B20-H is smaller than that of P-H. It is expected that the nanoporous features observed in H3BO3-treated samples (B5-H and B10-H) make it possible for a greater number of holes to participate in the oxidation reaction of water, with less recombination with excited electrons, because of the easy transfer of holes and a large number of active sites.
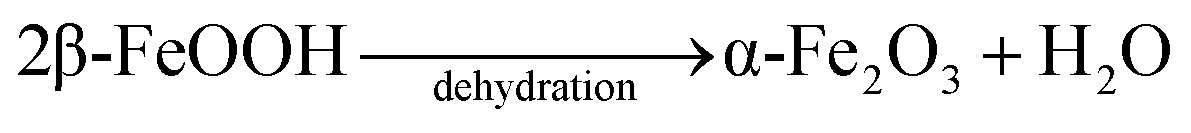
On the basis of TEM, Raman (Fig. S1†), XRD, conductivity (Fig. S10†), absorption spectra (Fig. S11†) and XPS of H3BO3 treated samples from this work, it was concluded that the H3BO3 is only involved in a specific step during the process of α-Fe2O3 formation, by assisting in the creation of nanoporous structures with more uniform morphology and optimized pore size. The mechanism responsible for the formation of nanoporous α-Fe2O3 after the H3BO3 treatment process can be assessed based on previous studies. It has been reported that α-Fe2O3 with a dendritic morphology could be fabricated with the help of intermediate [Fe(CN)6]3− ions, which were only involved in a step of the hydrothermal reaction of FeOOH formation. The [Fe(CN)6]3−, with a large formation constant of 1 × 1042, is decoupled very slowly into Fe3+ ions under the hydrothermal conditions.28 The sluggish release of Fe3+ ions slows down the rate of reactions between Fe3+ and H2O responsible for the formation of FeOOH, which is the precursor of the final dendritic α-Fe2O3. It is suggested that a similar process is possible when using [FeB(OH)4]2+ which has a formation constant of 3.4 × 10⁷ (at 25 °C).29 The relatively large formation constant value causes the formation of the stable [FeB(OH)4]2+ complex in the H3BO3 solution via the reaction of FeCl3·6H2O and H3BO3 (step 2). The slow release of Fe3+ ions from the [FeB(OH)4]2+ complex under hydrothermal conditions may lead to the creation of the thinner FeOOH nanorods because of the limited sources of Fe3+ in step 3. Here, it is suggested that the formation mechanism of H3BO3 treated samples is as follows. In the pure FeCl3·6H2O solution, FeOOH nanorods with diameters of 70–80 nm are formed in a short time when a sufficient amount of Fe3+ is present (Fig. 2c), as reported elsewhere (via step 3–4 in the following reaction scheme).28 However, in FeCl3·6H2O solutions with H3BO3, the slow release of Fe3+ ions limits the growth of FeOOH (via step 1–4), creating nanorods with 30–40 nm diameters, and reactions are immediately finished, as can be seen in Fig. S2b.† Then the neighboring 3–4 FeOOH nanorods are assembled/aggregated into larger nanorods under heat treatment conditions (550 °C), forming nanoporous α-Fe2O3 nanorods composed of much thinner 15 nm sized nanodomains after dehydration, by spatially confining the direction of assembly along the (110) direction, as shown in Fig. 2d. As a result, while α-Fe2O3 in the P-H retains the comb-like morphology of FeOOH after annealing at 550 °C, the much thinner comb-like morphology of FeOOH in B5-H is changed to a nanoporous and fused morphology during the high temperature annealing process (550 °C) for the conversion from FeOOH into α-Fe2O3,30 which is likely to be because of the lower melting point of the fine structure with smaller dimensions. However, when the concentration of H3BO3 is greater than 20%, the formation of FeOOH is activated again because a sufficient amount of Fe3+ is decoupled from the large amount of [FeB(OH)4]2+ complexes, creating larger domains (Fig. S2†), which is similar to the case of the pristine FeOOH. This results in the disappearance of the nanoporous structure in the final α-Fe2O3 morphology of B20-H, which can be explained by the TEM and BET data (Fig. S4 and S7†). The chemical reactions related to the formation of α-Fe2O3 are as follows:
| H3BO3 + 2H2O → [B(OH)4]−(aq) + H3O+(aq) | (1) |
| Fe3+(aq) + [B(OH)4]−(aq) ⇄ [FeB(OH)4]2+(aq) | (2) |
| Fe3+(aq) + 3H2O(aq) → Fe(OH)3 + 3H+(aq) | (3) |
| Fe(OH)3 → β-FeOOH + H2O | (4) |
 | (5) |
Fig. 3a displays the photocurrent–potential curves of pristine worm-like α-Fe2O3 and H3BO3 treated α-Fe2O3 under AM 1.5 (100 mW cm−2), with platinum mesh electrode, Ag/AgCl electrode and 1 M NaOH solution as the counter electrode, reference electrode, and electrolyte, respectively. Here α-Fe2O3 with enhanced crystallinity has been used, which was prepared by further heating of α-Fe2O3 at 800 °C for 20 min. The photocurrent density of P-H was 0.85 mA cm−2 at a bias of 1.23, versus RHE, which is of a similar value to an optimized worm-like hematite as reported elsewhere.10,27 On the contrary, H3BO3 treated samples showed a much improved photocurrent density with the B20-H sample being an exception. The maximum photocurrent density of 1.41 mA cm−2 at RHE 1.23 V, which represents a 1.7 times higher photocurrent density than the 0.85 mA cm−2 of P-H, was obtained from B5-H and this decreased with a further increase in H3BO3 concentration. The photocurrent density of B20-H was lower than that of P-H and was most likely to be because B20-H had a lower surface area than P-H. The higher photocurrent density of B5-H can be explained by the following three factors: (1) the short diffusion path produced by a much reduced domain size in the nanoporous B5-H nanorods; (2) enhanced surface area; (3) retention of high crystallinity along the (110) direction as confirmed by XRD data. All these factors contributed to reduced recombination and fast electron transport. Fig. 3b shows chronoamperometric time–current (I–T) curves of α-Fe2O3 and H3BO3 treated α-Fe2O3 measured at RHE 1.23 V in 1 M NaOH with a chopped illumination of AM 1.5 under 30 s exposure on/off cycles. A fast and constant response is observed in the photocurrent for both α-Fe2O3 and H3BO3 treated α-Fe2O3, indicating that all α-Fe2O3 are stable under the illumination conditions. The photocurrent density obtained in the I–T curves displays good agreement with the current–voltage characteristic (I–V) curves, as shown in Fig. 3a. Fig. 3c shows the incident photon-to-current efficiency (IPCE) for H3BO3 treated hematite and pristine hematite samples measured at an applied potential of RHE 1.5 V in a 1 M NaOH solution. The highest IPCE value is observed at 350 nm and the IPCE values decrease with increasing wavelength up to 700 nm for all the samples. The H3BO3 treated samples (B5-H and B10-H) show greater IPCE values than P-H (except for B20-H) with the best IPCE value being for sample B5-H, which matches the I–V curve. To investigate the charge transfer process at the α-Fe2O3-electrolyte interface, an electrochemical impedance spectroscopy (EIS) measurement was conducted. As shown in Fig. 3d, we obtained the EIS curve at a frequency range from 100 kHz to 0.1 Hz with a DC potential of 0.1 V under 1.5 AM in 1 M NaOH electrolyte. In the high frequency region, the contact resistance between hematite and the FTO substrate is represented as an onset point on the real axis (Rs). The radii of the low frequency region represent the interfacial charge transfer resistance (Rct).27,31 As shown in the inset of the Nyquist plots (Fig. 3d), B5-H has the same Rs value as P-H indicating that the large number of contacts between the small α-Fe2O3 domains inside B5-H and the FTO substrate do not increase the contact resistance. However, the Rct of B5-H is much smaller than that of P-H, which implies that the interfacial charge transfer resistance is greatly reduced. This smaller semicircle of B5-H in the low frequency region indicates that the diffusion of the electrolyte is not interrupted by the increased number of nanodomains in the porous structure. Because our XPS and XRD data of H3BO3 treated hematite do not show the presence of any dopant atom (Fig. 1), the enhanced charge transfer surely came from the reduced recombination, because of the fast transfer of both holes and electrons, which was possibly because of the favorable size of the α-Fe2O3 nanodomains in the nanoporous structure while retaining good crystallinity along the (110) direction in B5-H nanorods. This agrees well with the previous paper that reported that the porous α-Fe2O3 nanostructure facilitates hole transfer and thus, enhances the PEC performance.32 The electron lifetime measurement obtained from the decay of the transient open circuit potential and photodegradation of methylene blue also clearly support the reduced recombination mechanism as shown in Fig. S8b and S13.†
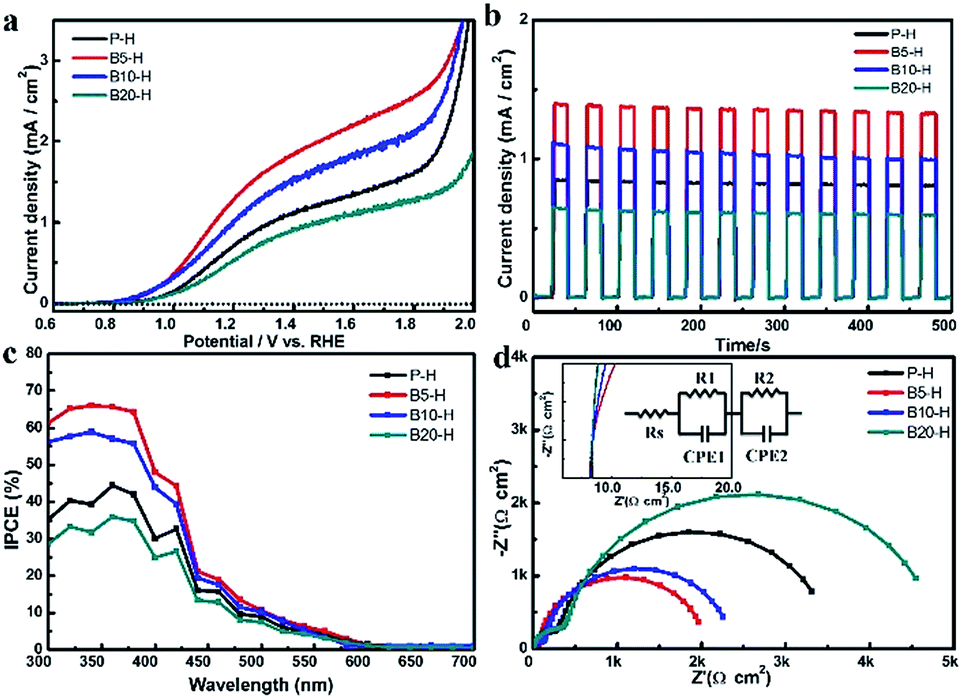 | ||
| Fig. 3 Photocurrent response of α-Fe2O3 and H3BO3 treated α-Fe2O3 under illumination of AM 1.5. (a) I–V curves. (b) I–T curves at RHE 1.23 V. (c) IPCE. (d) Nyquist plots. The inset graph is a magnification of the EIS graph to observe sheet resistance. The equivalent circuit for the EIS data fitting is added as the inset image. | ||
The Mott–Schottky plots shown in Fig. 4 further confirm that B5-H has much better performance than P-H because of the creation of nanoporous structures with smaller dimensions. The donor density (Nd) and flat band potential (EFB) were calculated from the following equation:33
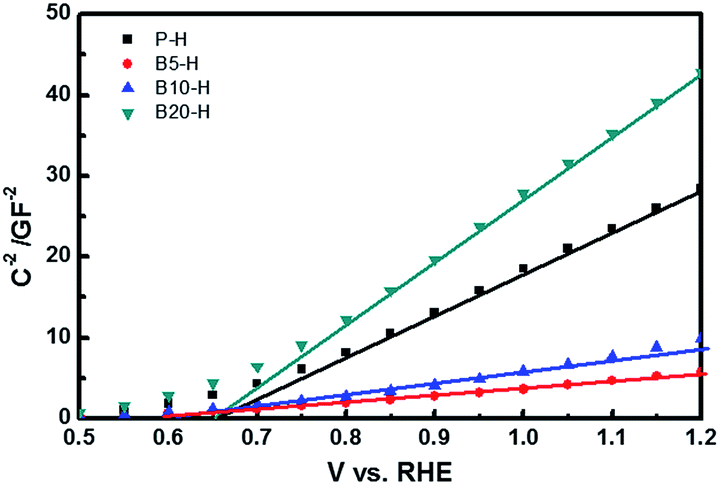 | ||
| Fig. 4 Mott–Schottky plot of the P-H, B5-H, B10-H and B20-H at the frequency of 10 kHz under dark condition. | ||
Conclusions
In conclusion, we propose a new type of α-Fe2O3 with a nanoporous structure, fabricated via a very simple hydrothermal growth method coupled with H3BO3 treatment, which exhibits greatly enhanced water splitting performance because of a decreased path distance for photogenerated hole transfer and a high surface area. The optimized nanoporous sample showed a photocurrent density of 1.41 mA cm−2 at RHE 1.23 V, which is 1.7 times higher than that of pristine α-Fe2O3. All the data, including IPCE, impedance data, and Mott–Schottky plots, clearly confirmed the superior performance of the nanoporous α-Fe2O3 sample. This experiment provides a straightforward route to solve the chronic problems of the short hole diffusion length of a cost-efficient α-Fe2O3 nanostructure.Acknowledgements
This work is supported by NRF with the Contract no. NRF-2010-0019408 and 2012-R1A1A2043076, and by the Startup Research Fund (1.090040.01) of UNIST.Notes and references
- K. Sivula, F. Le Formal and M. Grätzel, ChemSusChem, 2011, 4, 417 CrossRef.
- P. Thiyagarajan, H.-J. Ahn, J.-S. Lee, J.-C. Yoon and J.-H. Jang, Small, 2013, 9, 2202 CrossRef CAS.
- H.-J. Ahn, M.-J. Kim, K. Kim, M.-J. Kwak and J.-H. Jang, Small, 2014, 10, 2504 CrossRef.
- M. Gratzel, Nature, 2001, 414, 338–344 CrossRef CAS PubMed.
- J. Luo, S. K. Karuturi, L. Liu, L. T. Su, A. I. Y. Tok and H. J. Fan, Sci. Rep., 2012, 2, 451 Search PubMed.
- K. Kim, P. Thiyagarajan, H.-J. Ahn, S.-I. Kim and J.-H. Jang, Nanoscale, 2013, 5, 6254–6260 RSC.
- A. Fujishima and K. Honda, Nature, 1972, 238, 37–38 CrossRef CAS.
- M. D. Hernandez-Alonso, F. Fresno, S. Suarez and J. M. Coronado, Energy Environ. Sci., 2009, 2, 1231–1257 CAS.
- K. Sivula, R. Zboril, F. Le Formal, R. Robert, A. Weidenkaff, J. Tucek, J. Frydrych and M. Grätzel, J. Am. Chem. Soc., 2010, 132, 7436–7444 CrossRef CAS PubMed.
- Y. Ling, G. Wang, D. A. Wheeler, J. Z. Zhang and Y. Li, Nano Lett., 2011, 11, 2119–2125 CrossRef CAS PubMed.
- O. Khaselev and J. A. Turner, Science, 1998, 280, 425–427 CrossRef CAS.
- F. J. Morin, Phys. Rev., 1951, 83, 1005–1010 CrossRef CAS.
- J. A. Glasscock, P. R. F. Barnes, I. C. Plumb and N. Savvides, J. Phys. Chem. C, 2007, 111, 16477–16488 CAS.
- M. Barroso, S. R. Pendlebury, A. J. Cowan and J. R. Durrant, Chem. Sci., 2013, 4, 2724–2734 RSC.
- M. P. Dare-Edwards, J. B. Goodenough, A. Hamnett and P. R. Trevellick, J. Chem. Soc., Faraday Trans. 1, 1983, 79, 2027–2041 RSC.
- Y.-S. Hu, A. Kleiman-Shwarsctein, A. J. Forman, D. Hazen, J.-N. Park and E. W. McFarland, Chem. Mater., 2008, 20, 3803–3805 CrossRef CAS.
- X. Shi, K. Zhang, K. Shin, J. H. Moon, T.-W. Lee and J. H. Park, Phys. Chem. Chem. Phys., 2013, 15, 11717–11722 RSC.
- B. Klahr, S. Gimenez, F. Fabregat-Santiago, J. Bisquert and T. W. Hamann, J. Am. Chem. Soc., 2012, 134, 16693–16700 CrossRef CAS PubMed.
- Y. Hou, F. Zuo, A. Dagg and P. Feng, Nano Lett., 2012, 12, 6464–6473 CrossRef CAS PubMed.
- M. Zhang, W. Luo, Z. Li, T. Yu and Z. Zou, Appl. Phys. Lett., 2010, 97, 042105 CrossRef PubMed.
- R. Franking, L. Li, M. A. Lukowski, F. Meng, Y. Tan, R. J. Hamers and S. Jin, Energy Environ. Sci., 2013, 6, 500–512 CAS.
- A. Kay, I. Cesar and M. Grätzel, J. Am. Chem. Soc., 2006, 128, 15714–15721 CrossRef CAS PubMed.
- Y. Ling, G. Wang, J. Reddy, C. Wang, J. Z. Zhang and Y. Li, Angew. Chem., Int. Ed., 2012, 51, 4074–4079 CrossRef CAS PubMed.
- J. Brillet, M. Grätzel and K. Sivula, Nano Lett., 2010, 10, 4155–4160 CrossRef CAS PubMed.
- R. Morrish, M. Rahman, J. M. D. MacElroy and C. A. Wolden, ChemSusChem, 2011, 4, 474–479 CrossRef CAS PubMed.
- A. Mao, K. Shin, J. K. Kim, D. H. Wang, G. Y. Han and J. H. Park, ACS Appl. Mater. Interfaces, 2011, 3, 1852–1858 CAS.
- J. Y. Kim, G. Magesh, D. H. Youn, J.-W. Jang, J. Kubota, K. Domen and J. S. Lee, Sci. Rep., 2013, 3, 2681 Search PubMed.
- M. H. Cao, T. F. Liu, S. Gao, G. B. Sun, X. L. Wu, C. W. Hu and Z. L. Wang, Angew. Chem., Int. Ed., 2005, 44, 4197–4201 CrossRef CAS PubMed.
- R. H. Byrne and S. W. Thompson, J. Solution Chem., 1997, 26, 729–734 CrossRef CAS.
- M. P. Pomies, M. Menu and C. Vignaud, J. Eur. Ceram. Soc., 1999, 19, 1605–1614 CrossRef CAS.
- D. Cao, W. Luo, J. Feng, X. Zhao, Z. Li and Z. Zou, Energy Environ. Sci., 2014, 7, 752–759 CAS.
- H. Jun, B. Im, J. Y. Kim, Y.-O. Im, J.-W. Jang, E. S. Kim, J. Y. Kim, H. J. Kang, S. J. Hong and J. S. Lee, Energy Environ. Sci., 2012, 5, 6375–6382 CAS.
- W.-D. Zhang, L.-C. Jiang and J.-S. Ye, J. Phys. Chem. C, 2009, 113, 16247–16253 CAS.
- I. Cesar, K. Sivula, A. Kay, R. Zboril and M. Grätzel, J. Phys. Chem. C, 2008, 113, 772–782 Search PubMed.
Footnote |
| † Electronic supplementary information (ESI) available. See DOI: 10.1039/c4ta04890c |
| This journal is © The Royal Society of Chemistry 2014 |