
 Open Access Article
 This Open Access Article is licensed under a
 Creative Commons Attribution 3.0 Unported Licence
Synthesis of iron selenide nanocrystals and thin films from bis(tetraisopropyldiselenoimidodiphosphinato)iron(II) and bis(tetraphenyldiselenoimidodiphosphinato)iron(II) complexes†
Masood
Akhtar
ac,
Mohammad Azad
Malik
*bc,
James
Raftery
a and
Paul
O'Brien
ab
aSchool of Chemistry, The University of Manchester, Manchester, UK. E-mail: paul.obrien@manchester.ac.uk
bSchool of Materials, The University of Manchester, Manchester, UK. E-mail: Azad.malik@manchester.ac.uk
cDepartment of Chemistry, University of Zululand, South Africa
First published on 15th October 2014
Abstract
Iron selenide nanocrystals (NCs) were synthesised by the thermolysis of single molecular precursors, bis(tetraisopropyldiselenoimidodiphosphinato)iron(II) (3) and bis(tetraphenyldiselenoimidodiphosphinato)iron(II) (4) in oleylamine and hexadecylamine at different growth temperatures. TEM images of the NCs showed the rod and plate-like crystallites. Both complexes were also used for the deposition of thin films by Aerosol Assisted Chemical Vapour Deposition (AACVD) onto silicon substrates. SEM images of thin films deposited from complex (3) and (4) showed significantly different morphologies under similar conditions. X-ray single crystal structures of complexes [Fe{(SePPh2)2N}2] (4) and [(SePPh2)2N)–O–(SePPh2)2N)] (5) were also determined.
Introduction
Iron chalcogenides are important materials due to their tunable optical, electrical, conductive and magnetic properties.1–4 Among the iron chalcogenides, iron selenide is of particular interest due to its narrow band-gap (Eg = 1.0 eV), high absorption coefficient (>105 cm−1) and potential for application in solar cells; due to these characteristics FeSe2 is considered as an alternative to Si.5–8 Iron selenides can also be semiconductors, or even superconductors with characteristics of ferro/ferrimagnetic metals depending on the composition and phase.9–11Different synthetic methods, including elemental reaction in evacuated tubes at elevated temperature,12,13 from aqueous metal salt solutions with gas H2Se14,15 and mechanical alloying,16,17 have been used for the synthesis of iron selenide but it is hard to get the phase pure material using these methods.
Nanocrystals of iron selenide were synthesized in one-pot by thermal decomposition of ferrous chloride and selenium powder in oleylamine.18 Gao et al.19 reported the synthesis of Fe7Se8 polyhedra and Fe7Se8 nanorods in diethylenetriamine (DETA) and deionized water (DIW). Nanorods of iron selenide (FeSe2) also have been synthesized by the hydrothermal co-reduction method using N2H4·H2O as the reductant.20 Luan's group5 reported the flower-like FeSe2 particles by a solvothermal method using oleylamine (solvent), ferric oxide (iron source), and selenium powder. Flower-like FeSe2 particles that have more ‘petals’ than Luan's particles were reported by Liang et al.21 These micro-nano hierarchical structures make the FeSe2 particles more super hydrophobic.
Zeng et al.22 prepared size tuneable iron selenide (Fe3Se4) nanostructures by the one-pot high-temperature organic-solution-phase method. The size of these materials can be tuned from 50 to 500 nm. The shapes of the nanostructures varied from nanosheets and nanocacti, to nanoplates. These structures have hard magnetic properties, with large coercivity values upto 40 KOe at 10 K and 40 KOe at room temperature. The magnetic properties of iron selenide nanostructures can be tuned by doping with other transition metal elements such as cobalt.22 Fang et al.23 reported regular square FeSex nanoflakes with tetragonal PbO-type structures prepared from ferrous chloride and selenium trioctyl phosphine. There were no reports in the literature for synthesis of iron selenide nanoparticles or thin films from single source precursors until our recent report using the tris(N,N-diethyl-N′-naphthoylselenoureato)iron(III) complex for the colloidal synthesis of FeSe nanoparticles and thin films by AACVD.3
We now report the synthesis of novel single source precursors, bis(tetraisopropyldiselenoimidodiphosphinato)iron(II) (3) and bis(tetraphenyldiselenoimidodiphosphinato)iron(II) (4), their X-ray single crystal structure determination and their use in the preparation of iron selenide nanocrystals in oleylamine and hexadecylamine and deposition of thin films by Aerosol Assisted Chemical Vapour Deposition (AACVD) onto silicon substrates. Also the films were deposited at much lower temperatures from these precursors as compared to those reported previously by us using tris(N,N-diethyl-N′-naphthoylselenoureato)iron(III).3
Experimental
All synthesis was performed under an inert atmosphere of dry nitrogen using standard Schlenk techniques. All reagents were purchased from Sigma-Aldrich and used as received. Solvents were distilled prior to use.Elemental analysis was performed by the University of Manchester micro-analytical laboratory. TGA measurements were carried out by using a Seiko SSC/S200 model under a heating rate of 10 °C min−1 under nitrogen. Mass spectra were recorded on a Kratos concept 1S instrument. Infrared spectra were recorded on a Specac single reflectance ATR instrument (4000–400 cm−1, resolution 4 cm−1). Melting points were recorded on the Barloworld SMP10 Melting Point Apparatus. XRD studies were performed on a Bruker AXSD8 diffractometer using CuKα radiation. The samples were mounted flat and scanned between 20 and 70° in a step size of 0.05 with a varying count rate depending upon the sample. TEM images were collected on a Philips CM200 transmission electron microscope using an accelerating voltage 200 kV. TEM samples were prepared by evaporating a drop of dilute suspension of the sample in toluene or hexane on a carbon coated copper grid. The excess solvent was allowed to dry completely at room temperature. Some images were also collected on a Teccnai microscope using an accelerating voltage of 300 kV. X-ray single-crystal diffraction data for the complexes (4) and (5) were collected on a Bruker APEX diffractometer by using graphite monochromated Mo-Ka radiation (λ = 0.71073 Å). Both structures were solved by direct methods and refined by full-matrix least squares24 on F2. All of non-H atoms were refined anisotropically. Hydrogen atoms were included in calculated positions, assigned isotropic thermal parameters and allowed to ride on their parent carbon atoms. All calculations were carried out by using the SHELXTL package.25
Synthesis of ligands
The preparation of the ligand was carried out by a modification of the method reported in the literature.26Synthesis of the imido(tetradiisopropyldiselenodiphosphinate) ligand [(SePiPr2)2N] (1)
A solution of diisopropylphosphine chloride (10 ml 62.84 mmol) dissolved in toluene (25 ml) was added dropwise into the solution of hexamethyldisilazane (6.5 ml 31.42 mmol) in dry toluene (25 ml) in 30 minutes at 50 °C. The reaction mixture was heated at 50 °C whilst stirring for 3 hours. After 3 hours add 4.96 g (62.84 mmol) of selenium powder and increase the temperature to 100 °C and reflux for 6 hours. The reaction mixture was cooled overnight, filtered, and washed with DCM and diethyl ether several times. The product was recrystallized in DCM. Yield: 6.9 g (39%), mpt: 172–184 °C. Elemental analysis: calculated for C12H28NP2Se2: C, 35.39; H, 7.18; N, 3.44; P, 15.21%. Found: C, 35.42; H, 7.57; N, 3.35; P, 15.13%.Synthesis of the imido(tetradiphenyldiselnodiphosphanate) ligand [(SePPh2)2N] (2)
The same procedure was adopted for the preparation of the diphenyldiselnodiphosphanate ligand as we used for the preparation of the diisopropyldiselnodiphosphanate ligand. Yield: 6.3 g (43%), mpt: 213–221 °C. Elemental analysis: calculated for C24H21NP2Se2: C, 53.04; H, 3.90; N, 2.58; P, 11.40%. Found: C, 53.11; H, 3.59; N, 2.54; P, 11.32%.Synthesis of bis(tetraisopropyldiselenoimidodiphosphinato)-iron(II) [Fe{(SePiPr2)2N}2] (3)
The imido(tetradiisopropyldiselnodiphosphanate) ligand (5.0 g, 3.92 mmol) and sodium methoxide (0.06 g, 1.11 mmol) were dissolved in dry methanol (30 ml). The mixture was stirred under nitrogen for 20 minutes at room temperature. A methanolic solution of FeCl3 (0.063 g, 0.388 mmol in 20 ml methanol) or FeCl2 was added dropwise in to the above solution. After stirring for 2 hours the resulting solution was filtered and recrystallized in chloroform. mpt: 132–140 °C. Elemental analysis: calc.: C, 33.17; H, 6.45; N, 3.22; P, 14.27; Fe, 6.4, found: C, 32.77; H, 6.63; N, 3.15; P, 13.60; Fe, 6.6, %. IR (vmax/cm−1): 2961(s), 1459(s), 1382(s), 1226(s), 1026(s), 883(s), 761(s), 624(s), mass (m/z): 724, 404, and 360.Synthesis of bis(tetraphenyldiselenoimidodiphosphinato)-iron(II) [Fe{(SePPh2)2N}2] (4)
A similar procedure was adopted for the synthesis of complex (4) as used for complex (3). The deep brown crude product was recrystallized from chloroform to give brownish crystals in a pale yellow solvent. The solvent was separated by decanting. The slow evaporation of the decant solvent gave white transparent crystals which were determined by X-ray crystallography. The brownish crystals were analysed by elemental analysis, IR, Mass spectroscopy and X-ray crystallography. mpt: 218–232 °C. Elemental analysis: calc.: C, 50.50; H, 3.50; N, 2.4; P, 11.86; Fe, 4.9 found: C, 49.31; H, 3.11; N, 2.33; P, 10.35; Fe, 4.9, %. IR (vmax/cm−1): 2983(s), 1434(s), 1322(s), 1100(s), 914(s), 736(s), 618(s), mass (m/z): 862, 480, and 400.Synthesis of iron selenide nanocrystals
Iron selenide nanocrystals were synthesized by thermolysis of the imido complexes in oleylamine. In a typical reaction, 10 ml of oleylamine was heated at 90 °C for 10 minutes under vacuum in a three necked round bottom flask and then purged with nitrogen gas for 5 minutes. Then 0.3 g (0.23 mmol) of complex (3) was added in to the hot oleylamine and the reaction temperature was slowly increased to 290 °C. After maintaining the temperature for 5 minutes the heating was stopped and the mixture was allowed to cool at room temperature. Addition of 20 ml acetone produced a black precipitate which was centrifuged, washed twice with acetone to remove any excess ligand. Black nanocrystals were resuspended in toluene for further investigation.Deposition of thin films
The complexes (3) and (4) were also used as single source precursors for the deposition of iron selenide thin films by Aerosol Assisted Chemical Vapour Deposition (AACVD) onto the silicon substrate at 500, 550 and 600 °C.In a typical deposition, 0.5 g (4.38 mmol) of the precursor was dissolved in 15 ml of tetrahydrofuran (THF) in a two-necked 100 ml round-bottomed flask with a gas inlet that allowed the carrier gas (argon) to pass into the solution to aid the transport of aerosol. This flask was connected to the reactor tube by a piece of reinforced tubing. The argon flow rate was controlled by a Platon flow gauge. Five silicon substrates were placed inside the reactor tube, which was then placed in a Carbolite furnace. The precursor solution in a round-bottomed flask was kept in a water bath above the piezoelectric modulator of a Pifco ultrasonic humidifier (model 1077). The aerosol droplets of the precursor thus generated were transferred into the hot wall zone of the reactor by a carrier gas. Both the solvent and the precursor were evaporated, and the precursor vapor reached the heated substrate surface where a thin film was deposited at 500–600 °C.
Results and discussion
The complex (4) was synthesized by the reaction of anhydrous iron(III) chloride with the corresponding ligand in dry methanol. The crude product was recrystallized from chloroform to give brownish cubic crystals in a pale yellow solvent and was separated by decanting the solvent. The decanted solution gave transparent white crystals by slow evaporation at room temperature. The first crop of brownish crystals was the major product and was identified as bis(tetraphenyldiselenoimidodiphosphinato)iron(II) by elemental analysis and X-ray single crystal structure determination. A second crop of white transparent crystals was the minor product and was identified as ((SePPh2)2N)–O–((SePPh2)2N) (5) by elemental analysis and the X-ray structure.The reaction of one mole of iron(III) with three moles of ligand might have been expected to form tris(tetraphenyldiselenoimidodiphosphinato)iron(III) but gave bis(tetraphenyldiselenoimidodiphosphinato)iron(II). This confirms our previous work on this complex.27 The second product which was not isolated in previous work gives better insight in to the reaction. Oxygen reacts with (Schlenk conditions may not be good) the ligands in presence of iron(III) to give RP-O-PR and 2Se2 species while the reducing iron(III) to iron(II) complex as shown in the eqn (1).
 | (1) |
Both the reactions of ([(SePiPr2)2N] or [(SePPh2)2N] with Fe(III) chloride) always produced iron(II) complexes. A literature search also revealed another similar iron(II) structure28 for the corresponding sulfur ligand with methyl substitute.
X-ray single crystal structure of [Fe{(SePPh2)2N}2] (4)
The X-ray single crystal structure of the [Fe{(SePPh2)2N}2] (4) structure (Fig. 1 (ESI†)) is based on a monomer where the geometry around iron is close to tetrahedral. Each iron atom is bonded to four selenium atoms from the two ligands. Iron(II) has a wide range of coordination geometries and spin-states. At the high spin state iron(II) has 4 unpaired electrons with the d6 configuration which consists of t42g eg2 in octahedral geometry, and with a coordination number of four, which makes it possible to have a tetrahedral geometry. However at the octahedral low spin states, iron(II) is diamagnetic consisting of t2g6, with no unpaired electron and a coordination number of six and being able to have an octahedral geometry.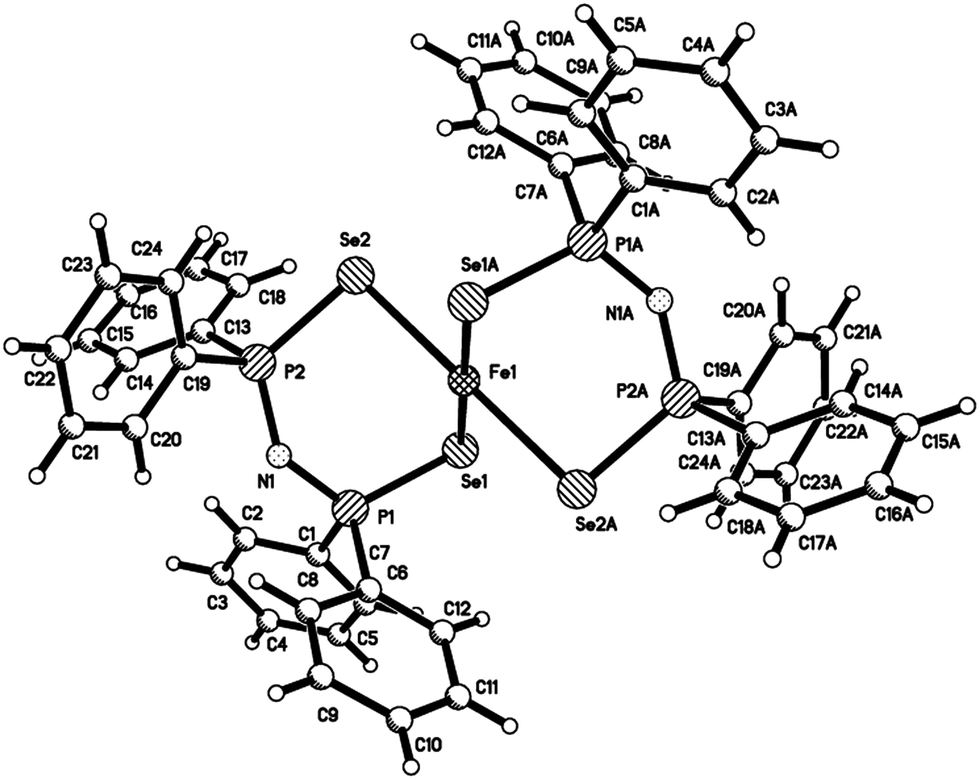 | ||
| Fig. 1 X-ray single crystal structure of [Fe{(SePPh2)2N}2], selected bond lengths (Å) and bond angles (°): Fe(1)–Se(2) 2.6369(7), Fe(1)–Se(1) 2.6736(8), N(1)–P(1) 1.578(6), N(1)–P(2) 1.583(6), N(2)–P(4) 1.595(5), N(2)–P(3) 1.593(5), P(1)–Se(1) 2.1669(18), P(2)–Se(2) 2.1800(18), P(3)–Se(3), 2.1720(16), P(4)–Se(4) 2.1717(16), Se(2)–Fe(1)–Se(1) 88.38(3), Se(3)–Fe(2)–Se(4) 88.61(2), P(1)–Se(1)–Fe(1) 88.28(5), P(2)–Se(2)–Fe(1) 95.91(5). | ||
Both iron(II) and iron(III) have two choices for the spin state based on how the splitting energy (Δ) compares with the electron pairing energy (Δ). More electron-pairing energy is required to put two electrons into the same lower orbital than the splitting energy to raise one electron into an upper orbital. As a result the complex has the highest possible number of electrons.
The ligands sit diagonally across the cube faces from each other in tetrahedral complexes. The t2 orbitals point closer to the ligands and are therefore more unfavourable places for electrons to occupy as compared to the eg.
X-ray single crystal structure of [((SePPh2)2N)–O–((SePPh2)2N)] (5)
The X-ray single crystal structure of the [((SePPh2)2N)–O–((SePPh2)2N)] (5) structure (Fig. 2 (ESI†)) shows that two ligands attached with oxygen atoms via phosphorus atoms. The bond lengths between the oxygen and phosphorus atoms are 1.61 Å which is close to those reported in phosphates.29 There are no unusual bond lengths or angles in this structure to discuss but the determination of this structure helped to understand the mechanism of this reaction. The crystallographic refinement data for both crystal structures are given in Table 1. | ||
| Fig. 2 X-ray single crystal structure of [((SePPh2)2N)–O–((SePPh2)2N)], selected bond lengths (Å) and angles (°): N(1)–P(2) 1.5517(12), N(1)–P(1) 1.6200(12), P(1)–Se(1) 2.1165(4), P(2)–O(1) 1.6175(6), P(2)–N(1)–P(1) 135.32(8), N(1)–P(1)–C(7) 104.81(6), N(1)–P(1)–C(1) 104.68(6), C(7)–P(1)–C(1) 104.29(6), N(1)–P(1)–Se(1) 118.28(4), C(7)–P(1)–Se(1) 111.55(5), C(1)–P(1)–Se(1) 112.02(5), N(1)–P(2)–O(1) 115.18(5), N(1)–P(2)–C(13) 107.09(6), O(1)–P(2)–C(13) 106.68(6), N(1)–P(2)–C(19) 116.66(6), O(1)–P(2)–C(19) 99.82(6), C(13)–P(2)–C(19) 110.98(6). | ||
| Empirical formula | C48H40FeN2P4Se4 | C49H42.28Cl1.45N2.28OP4Se2 |
|---|---|---|
| Formula weight | 1140.39 | 1015.48 |
| Crystal system and space group | Triclinic, ![[P with combining macron]](https://www.rsc.org/images/entities/i_char_0050_0304.gif) 1 1 |
Monoclinic, C2/c |
| Unit cell dimensions | a = 10.0919(5) Å, b = 12.9751(6) Å, c = 18.0953(8) Å, Alpha = 89.75(3) deg., beta = 82.344(2) deg., gamma = 77.98(2) deg. | a = 10.7461(2) Å, b = 20.0351(4) Å, c = 21.4593(4) Å, alpha = 90 deg., beta = 92.3890(10) deg., gamma = 90 deg. |
| Volume | 2296.25(19) A3 | 4616.15(15) A3 |
| Z, calculated density | 2, 1.649 Mg m−3 | 4, 1.461 Mg m−3 |
| Absorption coefficient | 7.857 mm−1 | 4.395 mm−1 |
| Crystal size | 0.17 × 0.15 × 0.13 mm | 0.22 × 0.19 × 0.17 mm |
| Theta range for data collection | 4.52 to 68.54 deg. | 4.12 to 72.39 deg. |
| Data/restraints/parameters | 7985/0/535 | 4468/2/273 |
| Goodness-of-fit on F2 | 1.565 | 1.063 |
| Final R indices [I > 2sigma(I)] | R 1 = 0.0589, wR2 = 0.1703 | R 1 = 0.0283, wR2 = 0.0737 |
| R indices (all data) | R 1 = 0.0661, wR2 = 0.1781 | R 1 = 0.0317, wR2 = 0.0757 |
| Largest diff. peak and hole | 5.157 and −0.839 e A−3 | 0.926 and −0.743 e A−3 |
| Reflection collected/unique | 14![[thin space (1/6-em)]](https://www.rsc.org/images/entities/char_2009.gif) 524/7985 [R(int) = 0.0376] 524/7985 [R(int) = 0.0376] |
14593/4468 [R(int) = 0.0315] |
| Limiting indices | −10 ≤ h ≤ 12, −14 ≤ k ≤ 15, −21 ≤ l ≤ 21 | −13 ≤ h ≤ 13, −20 ≤ k ≤ 24, −26 ≤ l ≤ 26 |
Thermogravimetric analysis
A two step decomposition (Fig. 3(a)) with rapid weight loss between 200 and 360 °C and 360 and 460 °C was observed by thermogravimetric analysis of the complex bis(tetraisopropyldiselenoimidodiphosphinato)iron(II). The final residue value (10.2%) is close to the calculated value (10.6%) for FeSe. A single step decomposition (Fig. 3(b)) with major loss between 250 and 610 °C was observed from complex bis(tetradiphenyldiselenoimidodiphosphinato)iron(II).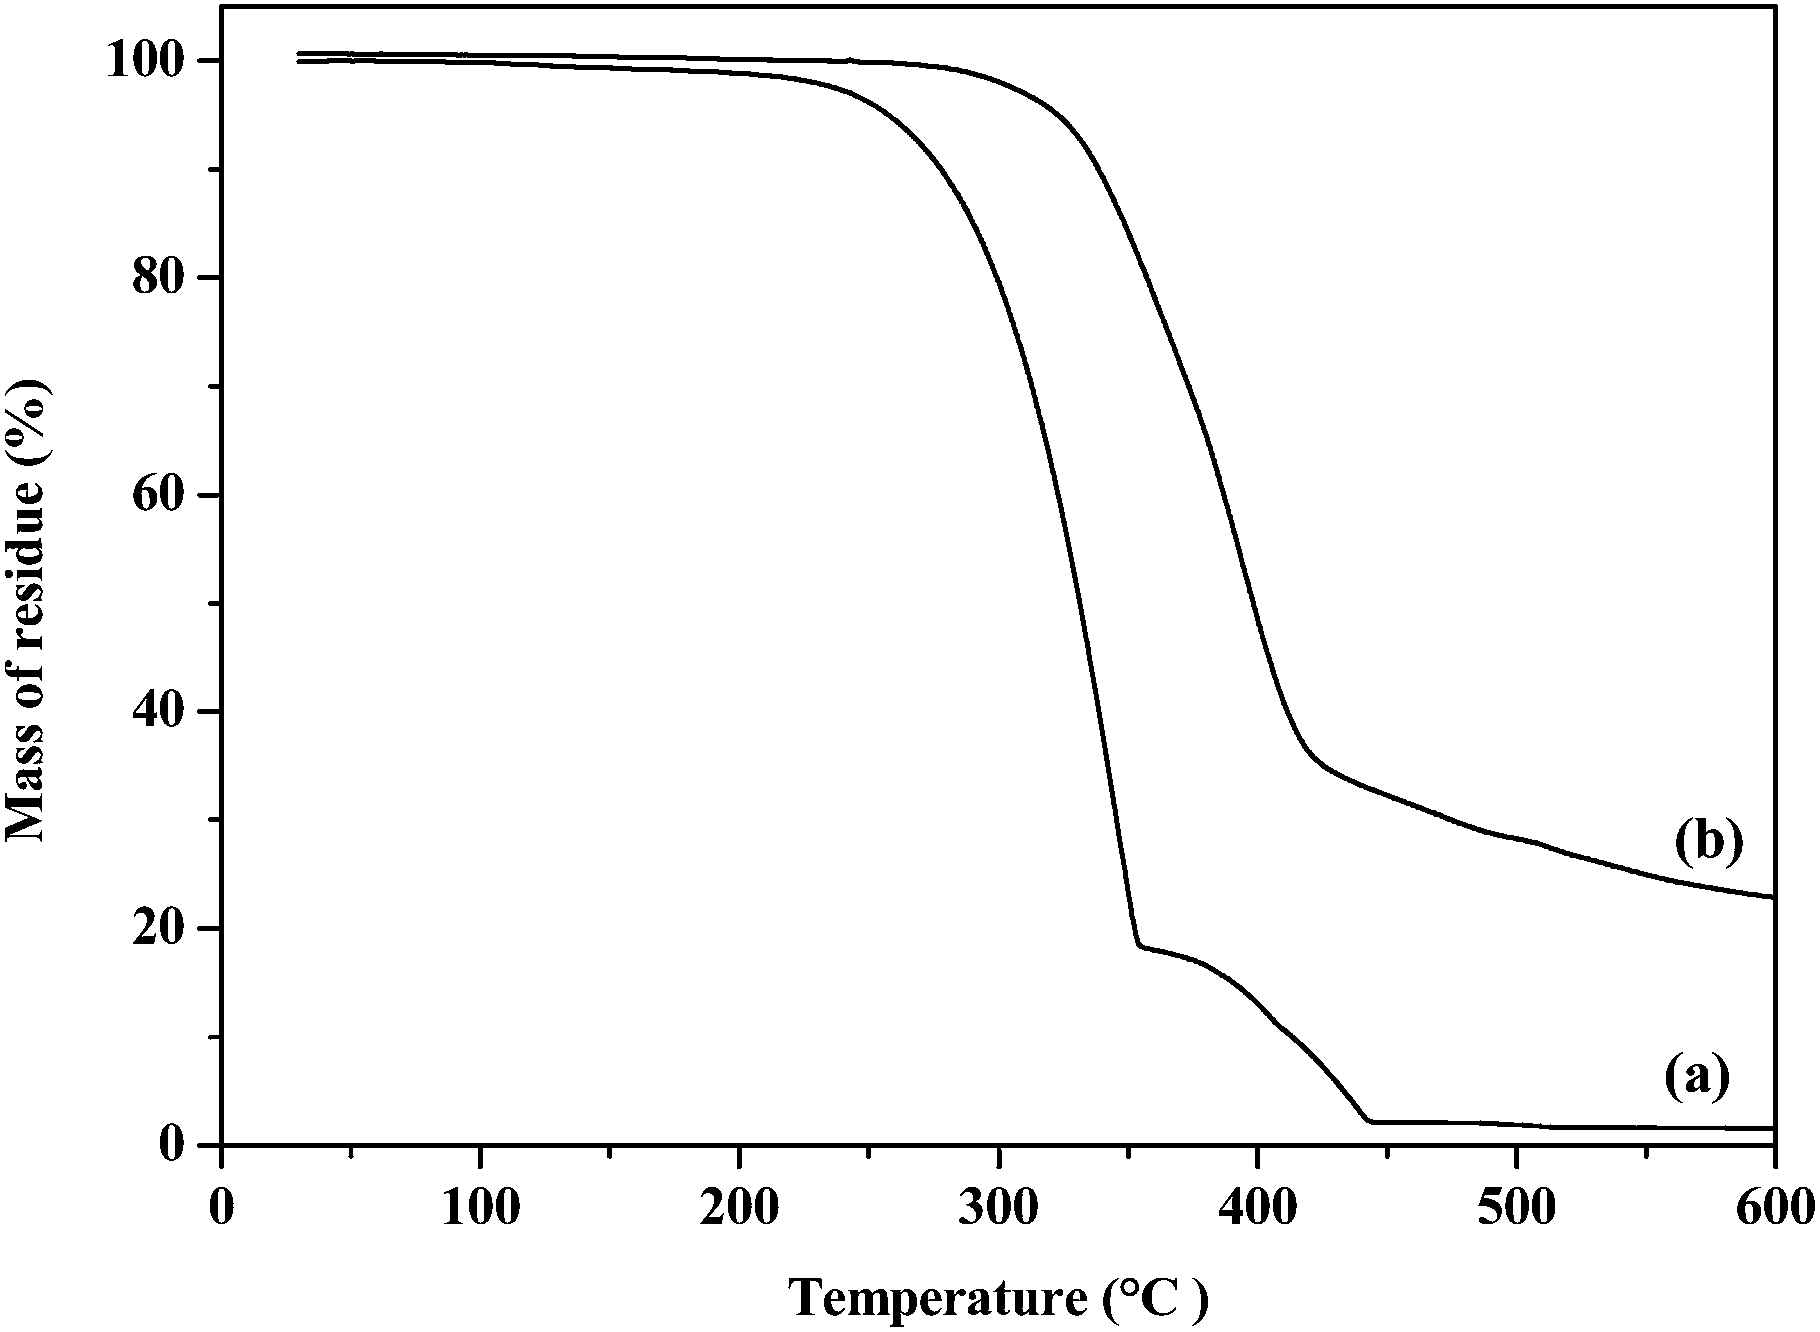 | ||
| Fig. 3 Thermogravimetric analysis of complexes (a) [Fe{(SePiPr2)2N}2] (3) and (b) [Fe{(SePPh2)2N}2] (4). | ||
The final residue value (22.1%) is considerably higher than the calculated value (12.7%) for FeSe2 and also significantly lower than the calculated value (28.63%) for Fe3Se4.
Powder X-ray diffraction for iron selenide nanocrystals
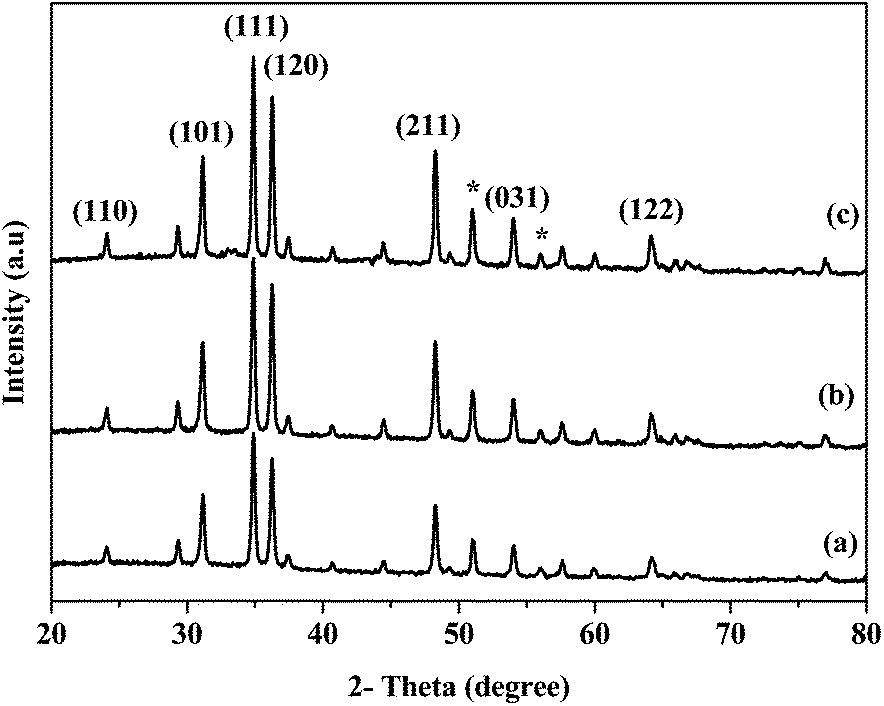
The nanocrystals of iron selenide obtained by the thermolysis of complexes [Fe{(SePiPr2)2N}2] (3) and [Fe{(SePPh2)2N}2] (4) in oleylamine at various temperatures (190, 240 and 290 °C) were analysed by p-XRD, TEM and HRTEM. The p-XRD pattern (Fig. 4(a–c)) of the nanocrystals obtained at (a) 190, (b) 240 and (c) 290 °C from bis(tetraisopropyldiselenoimidodiphosphinato)iron(II) (3) corresponds to orthorhombic ferroselite (FeSe2) (ICDD no.: 00-021-0432) with a small contamination of another orthorhombic ferroselite (FeSe2) (ICDD no.: 01-074-0247). | ||
| Fig. 4 p-XRD pattern for ferroselite (FeSe2) nanocrystals in oleylamine from complex [Fe{(SePiPr2)2N}2 (3) at (a) 190, (b) 240 and (c) 290 °C respectively. Whereas symbol * shows another ferroselite (FeSe2) phase. | ||
At all growth temperatures the diffraction peaks for (110), (101), (111), (120), (211), (031), and (122) planes of orthorhombic ferroselite (FeSe2) (ICDD no.: 00-021-0432) were dominant. Very low intensity peaks corresponding to the orthorhombic ferroselite ((*) (FeSe2) with the same space group but with different space parameters also with different ICDD numbers (ICDD no.: 01-074-0247)) were observed. The intensity of the peaks (Fig. 4) increases as the reaction temperature rises, which shows the temperature dependence of nanocrystals formation. At the highest temperature (290 °C) the intensity of the diffraction peaks was high which confirms the growth of crystallites is temperature dependent.
The p-XRD pattern for the nanocrystals obtained from the thermolysis of complex ([Fe{(SePPh2)2N}2]) (4) in oleylamine at different growth temperatures (190, 240 and 290 °C) shows similar behaviour to the complex (3) (Fig. 5(a–c)).
 | ||
| Fig. 5 p-XRD pattern for ferroselite (FeSe2) (ICDD no.: 00-021-0432) nanocrystals in oleylamine from complex ([Fe{(SePPh2)2N}2]) (4) at (a) 190, (b) 240 and (c) 290 °C respectively. Whereas symbol * denotes the ferroselite (FeSe2) (ICDD no.: 01-074-0247) phase. | ||
Transmission electron microscopy of iron selenide nanocrystals
TEM analysis shows rod and plate-like morphologies for the ferroselite (FeSe2) nanocrystals produced from the thermolysis of complexes (3) and (4) in oleylamine at different growth temperatures (190, 240 and 290 °C). The TEM images (Fig. 6(a)) of the iron selenide nanocrystals obtained from complex [Fe{(SePiPr2)2N}2] (3) in oleylamine at 190 °C show rod-like crystallites. At 240 °C flower like clusters (Fig. 6(b)) of long rods were observed whereas at a higher growth temperature of 290 °C plate-like crystallites (Fig. 6(c)) were seen. TEM micrographs also confirm the formation of a highly crystalline material at higher temperatures. The HRTEM images of iron selenide nanocrystals show the lattice fringes (Fig. 6(d)) with a d-spacing of 3.69 Å corresponding to the (110) reflection plane of the orthorhombic ferroselite (FeSe2) (ICDD no.: 00-021-0432) phase.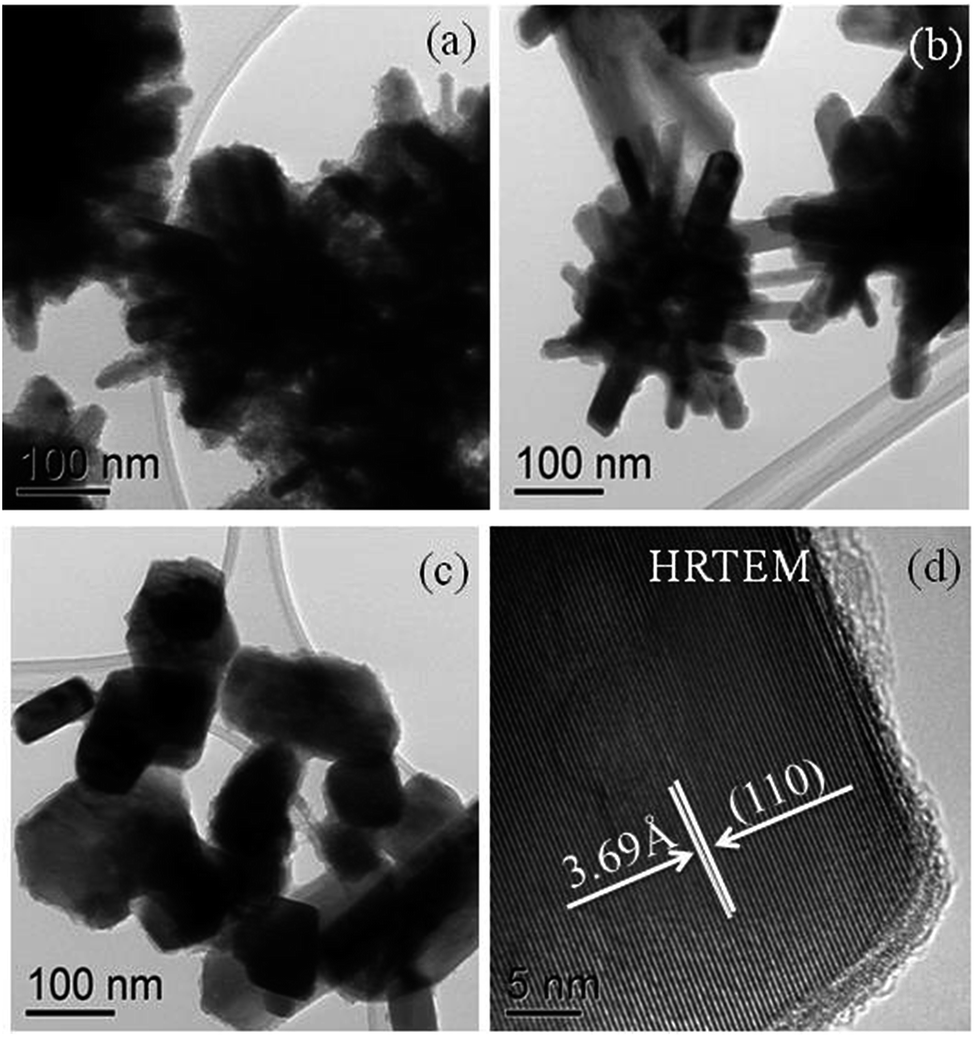 | ||
| Fig. 6 FeSe2 nanocrystals from complex [Fe{(SePiPr2)2N}2] (3) in oleylamine at (a) 190, (b) 240 and (c) 290 °C. HRTEM (d) showing lattice fringes with a d-spacing of 3.69 Å corresponding to the (110) plane reflection of the orthorhombic ferroselite (FeSe2) (ICDD no.: 00-021-0432) phase produced at 290 °C. | ||
Fig. 7(a–c) show the plate-like crystallites of iron selenide obtained from complex ([Fe{(SePPh2)2N}2]) (4) in oleylamine at (a) 190, (b) 240 and (c) 290 respectively. The TEM images of iron selenide nanocrystals obtained at higher temperature (Fig. 7(c)) are more crystalline in nature as compared to the nanocrystals obtained at lower temperature as expected. This is also supporting evidence of the temperature dependence of iron selenide nanocrystal formation.
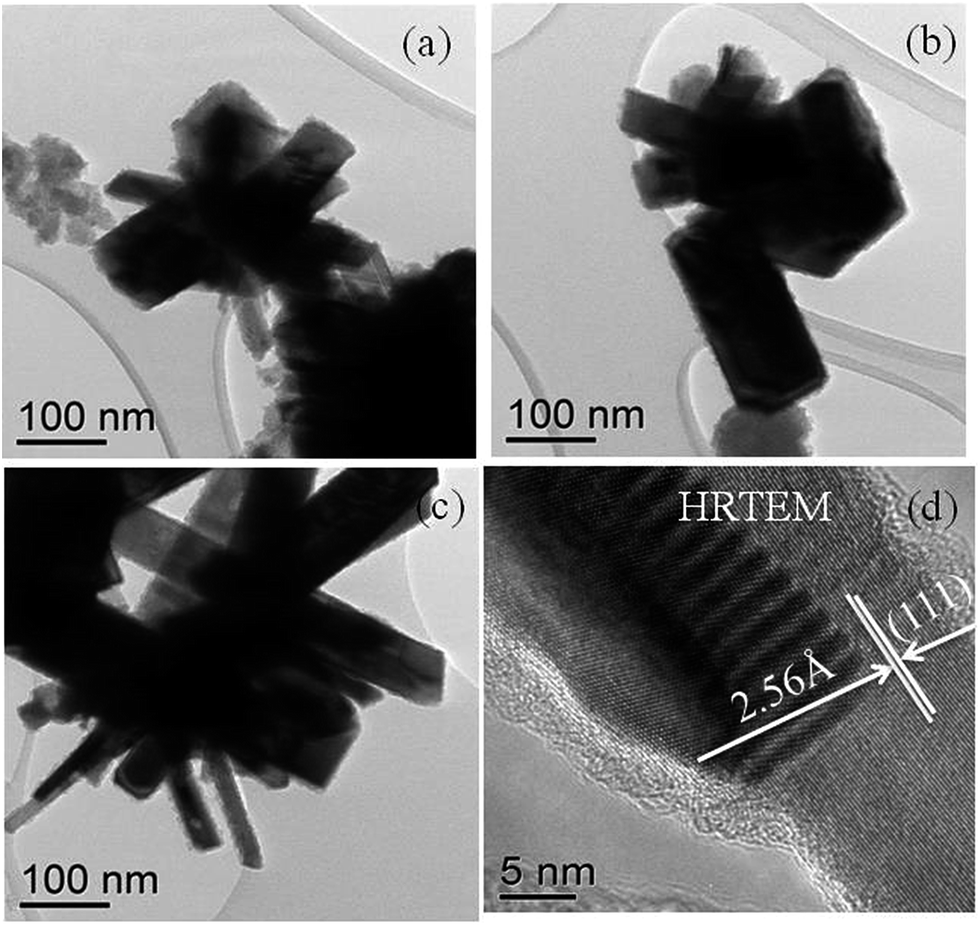 | ||
| Fig. 7 Growth of nanocrystals in oleylamine from complex ([Fe{(SePPh2)2N}2]) (4) at (a) 190, (b) 240 and (c) 290 °C, (d) HRTEM showing lattice fringes with a d-spacing of 2.56 Å corresponding to the (111) reflection plane of the orthorhombic ferroselite (FeSe2) (ICDD no.: 00-021-0432) phase obtained at 290 °C. | ||
The HRTEM images (Fig. 7(d)) of plate-like nanocrystals show the lattice fringes with a d-spacing as 2.56 Å corresponding to the (111) reflection plane of the orthorhombic ferroselite (FeSe2) (ICDD no.: 00-021-0432) phase.
The effect of surfactants
To study the effect of capping agents on the growth of iron selenide phases and morphology, these complexes were also thermolysed in hexadecylamine at 240 °C. The p-XRD pattern (S1) of the nanocrystals produced from the thermolysis of complexes (3) and (4) respectively in hexadecylamine show a mixture of orthorhombic ferroselite (FeSe2) (ICDD no.: 00-021-0432) and orthorhombic ferroselite (*) (FeSe2) (ICDD no.: 01-074-0247). From the p-XRD pattern it is clear that there was no change in the phases of iron selenide by the change of the capping agent.The TEM images (Fig. 8(a) and (b)) of the iron selenide nanocrystals produced from complex [Fe{(SePiPr2)2N}2] (3) in hexadecylamine at 240 °C show the starfish like cluster of long rods. Whereas plate-like crystallites (Fig. 8(c)) of iron selenide were obtained from complex [Fe{(SePPh2)2N}2] (4) in hexadecylamine at 240 °C. The nanocrystals produced in hexadecylamine are more crystalline with well-defined shapes.
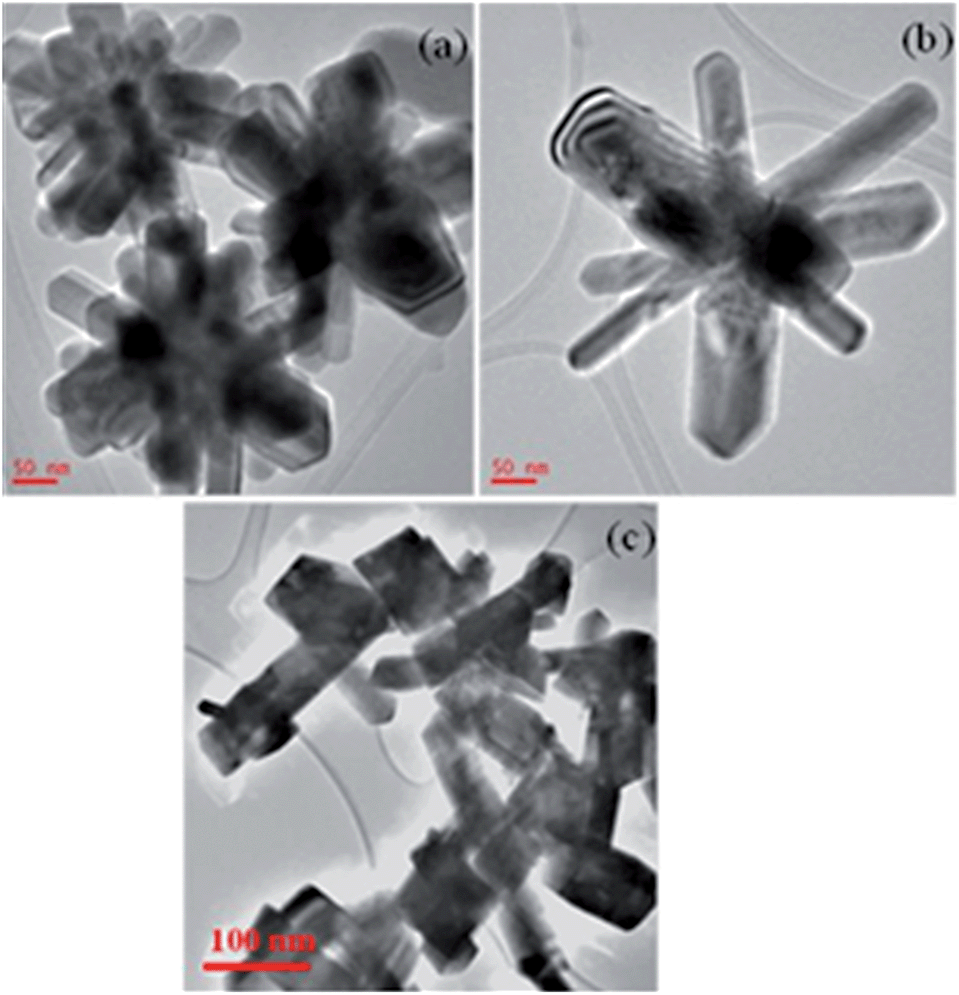 | ||
| Fig. 8 TEM images of iron selenide nanocrystals (a and b) from complex [Fe{(SePiPr2)2N}2] (3) and (c) from complex [Fe{(SePPh2)2N}2] in hexadecylamine at 240 °C. | ||
Deposition of iron selenide thin films from bis(tetraiso-propyldiselenoimidodiphosphinato)iron(II) [Fe{(SePiPr2)2N}2] (3)
Deposition was carried out onto silicon substrates at temperatures from 500 to 600 °C with an argon carrier gas flow rate of 160 sccm. The reflective dark brown films were deposited at 600 °C whereas dark brown films were deposited at 550 and 500 °C.Powder X-ray diffraction of iron selenide thin films
The p-XRD pattern of the deposited films from the complex bis(tetraisopropyldiselenoimidodiphosphinato)iron(II) (3) at 500 (Fig. 9(a)), 550 (Fig. 9(b)) and 600 °C (Fig. 9(c)) shows the mixture of iron selenide ((Fe7Se8) (ICDD no.: 01-071-0586), FeSe2 ((#) ICDD no.: 00-012-0291)) and FeSe2 ((+) ICDD no.: 01-074-0247) phases. The intensity of the peaks in p-XRD patterns for the films deposited at 500 °C (Fig. 9(a)) and 550 °C are weak as compared to the film deposited at a higher temperature of 600 °C. The p-XRD pattern for the films deposited at 600 °C indicates iron selenide ((Fe7Se8) ICDD no.: 01-071-0586), as the main phase with major diffraction peaks appearing for (114), (016), (302), and (037) planes. | ||
| Fig. 9 p-XRD pattern for thin films deposited from complex [Fe{(SePiPr2)2N}2] (3) at (a) 500, (b) 550 and (c) 600 °C respectively. The main phase is iron selenide (Fe7Se8) (ICDD no.: 01-071-0586 new no. 04-007-1554), whereas FeSe2 ((#) ICDD no.: 00-012-0291) and FeSe2 ((+) ICDD no.: 01-074-0247) are the minor phases obtained. | ||
Scanning electron microscopy of iron selenide thin films
The SEM images of films deposited from [Fe{(SePiPr2)2N}2] (3) at 500 and 600 °C shows the sheet-like crystallites (Fig. 10(a) and (c)) whereas rod-like (Fig. 10(b)) crystallites were obtained at 550 °C. The insets in Fig. 10(a) and (c) clearly shows the sheet-like crystallites with a size ranging from 5–8 μm. Small rod-like crystallites with a size ranging from 1–5 μm were obtained at 550 °C and shown as the inset in Fig. 10(b). EDAX analysis (S2) of the all deposited thin films show iron rich composition.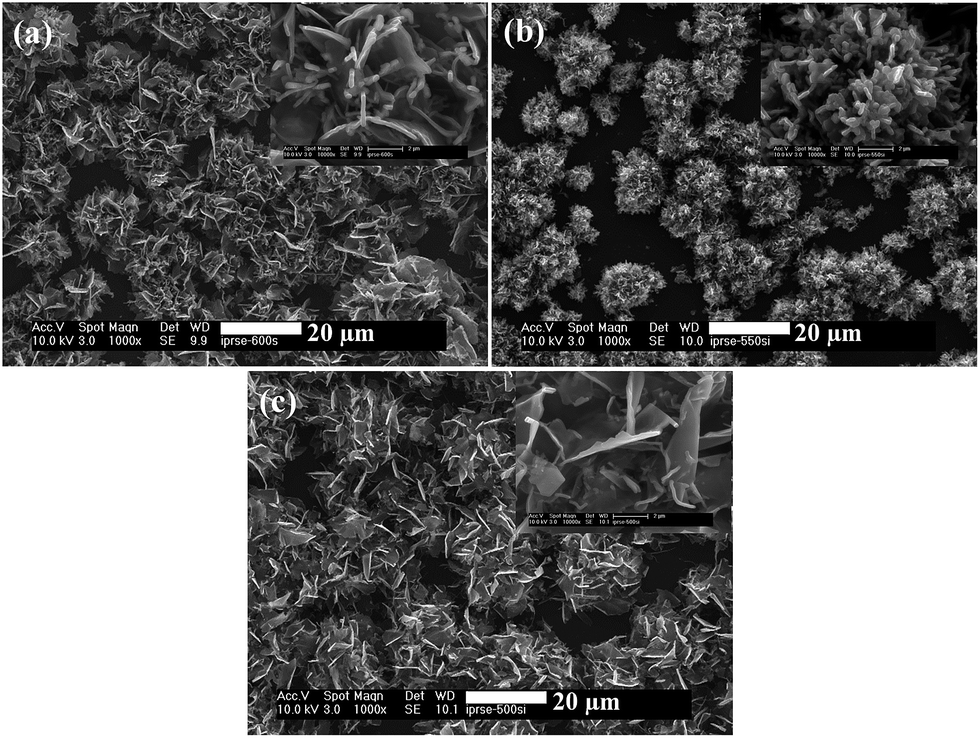 | ||
| Fig. 10 SEM images of iron selenide thin films deposited from complex [Fe{(SePiPr2)2N}2] (3) at (a) 500, (b) 550 and (c) 600 °C respectively. The insets show SEM images at higher magnification. | ||
The elemental mapping images of iron selenide thin films deposited at 500 and 550 °C (Fig. 11(a) and (b)) indicate the uniform distribution of iron and selenium whereas the thin film deposited at 600 °C (Fig. 11(c)) was enriched with iron which was also observed in EDAX analysis.
 | ||
| Fig. 11 Elemental mapping of iron selenide thin films deposited from complex [Fe{(SePiPr2)2N}2] (3) at (a) 500, (b) 550 and (c) 600 °C respectively. | ||
The thickness of the thin films (Fig. 12) of iron selenide deposited from [Fe{(SePiPr2)2N}2] (3) at 600 °C ranges from 12 to 18 μm. This is due to the large size of the crystallites deposited.
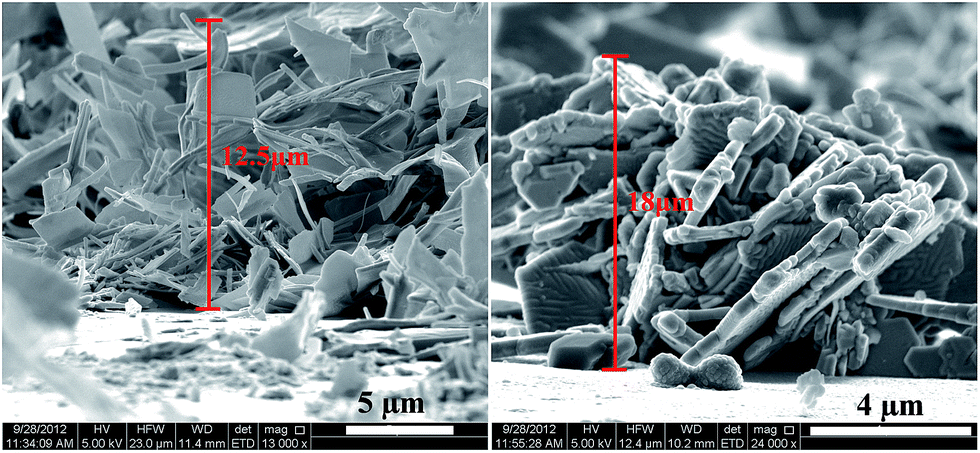 | ||
| Fig. 12 Iron selenide thin films deposited at 600 °C onto the silicon substrate from complex [Fe{(SePiPr2)2N}2] (3). | ||
Interferometer microscopy of iron selenide thin films
The surface topography of the films deposited from complex [Fe{(SePiPr2)2N}2] (3) were analysed by interferometer image as the AFM did not produce good images. The interferometer images of the thin films (S3) reveal loosely packed crystallites. The average roughness values are 3.5 μm for the films deposited at 500 and 550 °C and 3.2 μm for the films deposited at 600 °C.Deposition of iron selenide thin films from bis(tetraphenyl-diselenoimidodiphosphinato)iron(II) [Fe{(SePPh2)2N}2] (4)
The films deposited from the complex [Fe{(SePPh2)2N}2] (4) at different deposition temperatures (500, 550 and 600 °C) were very thin. The p-XRD pattern of these very thin films were not well defined.Scanning electron microscopy of iron selenide thin films
SEM images of thin films (Fig. 13(a–c)) deposited at 500, 550 and 600 °C show uniform films of spherical particles of ca. 100 nm in size. | ||
| Fig. 13 SEM images of iron selenide thin films deposited from complex ([Fe{(SePPh2)2 N}2]) (4) at (a) 500, (b) 550 and (c) 600 °C onto the silicon substrate. | ||
The composition of the deposited films were analysed by EDAX analysis, which showed the films were iron rich. The films deposited at 550 °C from complex (4) show a thickness of 600 nm (Fig. 14) whereas those deposited from complex (3) at the same temperature showed a significantly larger thickness (12–18 μm). This may be due to the different morphologies and the sizes of crystallites deposited from these precursors.
 | ||
| Fig. 14 Iron selenide thin films deposited at 600 °C by AACVD onto the silicon substrate from complex [Fe{(SePPh2)2N}2] (4). | ||
Atomic force microscopy
AFM images (see supplementary material Fig. S4†) were used to analyse the surface topography of the films deposited from complex (4). These images show the growth of closely packed particles onto silicon substrates at all temperatures. The average roughness values (S5) are 182 nm for the film deposited at 500 °C, 26 nm for the film deposited at 550 °C and 8 nm for the film deposited at 600 °C.Conclusion
Orthorhombic ferroselite (FeSe2) nanoparticles were synthesis in oleylamine at 190–240 °C from complexes (3) and (4). TEM images showed the morphology based on rod and plate-like crystallites depending on the temperature used as well as the type of precursor. The deposition of iron selenide thin films from complex (3) produced significantly thicker films based of rods and sheets whereas those deposited from complex (4) produced much thinner films comprising of spherical crystallites under similar conditions.Acknowledgements
M.A. thanks the EPSRC for funding. Characterization data were enabled via support from the EPSRC-funded Leeds EPSRC Nanoscience and Nanotechnology Equipment Facility (LENNF) (EP/K023853/1). We thank Zabeada Aslam at the University of Leeds for her help with the TEM imaging measurements. We thank EPSRC for funding of instruments under grant number EP/K039547/1 for characterization of the compounds.References
- M. Akhtar, J. Akhter, M. A. Malik, P. O'Brien, F. Tuna, J. Raftery and M. Helliwell, J. Mater. Chem., 2011, 21, 9737 RSC.
- M. Akhtar, A. L. Abdelhady, M. A. Malik and P. O'Brien, J. Cryst. Growth, 2012, 346, 106–112 CrossRef CAS.
- M. Akhtar, J. Akhtar, M. A. Malik, F. Tuna, M. Helliwell and P. O'Brien, J. Mater. Chem., 2012, 22, 14970 RSC.
- M. Akhtar, M. A. Malik, F. Tuna and P. O'Brien, J. Mater. Chem. A, 2013, 1(31), 8766–8774 CAS.
- B. X. Yuan, W. L. Luan and S. T. Tu, Dalton Trans., 2012, T41, 772 RSC.
- J. Xu, K. Jang, J. Lee, H. J. Kim, J. Jeong, J. G. Park and S. U. Son, Cryst. Growth Des., 2011, 11, 2707 CAS.
- H. J. Kwon, S. Thanikaikarasan, T. Mahalingam, K. H. Park, C. Sanjeeviraja and Y. D. Kim, J. Mater. Sci.: Mater. Electron., 2008, 19, 1086 CrossRef CAS.
- T. Mahalingam, S. Thanikaikarasan, R. Chandramohan, M. Raja, C. Sanjeeviraja, J. H. Kim and Y. D. Kim, Mater. Chem. Phys., 2007, 106, 369 CrossRef CAS.
- X. J. Wu, D. Z. Shen, Z. Z. Zhang, J. Y. Zhang, K. W. Liu, B. H. Li, Y. M. Lu, B. Yao, D. X. Zhao, B. S. Li, C. X. Shan, X. W. Fan, H. J. Liu and C. L. Yang, Appl. Phys. Lett., 2007, 90, 112105 CrossRef.
- X. J. Wu, Z. Z. Zhang, J. Y. Zhang, B. H. Li, Z. G. Ju, Y. M. Lu, B. S. Li and D. Z. Shen, J. Appl. Phys., 2008, 103, 113501 CrossRef.
- F. C. Hsu, J. Y. Luo, K. W. Yeh, T. K. Chen, T. W. Huang, P. M. Wu, Y. C. Lee, Y. L. Huang, Y. Y. Chu, D. C. Yan and M. K. Wu, Proc. Natl. Acad. Sci. U. S. A., 2008, 105, 14262 CrossRef CAS PubMed.
- P. Terzieff and K. L. Komarek, Monatsh. Chem., 1978, 109, 651 CrossRef CAS.
- P. Terzieff and K. L. Komarek, Monatsh. Chem., 1978, 109, 1037 CrossRef CAS.
- X. J. Wu, D. Z. Shen, Z. Z. Zhang, J. Y. Zhang, K. W. Liu, B. H. Li, Y. M. Lu, B. Yao, D. X. Zhao, B. S. Li, C. X. Shan, X. W. Fan, H. J. Liu and C. L. Yang, Appl. Phys. Lett., 2007, 90, 112105 CrossRef.
- X. J. Wu, Z. Z. Zhang, J. Y. Zhang, B. H. Li, Z. G. Ju, Y. M. Lu, B. S. Li and D. Z. Shen, J. Appl. Phys., 2008, 103, 113501 CrossRef.
- C. E. M. Campos, J. C. de Lima, T. A. Grandi, K. D. Machado, V. Drago and P. S. Pizani, J. Magn. Magn. Mater., 2004, 270, 89 CrossRef CAS.
- C. E. M. Campos, V. Drago, J. C. de Lima, T. A. Grandi, K. D. Machado and M. R. Silva, J. Magn. Magn. Mater., 2004, 269, 6 CrossRef CAS.
- C. R. Lin, Y. J. Siao, S. Z. Lu and C. Gau, IEEE Trans. Magn., 2009, 45(10), 4275 CrossRef CAS.
- M. R. Gao, Z. Y. Lin, J. Jiang, H. B. Yao, Y. M. Lu, Q. Gao, W. T. Yao and S. H. Yu, Chem.–Eur. J., 2011, 17, 5068 CrossRef CAS PubMed.
- A. Liu, X. Chen, Z. Zhang, Y. Jiang and C. Shi, Solid State Commun., 2006, 138, 538 CrossRef CAS.
- Y. Jing, W. H. Jie, S. W. Jia and X. X. Liang, Chin. Phys. B, 2014, 23, 016803 CrossRef.
- H. Zhang, G. Long, D. Li, R. Sabirianov and H. Zeng, Chem. Mater., 2011, 23, 3769 CrossRef CAS.
- L. Chen, H. Zhan, X. Yang, Z. Sun, J. Zhang, X. C. Liang, M. Wu and J. Fang, CrystEngComm, 2010, 12, 4386 RSC.
- G. M. Sheldrick, SHELXS-97 and SHELXL-97, University of Gottingen, Germany, 1997 Search PubMed.
- Bruker, SHELXTL Version 6.12, Bruker AXS Inc, Wisconsin, Madison, USA, 2001 Search PubMed.
- P. Bhattacharyya, J. Novosad, J. Phillips, A. M. Z. Slawin, D. J. Williams and J. D. Woolins, J. Chem. Soc., Dalton Trans., 1995, 1, 1607 RSC.
- T. T. Oyetunde, PhD thesis, University of Manchester, 2011.
- M. R. Churchill and J. Wormald, Inorg. Chem., 1971, 10(8), 1778 CrossRef CAS.
- B. Gamoke, D. Neff and J. Simons, J. Phys. Chem. A, 2009, 113, 5677 CrossRef CAS PubMed.
Footnote |
| † Electronic supplementary information (ESI) available: EDX analysis, 3D interferometer images, 3D AFM images and histograms. CCDC 999303 and 999304. For ESI and crystallographic data in CIF or other electronic format see DOI: 10.1039/c4ta04054f |
| This journal is © The Royal Society of Chemistry 2014 |