 Open Access Article
A metal foam as a current collector for high power and high capacity lithium iron phosphate batteries
Gui Fu
Yang
,
Kyung Yup
Song
and
Seung Ki
Joo
*
Research Institute of Advanced Materials (RIAM) and Department of Materials Science and Engineering, Seoul National University, Seoul 151-742, Korea. E-mail: skjoo@snu.ac.kr
First published on 5th September 2014
Abstract
In this study, a three dimensional NiCrAl alloy foam was used as a current collector for high-power and high-capacity lithium iron phosphate batteries. A charge–discharge test revealed that at a high current rate, the electrode using a metal foam had better power performance and its capacity faded much less than in the case of a conventional foil-type current collector. The cyclic voltammetric analysis showed that the redox reaction occurred much faster in the case of the metal foam than in the case of the foil. The reason for this is that in the case of metal foam, the electrons transfer rapidly at the junction of the metal frame, the active material, and the electrolyte, but, in the case of foil, the electrons transfer relatively slowly between the foil current collector and the electrode surface of the active material. An impedance analysis showed that the charge transfer resistance was much lower for the metal foam than for the foil.
A Introduction
Li-ion batteries are highly suitable for use in portable devices, such as mobile phones, laptops, camcorders, digital cameras, etc. since their energy density and power performance are much higher than for other rechargeable batteries, such as Ni–Cd and Ni–MeH batteries. Recently, Li-ion batteries have also been implemented as storage devices for clean electric vehicles.1–8 To be useful as energy sources for electric vehicles, the active material of a Li-ion battery should be coated with a foil type current collector that is much thinner, and its electrode area should be large enough to achieve high power performance with a sufficient capacity. Thus, the volume and weight per capacity of a Li-ion battery are much larger than that for use in portable devices due to the increase in the use of inactive materials, such as the current collector and separator.In our study, a three dimensional metal foam was used as a current collector instead of a conventional foil for Li-ion batteries in order to improve the power performance and capacity at a high current rate. The benefit of using the metal foam as a current collector in the Li-ion battery is that the redox reaction occurs under improved conditions at the junction of the metal frame, the active material, and the electrolyte. The average electron transfer length is much shorter because the metal frames exist inside of the electrode whereas the current collector exists at the back side of the active material in the case where a foil is used. The benefit of using a three-dimensional metal foam is a result of the higher area for mass loading of the active material that makes it possible to reduce the amount of current collector and separator used, allowing the construction of a smaller and lighter battery.
However, there are some challenges in using metal foams as current collectors for Li-ion batteries because the conventional metal foam generally has a low tolerance when charging or discharging, especially at high voltages. For instance, although the tolerance of a Ni foam is suitable for use in a Ni/MH battery,9–11 the Ni foam was susceptible to corrosion when used in a Li-ion battery.12–14 When used as a current collector, the metal foam should not react with the active material or the electrolyte when charging or discharging. In this study, a NiCrAl alloy foam was used as a current collector instead of a Ni foam for lithium iron phosphate (LiFePO4). LiFePO4 is a promising active material that can be used as a positive electrode for lithium-ion batteries for electric vehicles due to its low toxicity, high safety, potentially low cost, excellent life cycle, high structural stability, and large theoretical capacity (170 mA h g−1), among others.15–30 Although the kinetic performance of LiFePO4 suffers from low electronic conductivity and slow lithium ion transport, it was improved by decreasing the particle size, performing surface modification, and coating with a conductive material such as carbon.18–31
B Experimental
A three dimensional NiCrAl foam was used as a positive electrode current collector for carbon-coated lithium iron phosphate (LiFePO4/C). The pore size of the metal foam was 450 μm, and the thickness was around 500 μm, which was controlled via mechanical polishing. The paste for the positive electrode was prepared by mixing LiFePO4/C, conductive carbon black, and polyvinylidene fluoride (PVdF) at a weight ratio of 80![[thin space (1/6-em)]](https://www.rsc.org/images/entities/char_2009.gif) :
:![[thin space (1/6-em)]](https://www.rsc.org/images/entities/char_2009.gif) 8
8![[thin space (1/6-em)]](https://www.rsc.org/images/entities/char_2009.gif) :
:![[thin space (1/6-em)]](https://www.rsc.org/images/entities/char_2009.gif) 12 with an N-methyl-2-pyrrolidone (NMP) solution. The prepared paste was loaded into the metal foam, and the resultant electrode was dried and then pressed. Finally, the pressed electrode was annealed under a nitrogen atmosphere at 140 °C for half a day. For comparison, an Al foil was coated with a similar amount of active material (11 mg cm−2) and a similar electrode density was obtained by pressing. The electrode density was around 1.05 g cm−3 for the foil-type (electrode thickness = 105 μm and electrode area = 1 cm2). And for the metal foam, the electrode density was calculated by the following four equations.
12 with an N-methyl-2-pyrrolidone (NMP) solution. The prepared paste was loaded into the metal foam, and the resultant electrode was dried and then pressed. Finally, the pressed electrode was annealed under a nitrogen atmosphere at 140 °C for half a day. For comparison, an Al foil was coated with a similar amount of active material (11 mg cm−2) and a similar electrode density was obtained by pressing. The electrode density was around 1.05 g cm−3 for the foil-type (electrode thickness = 105 μm and electrode area = 1 cm2). And for the metal foam, the electrode density was calculated by the following four equations.| ρmV(1 − P) = ρmV′(1 − P′) | (1) |
| ρeV′P′ = Ma | (2) |
| V = tA | (3) |
| V′ = t′A | (4) |
The cells were assembled in a dry glove box filled with pure argon gas, and each positive electrode was prepared with a lithium ribbon negative electrode, and these were placed into a glass tube (φ 28 mm) containing 1 M LiPF6 electrolyte in ethylene carbonate (EC)![[thin space (1/6-em)]](https://www.rsc.org/images/entities/char_2009.gif) :
:![[thin space (1/6-em)]](https://www.rsc.org/images/entities/char_2009.gif) diethyl carbonate (DEC) (1
diethyl carbonate (DEC) (1![[thin space (1/6-em)]](https://www.rsc.org/images/entities/char_2009.gif) :
:![[thin space (1/6-em)]](https://www.rsc.org/images/entities/char_2009.gif) 1 v/v). No distance was created between the positive electrode surface and the lithium ribbon surface using a separator. The charge–discharge tests were performed using a constant current density in a voltage range of 2.5–4.0 V, and the cyclic voltammetric curves were obtained using a constant voltage scan rate between 2.0–4.3 V. Both the charge–discharge test and the cyclic voltammetric analysis were carried out using a WBCS3000 battery cycler system at room temperature. The AC impedance was analyzed at frequencies from 0.02 to 105 Hz by using an electrochemical analyzer (Model CHI608A).
1 v/v). No distance was created between the positive electrode surface and the lithium ribbon surface using a separator. The charge–discharge tests were performed using a constant current density in a voltage range of 2.5–4.0 V, and the cyclic voltammetric curves were obtained using a constant voltage scan rate between 2.0–4.3 V. Both the charge–discharge test and the cyclic voltammetric analysis were carried out using a WBCS3000 battery cycler system at room temperature. The AC impedance was analyzed at frequencies from 0.02 to 105 Hz by using an electrochemical analyzer (Model CHI608A).
C Results and discussion
The morphology of the NiCrAl foam and the electrode was observed using a scanning electron microscope (SEM, JEOL JSM-5600). Fig. 1(a) shows a three-dimensional framework structure of the material. The NiCrAl alloy foam was manufactured by alloying the NiCrAl powder with conventional Ni foam, so the surface of the metal frame was quite rough. The advantage of having a rougher surface for the alloy foam is that the adhesion properties between the active material and metal frame are much improved compared to that in the case where pure Ni foam or a foil has a smooth surface, so the alloy foam can prevent peeling when under mechanical stress. The active material densely filled the alloy foam, as shown in Fig. 1(c), after the paste in the metal foam dried, and the resultant electrode was pressed. Due to the unique structure of the electrode, the redox reaction appears to occur much more quickly at the triple junctions than in other regions. Fig. 1(b) shows the morphology after the metal foam was pressed without the active material. It shows reduced porosity with a reduction in thickness, but the morphology of the surface remains almost the same. Because the metal frames also exist inside of the electrode, the average electron transfer length is much shorter when using a metal foam than when using a foil. Additionally, the triple junctions not only exist at the surface of the electrode but also exist inside because the Li ions of the electrolyte can diffuse into the electrode.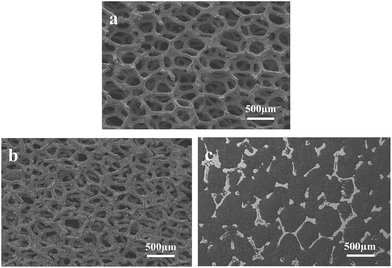 | ||
| Fig. 1 SEM images of the metal foam before pressing (a), after pressing (b), and after filling the active material (c). | ||
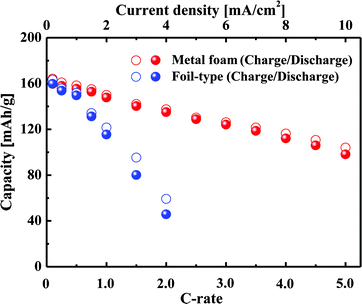
Fig. 2 shows a comparison of the charge–discharge curves at current rates of 0.1 C and 1 C for the cells that use either the metal foam or a foil as a current collector. In the case of the low current rate, there is no difference between the metal foam and the foil in terms of the overvoltage in the plateau region. However, at the higher current rate, the overvoltage in the plateau region is much less for the metal foam than for the foil. The internal resistance was calculated as V = Voc − IRin in the plateau region, and as a result, the internal resistance of the cell was found to be 14 Ω for the metal foam and was 111 Ω for the foil. The component of the impedance that mainly affected the internal resistance will be discussed later during analysis of the AC impedance. When the LiFePO4 phase and FePO4 phase coexist at the surface of LixFePO4 particles, the cell voltage remains constant, and when the two phases become a single phase at the surface, the cell voltage changes rapidly. During the charge–discharge test, the two phases coexist much longer than the single phase because the diffusion of Li can resist two phases, becoming a single phase. At a higher current rate, the capacity proves to be lower as a result of the diffusion limitation of Li. It should be noted that the charge or discharge capacity faded much less with the increase of the current rate in the case of metal foam than that in the case of the foil, as shown in Fig. 3. For instance, the discharge capacity was 135 mA h g−1 for the metal foam but it was only 46 mA h g−1 for the foil at 2 C. This implies that better kinetic performance causes less diffusion limitation for the cell using the metal foam than the foil at a high current rate. For the foil-type, the coulombic efficiency was quite high at a lower current rate, but it decreased much more at a higher current rate. For instance, the coulombic efficiency of the cell was higher than 95% when the current rate was lower than 2 C, but it was less than 85% when the current rate was higher than 2 C. However, for the metal foam, the coulombic efficiency was still higher than 95% regardless of the current rate.
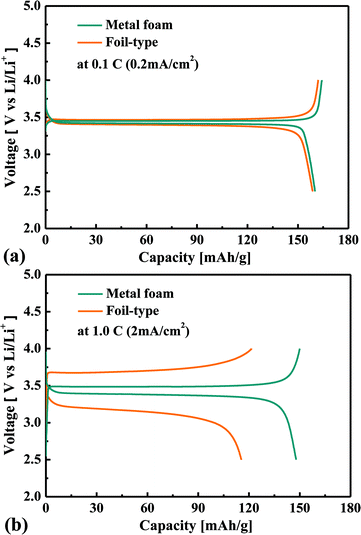 | ||
| Fig. 2 Comparison of the charge–discharge curves for the metal foam and the foil at 0.1 C (0.2 mA cm−2) (a) and 1 C (2 mA cm−2) (b). | ||
Fig. 4(a) shows the cyclic voltammetric curves at scan rates of 0.1 and 0.5 mV s−1 when the metal foam was used for the current collector. Oxidation occurs when the input voltage is more than 3.43 V, and the amount of extraction of Li increases with an increase in the voltage, satisfying the Nernst equation. Then the Li concentration gradient increases at the surface of LixFePO4 particles, so the diffusion flux of Li also increases according to the Fick’s 1st Law. However, when the Li concentration gradient reaches a maximum due to the limited amount of Li in the particles, the diffusion flux of Li begins to decrease, and then the extraction of Li also begins to decrease. This is the reason why the oxidation peak occurs, i.e., why current density decreases even at a higher voltage. Likewise, the insertion of Li increases to the maximum, and then it decreases with the cathodic scan. In the case of a higher voltage scan rate, the position of the redox peaks shifts farther away from 3.43 V, and the current density at the redox peak positions is much higher. Fig. 4(b) shows the relationship between the potential and the capacity to which the electrode is charged or discharged during the voltage potential scan. In the case of 0.1 mV s−1 scan rate, the oxidation peak occurs at 3.56 V, and the amount of oxidation is of 0.95 mA h cm−2 whereas it is only of 0.24 mA h cm−2 in the case of 0.5 mV s−1 scan rate. The Li concentration gradient at the surface of the LixFePO4 particles further increases until the amount of oxidation is close to 0.95 mA h cm−2 in the case of 0.5 mV s−1 scan rate. Therefore, the oxidation peak occurs at a higher voltage, and the current density is much higher in the case of higher scan rate. Likewise, the reduction peak occurs at a lower voltage and the current density is much higher in the case of higher scan rate. It should be noted that the amount of redox reaction is less than 0.95 mA h cm−2 for 0.5 mV s−1 scan rate when the redox peak occurs because of the diffusion limitation of Li. It implies that the better kinetic performance causes the fewer shifts in the position of redox peaks and the higher redox amount at the peak position. The explanation of Fig. 4 helps the readers to understand the difference in the electrochemical performance of the cell between the metal foam and the foil from the cyclic voltammetric analysis. As shown in Fig. 5(a) and (b), the redox peaks appear much earlier for the metal foam and the current density is much higher at the same potential before the redox peaks appear. When the scan rate is increased, the current density at the redox peaks increases much more for the metal foam than for the foil. Additionally, the redox peaks shift much less in the case of the metal foam than in the case of the foil. It shows that the power performance and the kinetic performance of the cell are much more superior for the metal foam than for the foil. Because the redox reaction rate is much higher in the case of the metal foam, the Li concentration gradient is much higher at the surface of LixFePO4 particles, and therefore, according to the Fick's 1st law, the diffusion flux of Li is also much higher. This is the reason why better kinetic performance causes less diffusion limitation for the cell using the metal foam than the foil at high current rate charge–discharge.
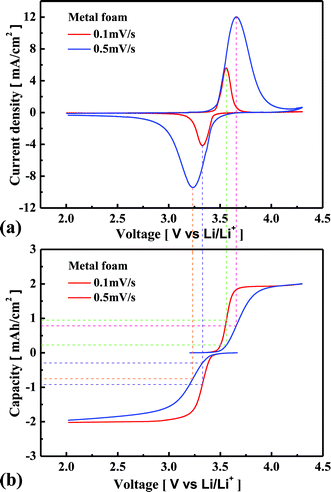 | ||
| Fig. 4 Comparison of the cyclic voltammetric curves (a) and the relationship between the potential and the capacity during the voltage scan (b) for the metal foam in the case of 0.1 and 0.5 mV s−1. | ||
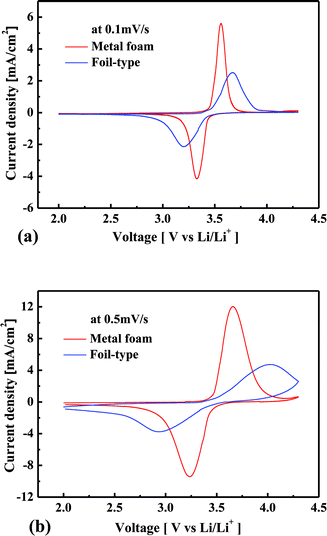 | ||
| Fig. 5 Comparison of the cyclic voltammetric curves for the metal foam and the foil at 0.1 (a) and 0.5 mV s−1 (b). | ||
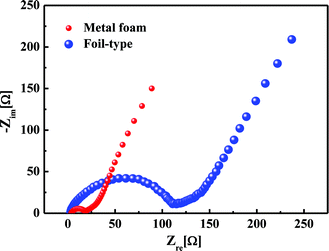
Fig. 6 shows the comparison of the impedance curves in the case of the metal foam and foil-type current collectors. There was almost no difference in the bulk resistance, but the charge transfer resistance was 7 times less for the metal foam than for the foil, at values of 15 Ω and 110 Ω, respectively. It was obvious that the small charge transfer resistance results in a higher power performance and a higher capacity at a high current rate for the metal foam than for the foil-type.
The cycle-life performance of the cell using the metal foam and the foil was evaluated at 0.25 C for 100 cycles as shown in Fig. 7. As a result, the cycle-life performance for the metal foam was exhibited as well as the commercial foil-type. After 100 cycles, more than 90% of the discharge capacity of the cell using the metal foam and the foil was still retained. Additionally, there was no significant difference of the coulombic efficiency at 0.25 C between the metal foam and the foil and each of the coulombic efficiencies was still higher than 95% after 100 cycles. Considering the better kinetic performance and good cycle-life performance of the cell, a three dimensional metal foam is one of the promising current collectors for high power and high capacity Li-ion batteries. However, the issue in this study is that the metal foam was heavier than the foil. Actually, the metal foam supplied from Aluntum Corporation was designed for emission control of vehicle engines. The average thickness of the Ni frame is of around 80 μm which is 3–8 times thicker than the commercial Al foil current collector. In future study, it is necessary to reduce the weight of NiCrAl foam effectively by controlling the size of Ni frame and the content of alloy element for Li-ion batteries.
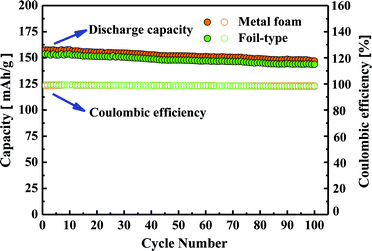 | ||
| Fig. 7 Cycle-life performance and coulombic efficiency of the cell using the metal foam and the foil. | ||
D Conclusions
Due to the unique structure of the metal foam current collector, the electrons transfer rapidly at the junction of the metal frame, the active material, and the electrolyte. The better kinetic performance of the cell using the metal foam was observed from the cyclic voltammetric curves. Additionally, the impedance analysis showed that the charge transfer resistance was much lower in the case of the metal foam than that in the case of the foil. A charge–discharge test revealed that at a high current rate, the electrode using a metal foam had better power performance and its capacity faded much less than using a foil-type current collector.Acknowledgements
This research was supported by the Research Institute of Advanced Materials (RIAM) and the Eui-San Research Center at Seoul National University. The authors acknowledge the supply of metal foam from Alantum Corporation and lithium iron phosphate from Hanwha Chemical Corporation.Notes and references
- J. M. Tarascon and M. Armand, Nature, 2001, 414, 359 CrossRef CAS PubMed.
- K. Kang, Y. S. Meng, J. Breger, C. P. Grey and G. Ceder, Science, 2006, 311, 977 CrossRef CAS PubMed.
- S. M. Dou, J. Solid State Electrochem., 2013, 17, 911 CrossRef CAS.
- B. G. Lee, S. C. Nam and J. S. Choi, Curr. Appl. Phys., 2012, 12, 1580 CrossRef PubMed.
- Y. G. Wang, H. Q. Li, P. He, E. j. Hosono and H. S. Zhou, Nanoscale, 2010, 2, 1294 RSC.
- P. G. Bruce, B. Scrosati and J. M. Tarascon, Angew. Chem., Int. Ed., 2008, 47, 2930 CrossRef CAS PubMed.
- M. Armand and J. M. Tarascon, Nature, 2008, 451, 652 CrossRef CAS PubMed.
- H. Gwon, D. H. Seo, S. W. Kim, J. Kim and K. Kang, Adv. Funct. Mater., 2009, 19, 3285 CrossRef CAS.
- H. Fukunaga, M. Kishimi, N. Matsumoto, T. Ozaki, T. Sakai, T. Tanaka and T. Kishimoto, J. Electrochem. Soc., 2005, 152(5), A905 CrossRef CAS PubMed.
- M. Yao, K. Okuno, T. Iwaki, M. Kato, K. Harada, J. J. Park, S. Tanase and T. Sakai, Electrochem. Solid-State Lett., 2007, 10(3), A56 CrossRef CAS PubMed.
- M. Yao, K. Okuno, T. Iwaki, S. Tanase, K. Harada, M. Kato, K. Emura and T. Sakai, J. Power Sources, 2007, 171, 1033 CrossRef CAS PubMed.
- M. Yao, K. Okuno, T. Iwaki, M. Kato, S. Tanase, K. Emura and T. Sakai, J. Power Sources, 2007, 173, 545 CrossRef CAS PubMed.
- G. F. Yang, J. S. Song, H. Y. Kim and S. K. Joo, Jpn. J. Appl. Phys., 2013, 52, 10MB13 CrossRef.
- G. M. Veith and N. J. Dudney, J. Electrochem. Soc., 2011, 158, A658 CrossRef CAS PubMed.
- D. Jugovic and D. Uskokovic, J. Power Sources, 2009, 190, 538 CrossRef CAS PubMed.
- T. Nagakane, H. Yamauchi, K. Yuki, M. Ohji, A. Sakamoto, T. Komatsu, T. Honma, M. Zou, G. Park and T. Sakai, Solid State Ionics, 2012, 206, 78 CrossRef CAS PubMed.
- N. Ravet, Y. Chouinard, J. F. Magnan, S. Besner, M. Gauthier and M. Armand, J. Power Sources, 2001, 97, 503 CrossRef.
- Y. Z. Zhang, L. Chen, J. K. Ou, J. Wang, B. Z. Zheng, H. Y. Yuan, Y. Guo and D. Xiao, J. Mater. Chem. A, 2013, 1, 7933 CAS.
- Z. H. Chen and J. R. Dahn, J. Electrochem. Soc., 2002, 149, A1184 CrossRef CAS PubMed.
- X. K. Zhi, G. C. Liang, L. Wang, X. Q. Ou, J. P. Zhang and J. Y. Cui, J. Power Sources, 2009, 189, 779 CrossRef CAS PubMed.
- F. Gao, Z. Tang and J. Xue, Electrochim. Acta, 2007, 53, 1939 CrossRef CAS PubMed.
- L. Wang, Y. Huang, R. Jiang and D. Jia, Electrochim. Acta, 2007, 52, 6778 CrossRef CAS PubMed.
- K. T. Kim, J. H. Jeong, I. J. Kim and H. S. Kim, J. Power Sources, 2007, 167, 524 CrossRef CAS PubMed.
- T. E. Ashton, J. V. Laveda, D. A. MacLaren, P. J. Baker, A. Porch, M. O. Jones and S. A. Corr, J. Mater. Chem. A, 2014, 2, 6238 CAS.
- D. Jugovic, M. Mitric, M. Kuzmanovic, N. Cvjeticanin, S. Markovic, S. Skapin and D. Uskokovic, Powder Technol., 2012, 219, 128 CrossRef CAS PubMed.
- C. W. Kim, J. S. Park and K. S. Lee, J. Power Sources, 2006, 163, 144 CrossRef CAS PubMed.
- M. M. Doeff, J. D. Wilcox, R. Kostecki and G. Lau, J. Power Sources, 2006, 163, 180 CrossRef CAS PubMed.
- W. B. Luo, S. L. Chou, Y. C. Zhai and H. K. Liu, J. Mater. Chem. A, 2014, 2, 4927 CAS.
- Y. Ding, Y. Jiang, F. Xu, J. Yin, H. Ren, Q. Zhuo, Z. Long and P. Zhang, Electrochem. Commun., 2010, 12, 10 CrossRef CAS PubMed.
- Y. Cui, X. Zhao and R. Guo, J. Alloys Compd., 2010, 490, 236 CrossRef CAS PubMed.
- H. Liu, Q. Cao, L. J. Fu, C. Li, Y. P. Wu and H. Q. Wu, Electrochem. Commun., 2006, 8, 1553 CrossRef CAS PubMed.
| This journal is © The Royal Society of Chemistry 2014 |

