 Open Access Article
Creative Commons Attribution 3.0 Unported Licence
Thin film fabrication and characterization of proton conducting lanthanum tungstate†
Kristin
Bergum
*,
Anna
Magrasó
,
Helmer
Fjellvåg
and
Ola
Nilsen
Centre for Materials Science and Nanotechnology (SMN), Department of Chemistry, University of Oslo, P.O. Box 1033 Blindern, N-0315 Oslo, Norway. E-mail: kristin.bergum@smn.uio.no
First published on 3rd September 2014
Abstract
Thin films of the proton conducting lanthanum tungstate phase, La28−xW4+xO54+δv2−δ, were fabricated by atomic layer deposition (ALD) and characterized by impedance spectroscopy. The films were prepared by combining the processes of deposition of La2O3 and WO3 using [La(thd)3 + O3] and [(tBuN)2(Me2N)2W(VI) + H2O]. Deposition of WO3 by the above mentioned precursor combinations is investigated in the range of 250–375 °C proving ALD growth at temperatures 275–325 °C. WOCl4 + H2O was evaluated for WO3 deposition. The observed surface sensitive growth resulted in limited film growth on selected substrates. The process of lanthanum tungstate deposition was optimized with respect to control of stoichiometry and 0.9 and 1.2 μm thick films were deposited on MgO and Pd for cross-plane and in-plane impedance spectroscopy measurements, respectively. Due to short-circuiting of films on Pd after heat treatment, an alternative deposition procedure was devised which reduced short-circuiting significantly. The films show primarily ionic conductivity under wet conditions. Oxide ions are the dominating conductors above 650 °C, while protons become more dominant at lower temperatures. There is a significant contribution from n-type electronic conductivity in highly reducing atmospheres.
Introduction
Proton conducting materials are important in energy related applications, such as electricity generation in proton conducting fuel cells (PCFC), H2 generation in steam electrolysers, and as membranes for H2 gas separation. The proton conducting lanthanum tungstate (LWO), previously known as La6WO12 (ref. 1–3) and recently reformulated to La28−xW4+xO54+δv2−δ (0.74 < x < 1.08),4,5 is a promising candidate for application in both PCFCs and H2 permeable membranes. At intermediate temperatures, LWO has a high proton conductivity and negligible electronic conductivity below 750 °C (3 × 10⁻³ S cm−1 at 750 °C).3,6,7 At temperatures above 800 °C, in a reducing or oxidizing atmosphere, the material exhibits mixed ionic and electronic conductivity.3,7 A high H2 permeability of 0.14 mL min−1 cm−2 (ref. 8 and 9) has been measured in an asymmetric LWO membrane at 1000 °C, confirming the possibility for the application of LWO as a H2 permeable membrane. LWO has also shown high chemical stability in CO2-rich and sulphur-containing atmospheres,9 high mechanical stability10 as well as a thermal expansion coefficient of ∼11–12 × 10−6 K−1 (ref. 11–13), making it compatible with device manufacturing. Chemical compatibility with established cathode materials such as La0.7Sr0.3MnO3−δ, La0.75Sr0.25Cr0.5Mn0.5O3−δ (ref. 13) and Pr2NiO4 (ref. 14) has also been demonstrated.For both fuel cell and hydrogen membrane applications, the proton-conducting electrolyte should be as thin as possible while still retaining its pin-hole free character. Atomic Layer Deposition (ALD) is a thin film deposition technique that inherently creates uniform, pin-hole free films even on geometrically complex surfaces. It is therefore perfectly suited for deposition of membranes and electrolytes. The film thickness is highly controllable by ALD in the low nm range, opening up for designs where thin membranes can be used to realize high fluxes at lower temperatures. This is a major advantage, as it allows the application of materials which traditionally would be regarded too resistive. The application of thin film designs does, however, introduce challenges with respect to mechanical instability, possible faster degradation, and higher overall leak currents. Such effects have to be taken into consideration in designing new electrolytes. An alternative approach to realization of proton-conducting membranes is to take advantage of the inherent capability of the ALD method to coat evenly on 3D substrates while still retaining the same quality of the films. The ALD technique can therefore be implemented as a subsequent step to traditional techniques in order to cover any remaining pin-hole on an already established electrolyte or a H2-permeable membrane.
It may be challenging to obtain the target accurate stoichiometry during deposition of complex oxides by the ALD technique. Such materials are typically prepared by combining two or more binary oxide processes sequentially.15 The amount of material deposited by each binary ALD cycle is process dependent and will often be affected by the surface chemistry of the preceding cycle. In the current work, we combine processes for deposition of the binary oxides, La2O3 and WO3, to obtain films within the La–W–O system. Deposition of La2O3 is previously well-known and is summarized in a recent comprehensive review16. There are, comparably, limited reports on deposition of WO3 by ALD.17–19 We currently expand and report on novel attempts and routes for deposition of WO3.
The main aim of the current work is to demonstrate the feasibility of using ALD for deposition of proton conducting oxide materials within the relevant La![[thin space (1/6-em)]](https://www.rsc.org/images/entities/char_2009.gif) :
:![[thin space (1/6-em)]](https://www.rsc.org/images/entities/char_2009.gif) W molar range of 5.3–5.7
W molar range of 5.3–5.7![[thin space (1/6-em)]](https://www.rsc.org/images/entities/char_2009.gif) :
:![[thin space (1/6-em)]](https://www.rsc.org/images/entities/char_2009.gif) 1 (ref. 5). The second target is to reliably measure the protonic conductivity by impedance spectroscopy, a task which frequently encounters major challenges, mostly due to formation of cracks or delamination in either films or contacts.
1 (ref. 5). The second target is to reliably measure the protonic conductivity by impedance spectroscopy, a task which frequently encounters major challenges, mostly due to formation of cracks or delamination in either films or contacts.
Experimental
All films were deposited using an F120-SAT research – type ALD reactor (ASM Microchemistry) using a combination of different processes for formation of tungsten and lanthanum oxides. The lanthanum oxide process was based on La(thd)3 and ozone, according to the procedure described by Nieminen et al.20 La(thd)3 was sublimed inside the reactor at 180 °C and introduced into the reaction chamber using inert gas valves. Ozone was produced by using a BMT 803N from OSTI inc, with oxygen from an ATF Oxygen Concentrator Module from Sequal Technologies. Tungsten oxides were deposited using either a combination of WOCl4 and H2O or (tBuN)2(Me2N)2W (hereafter termed BMW) and H2O. H2O was evaporated from an external container at room temperature. WOCl4 was sublimed inside the reactor at 100–180 °C using inert gas valves, while the BMW precursor was delivered from an externally heated bubbler using a pressure cycling procedure consisting of filling the 50 ml bubbler with 0.5 bar of inert gas and delivering this into the reaction chamber. The precursor temperature was subjected to optimization and 60 °C was applied for the remaining experiments. The inert gas for the reactor was produced using a Schmidlin Sirocco 5 N2 generator (<99.999%) at a total rate of 500 sccm resulting in an overall reactor pressure of approximately 4 mbar. The films were deposited on Si (100), Mg (100) and Pd. The substrates were cleaned using ethanol and pressurized air and exposed in situ to pulses of O3 prior to the deposition.The cation atomic composition (cat%) of the films deposited on Si substrates was determined by X-ray fluorescence (XRF) using a Philips PW2400 XRF and analyzed by the Uniquant program. A J.E Woolham Alpha-SE spectroscopic ellipsometer was used to measure the thickness of the films by modelling the experimental data to a Cauchy function. X-ray diffractograms (XRDs) were measured using a Bruker AXS D8 Discover powder diffractometer equipped with a Ge(111) monochromator providing CuKα1 radiation and recorded using a LynxEye detector. Scanning electron microscopy (Nova NanoSEM 650 from FEI) was used to obtain images of the films. In situ quartz crystal microbalance (QCM) measurements were conducted using home-made holders and recorded using a Maxtek TM400 unit.
Electrical measurements were conducted using two different configurations. For the in-plane measurements, an insulating MgO substrate (1 × 1 cm2) with the LWO film on top was coated with two stripes of ∼500 nm of Pt separated by 0.5 mm by sputtering, using a Cressington 308R coating system. For the cross-plane measurements, an electron conducting and H2 permeable dense Pd substrate (20 mm diameter, 0.3 mm thickness) was used. In this case, several contact points of 3 mm and ∼500 nm thick Pt were coated by sputtering as a counter electrode, and the electrodes that did not short-circuit after annealing were measured. In all cases, Pt grid and wires were attached to either electrode in a 2-point-4-wire setup. Impedance spectra were collected at different temperatures and atmospheres using an impedance analyzer (Novocontrol Alpha A, Novocontrol Technologies) in the 0.1 Hz to 1 MHz frequency range with an AC perturbation of 50 mV. The thicknesses of the LWO films were approximately 1.2 μm on Pd and 0.9 μm on MgO. The film and electrode were annealed at 800 °C for 30 min prior to the analysis to increase the film crystallinity and electrode adherence.
Results and discussion
As mentioned in the Introduction, the aim of the current project is to develop thin films in the La–W–O series by combining processes of deposition of binary lanthanum and tungsten oxides. The process of deposition of lanthanum oxide was adopted from the work of Nieminen et al.20 and is described in more detail in the section of La–W–O deposition.WO3 deposition
The prior experience in deposition of tungsten oxides is relatively limited. We chose to investigate the possible application of WOCl4 and BMW due to their availability and possible simplicity. WOCl4 should on first impression be a simple type of precursor, however, with potential inclusion of chlorine during deposition. While chlorine incorporation is not a challenge with BMW, its current cost is considerably higher. The application of WCl6 + H2O as a precursor combination was not considered practical due to likely formation of volatile WOCl4, in a similar manner to that reported for the application of NbCl5 with H2O.21 In the same work by Knapas et al., however, they showed that NbOCl3 can be applied to the formation of films of Nb2O5. Previous work on deposition of WO3 films by WF6 (ref. 17) has revealed limited film formation due to film etching in the same manner as mentioned above, whereas in situ generated WOyFx proved more successful and a much higher growth rate was obtained. It is therefore likely that the same will apply to the chloride analogue. Previous studies have also shown successful deposition of WO3 using the BMW precursor,18 which we have expanded upon in terms of growth temperatures, in addition to further investigation into the ALD/CVD process.WOCl4
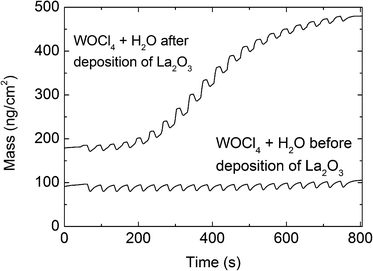
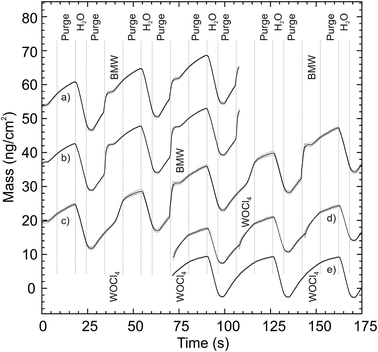
The attempts to deposit WO3 using WOCl4 as a cation precursor yielded no growth on Si substrates at first, despite variations of the precursor temperature (100–180 °C), substrate temperature (150–300 °C), reactant (H2O, O3, H2O + O3), and pulsing time (3–25 s). However, signs of deposition were observed when depositing on films of La2O3 or Al2O3 on Si substrates.An in situ QCM analysis, Fig. 1 and 2, was conducted at 275 °C to obtain some information on the role of the substrate during deposition, specifically on La2O3. A thin layer of WO3 was deposited on the QCM crystal as a nucleation layer using 20 cycles of the BMW + H2O process described later. The thickness of WO3 was estimated from the WO3 growth rates to be less than a monolayer (1.6 Å), leaving the Au surface of the QCM only partially covered. No film was observed when WOCl4 + H2O were pulsed directly on this surface (Fig. 1a and 2e). Interestingly, while no growth was seen when a long wait time was added between deposition of the nucleation layer and the WOCl4 + H2O process, some film formation was detected when pulsing WOCl4 + H2O directly after the BMW + H2O process (Fig. 2c). These results were reproducible. Thereafter, a thin layer of La2O3 (13 Å) was deposited using 40 cycles of the La(thd)3 + O3 process before the WO3 nucleation layer and the WOCl4 + H2O process was repeated. This resulted in formation of a limited amount of material. The growth rate after an initiation period of a few cycles was reasonably high but non-linear (Fig. 1), before tapering off to a very low but linear growth rate within the range studied (Fig. 2d). While the growth did not cease during the limited number of cycles applied in the QCM measurements, prolonging the exposures of the WOCl4 + H2O pair on La2O3 from 1000 to 3000 cycles did not reveal any additional film formation. A similar experiment on Al2O3, where the number of cycles on the Al2O3 film increased from 1000 to 2500, gave the same negative result. The film formation was limited to less than two nanometers. An XRF study of the deposited film revealed a significant amount of chlorine in the films deposited on La2O3 resulting in near equiatomic compositions of W and Cl (54 at% Cl when considering only Cl and W, excluding the La and O content). Chlorine was, however, not detected in the films deposited on Al2O3.
To conclude, WO3 appears to grow on the surfaces of selected substrates, however, the growth is severely limited as WO3 appears not to grow on itself. The WOCl4 + H2O process was not pursued further due to limited incorporation of W and notable contents of Cl in the deposited films.
BMW
The applicability of the BMW + H2O precursor pair for deposition of WO3 was thereafter investigated. The temperature of the precursor was varied from room temperature to 70 °C, using a substrate temperature of 275 °C and a pulsing sequence of 3 s BMW, 3 s purge, 3 s H2O, and 3 s purge. The growth rates are shown in Fig. 3. Tests proved that the vapor pressure of the BMW precursor was sufficiently high for complete saturation at a precursor temperature of 60 °C with the current set-up. This temperature was therefore chosen for all further deposition steps. Lower precursor temperatures were not adopted, although possible, due to the wish to be well within a regime of ALD growth combined with possibilities of later reducing the pulsing time. The pulsing parameters were verified for saturative conditions by simple variations, and were utilized in the remaining experiments for growth of pure WO3.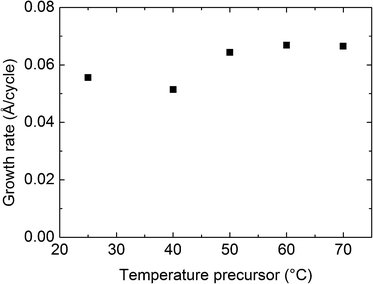 | ||
| Fig. 3 Growth rate of WO3 from the BMW + H2O process at 275 °C as a function of the BMW precursor temperature using a pulsing sequence of 3 s BMW, 3 s purge, 3 s H2O, and 3 s purge. | ||
In situ QCM analysis of the BMW process, Fig. 2a and b, shows a slightly surface enhanced growth on La2O3 relative to the pure substrate. The slope per cycle increased from 5.0 to 6.6 ng cm−2, averaged over 20 cycles. Comparing the two QCM recordings, it appears that the increase in the growth rate stems from a larger uptake of the BMW precursor, while the decrease of mass during the water pulse remains nearly the same. It is likely that the decrease in mass observed in the QCM data is dominated by temperature changes brought about by the water pulse itself, making the data unreliable for analyzing the leaving groups. We can therefore only conclude with a higher density of BMW precursor during its pulse.
The growth rate of WO3 as a function of deposition temperature was investigated in the range of 250 to 375 °C, as presented in Fig. 4. No growth was observed at 250 °C while a steadily increasing ALD-type growth was found for deposition temperatures from 275 to 325 °C. CVD-type growth was present at and above 350 °C.
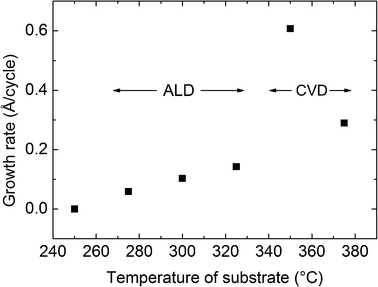 | ||
| Fig. 4 Growth rate of WO3 as a function of deposition temperature for the BMW + H2O process using a pulsing sequence of 3 s BMW, 3 s purge, 3 s H2O and 3 s purge. | ||
The CVD-type growth was observed as increased film thickness on extended pulsing time, and by achieving film growth by pulsing of only BMW. Similar tests at 325 °C proved clearly the growth of the ALD-type as no change in the film thickness occurred with increasing pulsing time and no growth was observed by pulsing only BMW. It should be noted, however, that the CVD deposition of WO3 was remarkably uniform and reproducible.
XRD analysis revealed all as-deposited WO3 films to be amorphous. RTP annealing caused crystallization of a multitude of WO3 phases at 600 °C.
La–W–O deposition
The La–W–O system was investigated by combining the deposition processes for La2O3 and WO3. The number of La cycles [La(thd)3 + O3] between each W cycle [BMW + H2O] was varied from 10 (91 pulse%) to 17 (94.5 pulse%). The pulse and purge parameters used for this investigation were higher than those sufficient for saturation and ensured ALD growth, and were set at 3/6/3/10 s for La2O3 and 5/5/3/5 s for WO3. In particular, the BMW precursor appears to react strongly with any remaining ozone from the La-cycle, and an extra purge of 60 s was used before introducing the BMW precursor.The average growth rate increases with La-content as seen in Fig. 5. This is expected due to the higher growth rate of La2O3 as compared to WO3. The observed growth rates were, however, lower than a direct combination of the growth rates of the binary oxides. As discussed previously, a surface enhanced growth of WO3 is seen when deposited on La2O3. Therefore, these results suggest that the growth of La2O3 is surface inhibited when deposited on WO3.
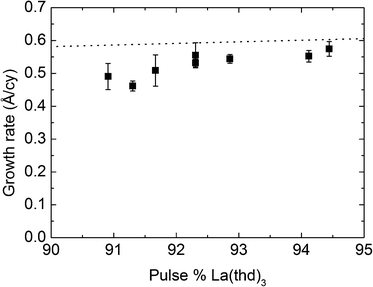 | ||
| Fig. 5 Growth rate of La–W–O films as a function of the La-pulse percentage using the precursor combinations x[La(thd)3 + O3] + [BMW + H2O]. | ||
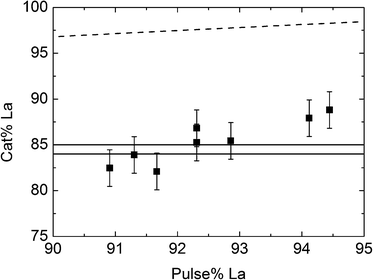
The correlation between the pulsed and the deposited La![[thin space (1/6-em)]](https://www.rsc.org/images/entities/char_2009.gif) :
:![[thin space (1/6-em)]](https://www.rsc.org/images/entities/char_2009.gif) W composition was further investigated, as presented in Fig. 6. It appears that a La-pulsing between 91.3 and 92.4% gives products within the composition range for the proton conducting LWO phase. These correspond to pulsing ratios of 10.5
W composition was further investigated, as presented in Fig. 6. It appears that a La-pulsing between 91.3 and 92.4% gives products within the composition range for the proton conducting LWO phase. These correspond to pulsing ratios of 10.5![[thin space (1/6-em)]](https://www.rsc.org/images/entities/char_2009.gif) :
:![[thin space (1/6-em)]](https://www.rsc.org/images/entities/char_2009.gif) 1 and 12
1 and 12![[thin space (1/6-em)]](https://www.rsc.org/images/entities/char_2009.gif) :
:![[thin space (1/6-em)]](https://www.rsc.org/images/entities/char_2009.gif) 1, where 10.5
1, where 10.5![[thin space (1/6-em)]](https://www.rsc.org/images/entities/char_2009.gif) :
:![[thin space (1/6-em)]](https://www.rsc.org/images/entities/char_2009.gif) 1 is achieved by alternating 10
1 is achieved by alternating 10![[thin space (1/6-em)]](https://www.rsc.org/images/entities/char_2009.gif) :
:![[thin space (1/6-em)]](https://www.rsc.org/images/entities/char_2009.gif) 1 with 11
1 with 11![[thin space (1/6-em)]](https://www.rsc.org/images/entities/char_2009.gif) :
:![[thin space (1/6-em)]](https://www.rsc.org/images/entities/char_2009.gif) 1. The compositional interval for achieving the proton conducting phase is very small, and the experimental uncertainties in both sample acquisition and analysis are challenging. RBS measurements were performed on selected samples, although outside the pulsing range in Fig. 6. These differ with approximately 2–4 cat% points from the XRF values. Repeated deposition cycles lead to variations in the order of up to 2 cat%.
1. The compositional interval for achieving the proton conducting phase is very small, and the experimental uncertainties in both sample acquisition and analysis are challenging. RBS measurements were performed on selected samples, although outside the pulsing range in Fig. 6. These differ with approximately 2–4 cat% points from the XRF values. Repeated deposition cycles lead to variations in the order of up to 2 cat%.
As an additional note, the exact relationship between the pulsed and deposited composition depends also on the ozone concentration. Initial attempts using a generator providing a lower ozone concentration (OT-020 from Ozone Technology, using >99.9% O2) gave the desired composition at a La-pulse% of approximately 94% as compared to approximately 92 pulse% for the current case. This issue was not subject to further studies.
The expected correlation between pulsed and deposited composition can be calculated on the basis of the individual growth rates and densities of the binary oxides, and is marked with the dashed line in Fig. 6. Our LWO films appear to contain more W than expected from the individual growth rates. As previously discussed, deposition of WO3 on La2O3 films indicated a surface enhanced growth of WO3 on La2O3, while La2O3 deposition experiences a surface inhibited growth on WO3, which is in accordance with these findings.
La28−xW4+xO54+δv2−δ deposition for electrical measurements
Pulsing of 91.4% La(thd)3 cycles (pulsing relationship 10.67![[thin space (1/6-em)]](https://www.rsc.org/images/entities/char_2009.gif) :
:![[thin space (1/6-em)]](https://www.rsc.org/images/entities/char_2009.gif) 1) gave films close to the LWO54 composition (5.4
1) gave films close to the LWO54 composition (5.4![[thin space (1/6-em)]](https://www.rsc.org/images/entities/char_2009.gif) :
:![[thin space (1/6-em)]](https://www.rsc.org/images/entities/char_2009.gif) 1 ratio for La
1 ratio for La![[thin space (1/6-em)]](https://www.rsc.org/images/entities/char_2009.gif) :
:![[thin space (1/6-em)]](https://www.rsc.org/images/entities/char_2009.gif) W molar ratio). This pulsing ratio was achieved by alternating the macrocycles 10
W molar ratio). This pulsing ratio was achieved by alternating the macrocycles 10![[thin space (1/6-em)]](https://www.rsc.org/images/entities/char_2009.gif) :
:![[thin space (1/6-em)]](https://www.rsc.org/images/entities/char_2009.gif) 1 and 11
1 and 11![[thin space (1/6-em)]](https://www.rsc.org/images/entities/char_2009.gif) :
:![[thin space (1/6-em)]](https://www.rsc.org/images/entities/char_2009.gif) 1 in a 1
1 in a 1![[thin space (1/6-em)]](https://www.rsc.org/images/entities/char_2009.gif) :
:![[thin space (1/6-em)]](https://www.rsc.org/images/entities/char_2009.gif) 2 ratio.
2 ratio.
A 0.9 μm thick LWO film was deposited on MgO (100) for in-plane measurement and a 1.2 μm thick film was deposited on polycrystalline Pd for cross-plane measurements. This thickness of the films allows the resistance through the film to be reliably measured. For Pd substrates, two different methods were used to obtain thick LWO films, termed method 1 (M1) and method 2 (M2). M1 was the same as that for MgO substrates, using continuous ALD deposition, only stopping the reactor to refill the La(thd)3 precursor every 22 h. With M2, 40 nm LWO films were initially deposited on the Pd substrates by ALD and heat treated at 850 °C for 30 min in air. These were subsequently used as substrates for further deposition of approximately 1.16 μm of continuous LWO deposition as in the first method. The second method was established to attempt avoiding cracking and short-circuiting of the film during measurements.
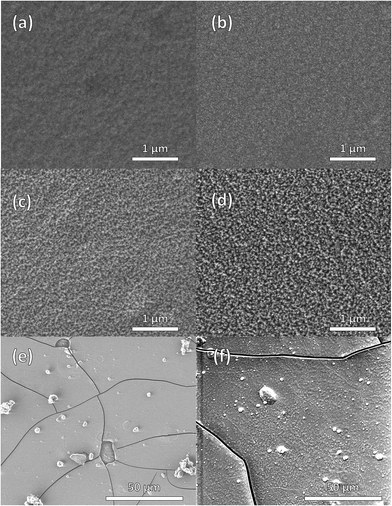
The SEM images in Fig. 7 of the as-deposited crystalline LWO films show smooth and crack-free films, appearing to be pinhole-free (Fig. 7a and b). After annealing for 30 min at 850 °C, the films show an increase in roughness at high magnifications (Fig. 7c and d). The films on MgO maintained their pinhole-free character, but cracks of approximately 1 μm width appeared in the film deposited on Pd using M1 (Fig. 7e). Cracks also appeared after heat treatment using M2, however, the separation between the cracks was much larger than for M1 (Fig. 7f).
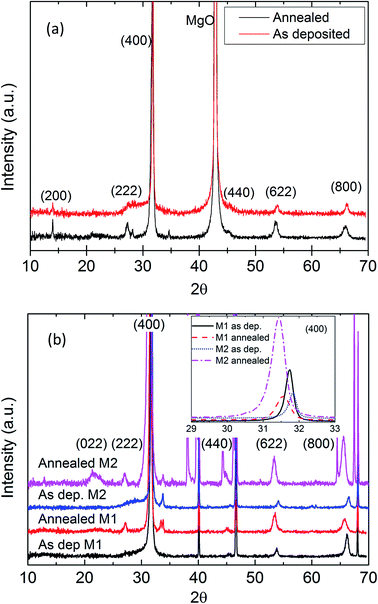
All Bragg reflections of both as-deposited and annealed LWO films were ascribed to the proton-conductive fluorite-type phase or to the substrate/deposited contacts when deposited on Pd or MgO, see Fig. 8. The deposited film shows a strong preferred orientation based on the high intensity of (400) compared to the scarcely visible (222). For a randomly oriented sample, (400) is 44% of the intensity of (222). After annealing, (222) becomes more intense, and the FWHM of all peaks increases. This is indicative of crystallization of the remaining amorphous LWO material, or recrystallization. The new small crystallites will broaden the peak significantly as well as cause new reflections to appear.
The unit cell dimension a was found to be 11.3 Å and the space group was Fm![[3 with combining macron]](https://www.rsc.org/images/entities/char_0033_0304.gif) m.12 This is larger than the bulk value a = 11.18 Å (ref. 4, 5 and 12). The positions of all reflections shift towards lower 2θ angles (larger d-spacings) upon annealing in air, as is clearly shown in the insets of Fig. 8. This behavior is different than expected since thin films normally tend to relax toward bulk values upon annealing. It is therefore possible that the deposited material is influenced by other chemical parameters, such as hydration or impurities.
m.12 This is larger than the bulk value a = 11.18 Å (ref. 4, 5 and 12). The positions of all reflections shift towards lower 2θ angles (larger d-spacings) upon annealing in air, as is clearly shown in the insets of Fig. 8. This behavior is different than expected since thin films normally tend to relax toward bulk values upon annealing. It is therefore possible that the deposited material is influenced by other chemical parameters, such as hydration or impurities.
LWO electrical measurements
The conductivity σ as measured both by cross-section and in-plane geometry of the films was calculated using the equation: | (1) |
Two assumingly identical samples of LWO films deposited on MgO (labeled as LWO-1 and LWO-2) were measured using the in-plane configuration in the temperature range of 650 to 900 °C. The lowest temperature included in these measurements was based on the instrumental resolution for the highest resistive measurements. Representative Nyquist plots (Fig. S1†) and an interpretation of the data are included as the ESI.† The conductivity of the film includes the contribution from both grain interior and grain boundaries and cannot be separated in this geometry, in accordance with other studies.22,23
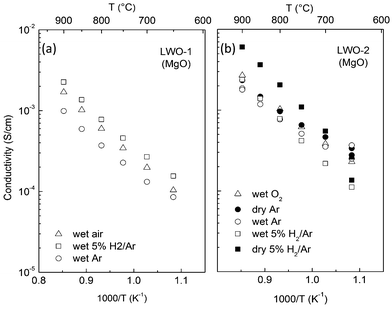
The variation of the conductivity of the film with temperature under different atmospheres is shown in Fig. 9. LWO-1 was used for a quick assessment of the conducting properties, while LWO-2 was measured to gain further insight into the dominating charge carriers. The data were recorded on cooling.
Fig. 9a (LWO-1) shows that the conductivity in wet Ar is lower than in wet air and in wet 5%H2/Ar. This is an indication that some electron hole and electronic conductivity exists in the LWO thin films, under oxidising and reducing conditions, respectively. This is due to an increased concentration of electron holes at high pO2 (eqn (2)) and a higher concentration of electrons at low pO2 (eqn (3)), in accordance with the following defect chemical equations:
 | (2) |
 | (3) |
The activation energy of the conductivity is essentially independent of the atmosphere and about 1 eV. A change from wet to dry Ar (last measurement) at 650 °C did not show significant variation in the conductivity, suggesting that protons are not the main charge carriers at this temperature.
The conductivities of LWO-2 (Fig. 9b) under wet conditions are quite comparable to those of LWO-1, although the LWO-2 conductivities are, in general, slightly higher. The conductivity of LWO-2 is weakly dependent on both pO2 (under wet conditions), and pH2O (in Ar). The variation of the conductivity with pH2O was measured isothermally at 650 °C to clarify the role of protons in LWO thin films deposited by ALD, and is reported in Fig. S2 in the ESI.† Some protonic conductivity exists at this temperature, but protons are not the main charge carriers.
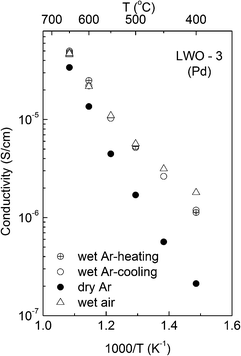 | ||
| Fig. 10 Variation of the (grain interior) conductivity with temperature for LWO-3. The list of atmospheres in the legend is given in chronological order for conducted measurements. | ||
The activation energy for the conductivity is in the range of 0.8–1 eV (for wet O2 and Ar atmospheres), while it increases to ∼1.1 eV under reducing conditions (see Fig. 9). The conductivity increases significantly from wet to dry 5%H2/Ar, suggesting that n-type conductivity becomes more significant due to the lower pO2 under dry reducing conditions.
From the in-plane conductivity measurements of both LWO-1 and LWO-2, we may conclude that LWO thin films deposited on MgO behave mainly as an oxide ion conductor between 650 and 900 °C, with a minor contribution from p-type conductivity under oxidizing conditions, protons under wet conditions, and more significant contribution from n-type electronic conductivity in highly reducing atmospheres.
The third LWO film sample deposited on a conducting Pd substrate (LWO-3) was measured using the cross-plane configuration in the temperature range of 400–650 °C. Only samples produced according to method 2 (annealed 40 nm LWO film on Pd prior to remaining LWO film deposition) could be utilized, as all the samples from method 1 systematically short-circuited after annealing. Representative Nyquist plots (Fig. S3†) and a system description can be found in the ESI.† In this configuration, the highest temperature measured was 650 °C in order to prevent short-circuiting between the top and bottom electrodes. The contact resistance in the same cell, used for low impedance measurements,24 was determined to be ∼1 mΩ at room temperature, and ∼3 mΩ at 850 °C. Therefore, it is assumed that the contact resistance in this configuration is negligible.
The variation in conductivity with temperature under different atmospheres for LWO-3 is shown in Fig. 10. The measurements are recorded on cooling, except for the first ramps in Ar, which were taken upon heating. It is remarkable that the conductivities upon heating and cooling in Ar are virtually identical, demonstrating high reproducibility of the results. The conductivity is essentially independent of pO2 from inert to oxidizing conditions, but dependent on pH2O. The conductivity increases with increasing pH2O and the dependence increases with decreasing temperature. This reflects that the concentration of protons and, accordingly, their contribution to the total conductivity, increase with decreasing temperature and increasing water vapor pressure, in accordance with the exothermic hydration reaction:
 | (4) |
It is interesting to note that the difference between wet and dry Ar at 650 °C corresponds well to the cross-plane measurements. At the lowest temperature measured here, the conductivity is essentially proportional to pH2O1/4, supporting the dominance of proton conductivity at this temperature under wet conditions.
The activation energy for the conductivity of LWO-3 decreases from ∼1.1 eV in dry Ar to ∼0.5–0.6 eV under wet conditions at the lowest temperatures (cf.Fig. 10). This is in accordance with a change in the dominating conducting species depending on the atmosphere and temperature: under dry conditions or wet conditions and high temperatures, the material is essentially dehydrated. Ionic conductivity is therefore dominated by oxide ions, in accordance with an activation energy of ∼1 eV. Under wet conditions and at lower temperatures, the LWO film becomes increasingly hydrated, and protons become the main charge carrier. This is in accordance with a lower activation energy (0.5–0.6 eV) and the value expected based on recent literature reports (the activation energy of mobility of protons in LWO56 is determined to be 0.6 eV).25 The conductivity does not change significantly when turning from wet air to wet 5%H2/Ar at 650 °C, although a complete temperature ramp could not be performed due to a short-circuit in the system when cooling from 650 to 600 °C.
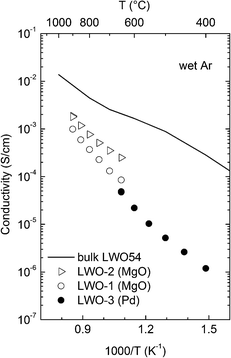 | ||
| Fig. 11 Comparison of electrical conductivity in wet Ar of ALD grown LWO thin films and bulk LWO54 as reported by Magrasó et al.5 | ||
From the cross-plane conductivity measurements, we may conclude that the LWO thin film deposited on Pd behaves mainly as an ionic conductor between 650 and 400 °C, with increasing dominance of protons under wet conditions at lower temperatures, and with a negligible contribution from electronic defects.
The conductivity characteristics of the LWO thin films are compared in Fig. 11 with bulk data of LWO54.5 First, it is interesting to highlight that the measurements of both in-plane and cross-plane measurements are very consistent with each other, essentially reproducing the overall behavior and activation energies. From the combined conductivity ramps, we may conclude that the LWO thin films in wet Ar mainly show ionic conductivity, with protons dominating at the lowest temperatures (∼400 °C), and oxide ions at higher temperatures (>650 °C). Although this is in general agreement with the grain interior properties of LWO, the temperature where dehydration occurs is much lower in the thin film, compared to the bulk. This indicates that the hydration reaction described in eqn (2) is less exothermic for the thin film. Another important difference between the film and the bulk material is the magnitude of the conductivity. It is evident from Fig. 11 that the conductivity is one or two orders of magnitude lower at high and low temperatures, respectively. Vøllestad et al.26 recently reported that LWO thin films deposited on a Pd substrate by pulsed laser deposition exhibited lower conductivities than bulk, however, their values (∼3 × 10⁻⁴ S cm−1 at 600 °C)26 are higher than those currently reported (∼2 × 10⁻⁵ S cm−1 at 600 °C) for wet conditions.
One may speculate whether the oxygen vacancies in the film are trapped, compared to the situation in the bulk material. A more plausible explanation may be related to doping. From the overall conductivity behavior it seems that a donor doping effect is present in both in-plane and cross-plane measurements: both the oxide ion and protonic conductivity are severely depleted while n-type electronic conductivity is enhanced. It has been reported that tungsten in LWO acts as a self-dopant.4,25 The donor doping effect of tungsten has been reported to decrease the ionic conductivity about one order of magnitude,5 in a similar manner to that encountered here at high temperatures. This, however, requires further investigation to be resolved.
Conclusions
Thin films of lanthanum tungstate (LWO) were produced using atomic layer deposition by combining the binary deposition processes of La2O3 and WO3. The precursor La(thd)3 in combination with ozone was used for deposition of La2O3. Deposition of WO3 using the cation precursors, WOCl4 and (tBuN)2(Me2N)2W(VI) (BMW), was investigated, where WOCl4 was found to provide growth on La2O3 and Al2O3, but not on itself, and was therefore not useful for LWO deposition. The cation precursor BMW in combination with water gave ALD-type growth between 275 and 325 °C, and was therefore utilized in the LWO deposition. A series of La–W–O films were deposited, for exploring the change in achieved composition with pulsing percentages. Films with La-pulsing percentage between 91.3 and 92.4% appeared to fall within the composition range for the proton conducting LWO phase, or a pulsed relationship of 10.5![[thin space (1/6-em)]](https://www.rsc.org/images/entities/char_2009.gif) :
:![[thin space (1/6-em)]](https://www.rsc.org/images/entities/char_2009.gif) 1 and 12
1 and 12![[thin space (1/6-em)]](https://www.rsc.org/images/entities/char_2009.gif) :
:![[thin space (1/6-em)]](https://www.rsc.org/images/entities/char_2009.gif) 1 between La(thd)3 and BMW.
1 between La(thd)3 and BMW.
1.2 and 0.9 μm thick crystalline films with a La-pulsing percentage of 91.4% were deposited on Pd and MgO, respectively. These were confirmed as the proton-conducting phase of LWO by XRD. The films were pin-hole free as-deposited. The LWO film on Pd cracked during annealing, causing short-circuiting in all cells for electrical characterization. An alternative deposition procedure was therefore devised, where a thin layer of LWO film (40 nm) was deposited on the substrate and subsequently annealed. A 1.16 μm LWO film was thereafter deposited on top of the annealed LWO film. This procedure was successful in avoiding short-circuiting of LWO films during electrical measurements, and the electrical properties were reproducibly measured both in cross-plane and in-plane configurations.
The LWO films behave mainly as an oxygen ion conductor at high temperatures, but mainly as a proton conductor at lower temperatures and under wet conditions, with some contributions from p-type conductivity under oxidizing conditions, and a more significant contribution from n-type electronic conductivity in highly reducing atmospheres. The in-plane and cross-plane measurements for films on MgO and Pd, respectively, are consistent. The magnitude and the temperature dependence of the conductivity in LWO films grown by ALD differ from the bulk values. This may be attributed to internal doping effects.
Acknowledgements
The authors would like to thank the Department of Geosciences at UiO for use of the XRF equipment, Antje Hoenen for assistance during electrode sputtering, Annett Thøgersen at SINTEF and Susmit Kumar at UiO for SEM images. This work is part of the EMALD (195233) KPN-project, funded by the Research Council of Norway, Protia, Innotech Solar and Baldur Coatings.Notes and references
- M. Yoshimura and J. F. Baumard, Mater. Res. Bull., 1975, 10, 983–988 CrossRef CAS.
- T. Shimura, S. Fujimoto and H. Iwahara, Solid State Ionics, 2001, 143, 117–123 CrossRef CAS.
- R. Haugsrud, Solid State Ionics, 2007, 178, 555–560 CrossRef CAS PubMed.
- A. Magrasó, J. M. Polfus, C. Frontera, J. Canales-Vazquez, L.-E. Kalland, C. H. Hervoches, S. Erdal, R. Hancke, M. S. Islam, T. Norby and R. Haugsrud, J. Mater. Chem., 2012, 22, 1762–1764 RSC.
- A. Magrasó, C. Frontera, D. Marrero-Lopez and P. Nunez, Dalton Trans., 2009, 10273–10283 RSC.
- R. Haugsrud and C. Kjolseth, J. Phys. Chem. Solids, 2008, 69, 1758–1765 CrossRef CAS PubMed.
- A. Magrasó, J. Power Sources, 2013, 240, 583–588 CrossRef PubMed.
- V. Gil, J. Gurauskis, C. Kjolseth, K. Wiik and M. A. Einarsrud, Int. J. Hydrogen Energy, 2013, 38, 3087–3091 CrossRef CAS PubMed.
- S. Escolastico, C. Solis, T. Scherb, G. Schumacher and J. M. Serra, J. Membr. Sci., 2013, 444, 276–284 CrossRef CAS PubMed.
- J. J. Roa, A. Magraso, M. Morales, P. Nunez and M. Segarra, Ceram. Int., 2011, 37, 1593–1599 CrossRef CAS PubMed.
- V. Gil, R. A. Strom, L. J. Groven and M. A. Einarsrud, J. Am. Ceram. Soc., 2012, 95, 3403–3407 CrossRef CAS PubMed.
- A. Magrasó, C. H. Hervoches, I. Ahmed, S. Hull, J. Nordstrom, A. W. B. Skilbred and R. Haugsrud, J. Mater. Chem. A, 2013, 1, 3774–3782 Search PubMed.
- E. Quarez, K. V. Kravchyk and O. Joubert, Solid State Ionics, 2012, 216, 19–24 CrossRef CAS PubMed.
- E. Quarez, Y. Oumellal and O. Joubert, Fuel Cells, 2013, 13, 34–41 CrossRef CAS.
- O. Nilsen, E. Rauwel, H. Fjellvag and A. Kjekshus, J. Mater. Chem., 2007, 17, 1466–1475 RSC.
- V. Miikkulainen, M. Leskela, M. Ritala and R. L. Puurunen, J. Appl. Phys., 2013, 113, 021301 CrossRef PubMed.
- P. Tägtström, P. Martensson, U. Jansson and J. O. Carlsson, J. Electrochem. Soc., 1999, 146, 3139–3143 CrossRef PubMed.
- R. Liu, Y. J. Lin, L. Y. Chou, S. W. Sheehan, W. S. He, F. Zhang, H. J. M. Hou and D. W. Wang, Angew. Chem., Int. Ed., 2011, 50, 499–502 CrossRef CAS PubMed.
- J. Malm, T. Sajavaara and M. Karppinen, Chem. Vap. Deposition, 2012, 18, 245–248 CrossRef CAS.
- M. Nieminen, M. Putkonen and L. Niinisto, Appl. Surf. Sci., 2001, 174, 155–165 CrossRef CAS.
- K. Knapas, A. Rahtu and M. Ritala, Chem. Vap. Deposition, 2009, 15, 269–273 CAS.
- M. Gerstl, E. Navickas, G. Friedbacher, F. Kubel, M. Ahrens and J. Fleig, Solid State Ionics, 2011, 185, 32–41 CrossRef CAS PubMed.
- H. Bae, J. Choi and G. M. Choi, Solid State Ionics, 2013, 236, 16–21 CrossRef CAS PubMed.
- J. Froitzheim, A. Magraso, T. Holt, M. W. Lundberg, H. F. Windisch, R. Berger, R. Sachitanand, J. Westlinder, J. E. Svensson and R. Haugsrud, ECS Trans., 2013, 57, 2187–2193 CrossRef PubMed.
- S. Erdal, L. E. Kalland, R. Hancke, J. Polfus, R. Haugsrud, T. Norby and A. Magraso, Int. J. Hydrogen Energy, 2012, 37, 8051–8055 CrossRef CAS PubMed.
- E. Vøllestad, A. Gorzkowska-Sobas and R. Haugsrud, Thin Solid Films, 2012, 520, 6531–6534 CrossRef PubMed.
Footnote |
| † Electronic supplementary information (ESI) available: Representative Nyquist plots, system descriptions and isothermal conductivity measurements. See DOI: 10.1039/c4ta03359k |
| This journal is © The Royal Society of Chemistry 2014 |

