
 Open Access Article
 This Open Access Article is licensed under a
 Creative Commons Attribution 3.0 Unported Licence
Facilitating hydroxide transport in anion exchange membranes via hydrophilic grafts†
Steve S.
He
and
Curtis W.
Frank
*
Dept. Chemical Engineering, Stanford University, CA 94305-4125, USA. E-mail: curt.frank@stanford.edu
First published on 5th August 2014
Abstract
Alkaline exchange membranes (AEMs) are a promising class of polyelectrolytes whose alkaline operating environment enables the use of non-precious metal catalysts in low-temperature fuel cells. However, their poor ionic conductivities, which are often an order of magnitude lower than traditional acidic membranes (e.g., Nafion), have limited their practicality. The performance problem can partially be ascribed to the poorly-defined morphologies of typical random copolymer AEMs, leading to tortuous ion transport pathways. Here, we show the ability to form nanoscale (5 to 10 nm diameter) anion transport channels by grafting hydrophilic poly(ethylene glycol) side-chains along a model benzyltrimethylammonium polysulfone-based AEM. Concomitant with the structure formation is a 100% increase in the IEC-normalized hydroxide conductivity from 20.2 mS g cm−1 mmol−1 to 40.3 mS g cm−1 mmol−1 as well as a 50% increase in the peak power density from 118 mW cm−2 to 180 mW cm−2 when incorporated into a fuel cell.
Introduction
Polymer electrolyte membrane fuel cells have been gaining scientific and commercial traction over the past several years owing to their promise of clean energy and high scalability. The most prominent devices employ proton exchange membranes (PEMs) operating under low pH conditions; however, this corrosive, acidic environment necessitates the use of platinum-group catalysts, severely limiting commercial feasibility. A potential solution is to use an anion exchange membrane (AEM) that transports hydroxide ions instead of protons, thereby creating an alkaline operating environment in which earth-abundant catalysts, such as nickel and manganese derivatives, exhibit suitable activity and stability.1,2 Although AEM technology has improved immensely in the past decade, AEM fuel cells continue to perform unfavorably compared to their PEM counterparts. The performance gap can be partially attributed to the lower ionic conductivities of AEMs, whose typical literature-reported values are often an order of magnitude lower than Nafion, the de facto standard PEM.3,4Given the high performance of acidic proton exchange membranes (PEM), it is no surprise that their structure and chemistry have heavily influenced AEM design. As in PEMs, the general motif for synthesizing AEMs has been to attach pendant ionic salts along a robust hydrophobic polymer backbone. This approach typically manifests as aryl- or benzyl- substituted cations along an aromatic polymer chain. Whereas sulfonate is the pendant counter-anion of choice for PEMs, the pendant counter-cation in AEMs has been more varied, with the aim of improving hydroxide conductivity and alkaline stability. Recent approaches have involved membranes based on quaternary ammonium,5–11 imidazolium,12 guanidinium,13 triazole,14 phosphonium15 and sulfonium cations,16 amongst others. Quaternary ammonium based on trimethylamine is by far the most widely studied of these pendant cation groups and has been introduced on an assortment of different polyaromatic backbones, including polysulfone,5–8 poly(phenylene oxide)9,10 and polyetheretherketone.11
However, in these systems, the close proximity of the pendant cation to the rigid polymer backbone inhibits the formation of strongly segregated hydrophilic–hydrophobic domains.17,18 Consequently, these membranes are often characterized by poorly defined water-rich phases, leading to ion transport occurring in highly constricted and tortuous pathways. A natural approach for improving AEM performance, then, is to design ionomers with better-defined ion transport domains19,20 by promoting strong microphase separation between the pendant counterion and the polymer backbone. Indeed, several groups have recently implemented this concept by introducing linear spacers either between the backbone and the counterion (a la Nafion)21 or as a side-chain of the counterion.9,22
Another avenue for modification is to graft side-chains along the same backbone as the pendant counterion. A recent study by Pan et al.23 showed that grafting alkyl chains along a model AEM polymer material facilitated clustering of the hydrophobic species, resulting in a interstitial water-rich ion transport “highway”. In this work, we show that structure formation in these random graft copolymer systems can be achieved through a different mechanism. Specifically, we show that introducing flexible, hydrophilic poly(ethylene glycol) (PEG) grafts along a typical pendant counterion-hydrophobic polyaromatic backbone ionomer can induce local phase separation and leads to enhanced hydroxide conductivity.
The synthetic approach we adopt is applicable to several AEMs previously reported in the literature. As a model system, we grafted PEG moieties along the highly-studied benzyltrimethylammonium-functionalized polysulfone (QA PSf) AEM to yield quaternary ammonium polysulfone-graft-poly(ethylene glycol) (QA PSf-g-PEGx) (Scheme 1). The design rationale for promoting phase separation is two-fold. First, the hydrophilic PEG graft has a repulsive χ interaction parameter with the hydrophobic polysulfone backbone and favorable interaction with water (highlighted by its reported use as a PEM humidifying agent24). Moreover, PEG's electron-rich ether groups have been shown to complex with cationic quaternary ammonium salts25,26 and are expected to interact favorably with the pendant benzyltrimethylammonium (BTMA) species along the polysulfone backbone. The culmination of these effects leads to co-localization and concentration of the quaternary ammonium groups into efficient, water-rich hydroxide transport domains, resulting in increased ionic conductivity.
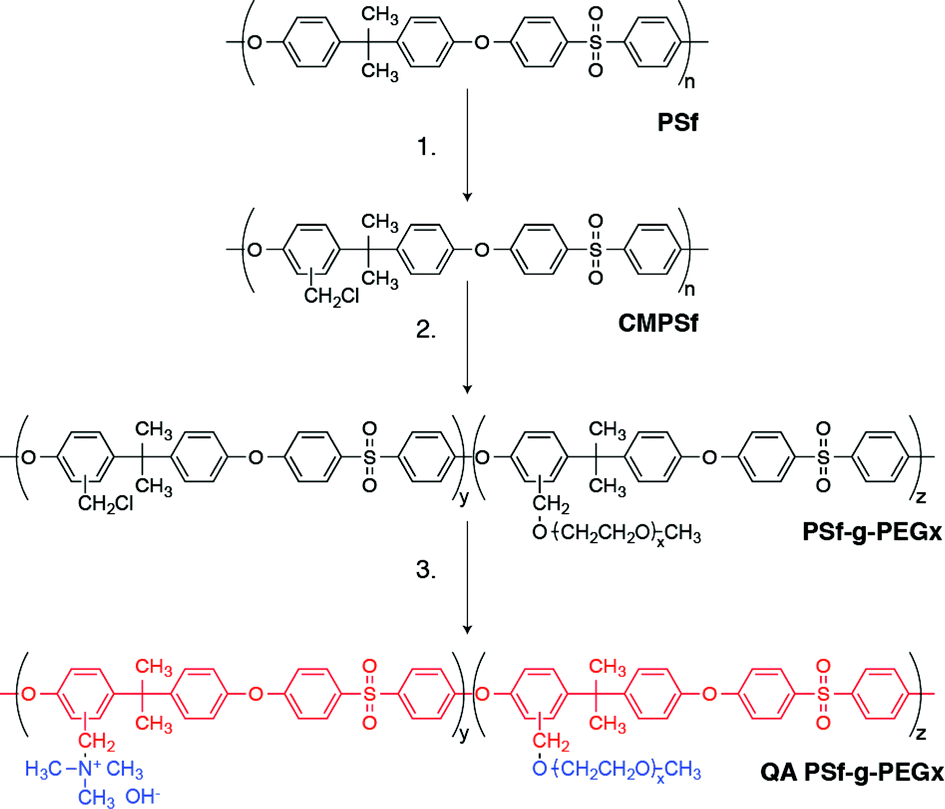 | ||
| Scheme 1 Synthesis of QA PSf-g-PEGx where ‘x’ corresponds to the molecular weight of the PEG graft. Red and blue denote hydrophobic and hydrophilic portions, respectively, of QA PSf-g-PEGx. | ||
Experimental section
Materials
All chemicals were used as purchased without further purification. Udel P3500 MB8 polysulfone was provided by Solvay Chemicals. Chlorotrimethylsilane, paraformaldehyde, poly(ethylene glycol) monomethyl ether, stannic chloride, trimethylamine (4.2 M in ethanol) and sodium hydride (60% w/w in mineral oil) were purchased from Sigma Aldrich. All solvents, including chloroform, dimethylformamide, ethanol, and petroleum ether were purchased from Fisher Scientific.Synthesis of QA PSf-g-PEGx
The synthesis of QA PSf-g-PEGx followed a three-step procedure outlined in Scheme 1 wherein polysulfone (Udel P3500 MB8) is sequentially chloromethylated, PEGylated, and finally quaternized with trimethylamine. The specific details of each step are as follows.Chloromethylation of polysulfone
The protocol for polysulfone chloromethylation was adapted from Avram et al.27 Chlorotrimethylsilane (42.5 mL) and paraformaldehyde (10.0 g) were added to a round-bottom flask containing a polysulfone solution (14.88 g polysulfone in 750 mL of chloroform). After 30 minutes of mixing, stannic chloride (0.392 mL) was added dropwise to the reaction solution. The reaction flask was then fitted with a reflux condenser and heated to 50 °C in a silicone oil bath; the mixture was stirred with heating for 48 to 72 hours, depending on the desired degree of substitution. Upon completion, excess reagents were filtered out and the filtrate was precipitated into ethanol with a 3![[thin space (1/6-em)]](https://www.rsc.org/images/entities/char_2009.gif) :1 ratio of ethanol to filtrate. The precipitate was then washed with excess ethanol and collected as a white powder. The powder was redissolved in chloroform, repurified following the precipitation process just described and dried in a vacuum desiccator at room temperature for 48 hours to yield chloromethylated polysulfone (CMPSf). The degree of chloromethylation was determined by 1H NMR.
:1 ratio of ethanol to filtrate. The precipitate was then washed with excess ethanol and collected as a white powder. The powder was redissolved in chloroform, repurified following the precipitation process just described and dried in a vacuum desiccator at room temperature for 48 hours to yield chloromethylated polysulfone (CMPSf). The degree of chloromethylation was determined by 1H NMR.
Pegylation of CMPSf
The PEGylation reaction follows the modified Williamson-Ether Synthesis described by Park et al.28 A typical PEGylation procedure is described as follows. In a nitrogen glove bag, 1.6 mmol of sodium hydride (60% w/w suspension in mineral oil) was first dissolved in THF at a concentration of 0.01 g mL−1, and then added to a 25% w/w poly(ethylene glycol) monomethyl ether (1.2 mmol) solution in THF. The reaction was allowed to proceed for 2 hours with stirring, after which it was added dropwise to a solution of chloromethylated polysulfone (1.0 g of DS 1.05 in 20 mL THF). The solution was reacted for 20 hours at room temperature and then precipitated into a 3:1 mixture of petroleum ether to ethanol. The precipitate was collected by vacuum filtration to yield polysulfone-graft-poly(ethylene glycol) monomethyl ether (PSf-g-PEG). The degree of PEGylation was determined by 1H NMR.
Quaternization of PSf-g-PEG
QA PSf-g-PEGx was synthesized by in situ quaternization of trimethylamine via the Menshutkin reaction. Specifically, trimethylamine (4.2 M in ethanol) was added dropwise to a solution of either chloromethylated polysulfone or polysulfone-graft-poly(ethylene glycol) (1 g in 10 mL DMF) at 3× molar excess. The reaction mixture was stirred under ambient conditions for 48 hours.Membrane fabrication
The aforementioned QA PSf-g-PEG solutions in DMF were filtered, cast onto 3 in. × 2 in. glass slides, and dried under vacuum for 48 hours to form membranes in the chloride form. These membranes were ion exchanged in a 0.5 M KOH solution for 48 hours and washed thoroughly with 18.2 MΩ cm MilliQ water prior to conductivity and MEA testing in order to remove excess KOH. The membranes were placed into a nitrogen-purged cell to prevent extensive conversion of the hydroxide anions into carbonate/bicarbonate species on reaction with atmospheric carbon dioxide.1H NMR characterization
All 1H NMR measurements were performed on a Varian Mercury 400 MHz FT-NMR using deuterated chloroform solvent. Integration values were normalized against either the bisphenol A methyl hydrogens or the β-hydrogens of the sulfone group.Ion Exchange Capacity (IEC)
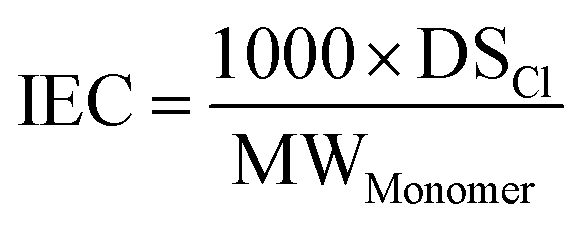
The theoretical IEC was calculated by the following equation:where DSCl is the average number of CH2Cl groups per polysulfone monomer (as determined by 1H NMR), and MWMonomer is the average molecular weight of a repeat unit considering the molecular weight and density of the PEG graft (see ESI†).
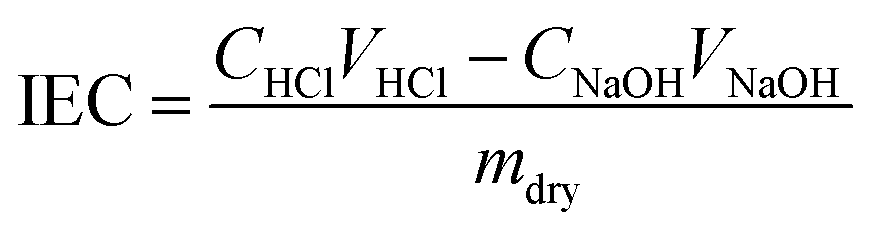
The IEC was also determined experimentally using a back-titration method. Here, membranes in the hydroxide form were immersed in 30 mL HCl (0.01 N) for 18 hours. The resulting solution was then titrated with NaOH (0.01 N) using phenolphthalein indicator. Following titration, the membrane was rinsed with 18.2 MΩ cm water, dried in a vacuum desiccator for 24 hours, and weighed. The experimental IEC was then be calculated by:
Conductivity measurements
In-plane conductivity was measured using a BekkTech BT-552 Conductivity Test System. In a typical test, a 5 mm wide strip of the polyelectrolyte film to be tested was placed in a BekkTech BT-112 conductivity cell with a 4-point probe setup. The cell was then loaded into a Fuel Cell Technologies 5 cm2 fuel cell test fixture under a 300 SCCM stream of fully hydrated nitrogen gas. A cyclic DC sweep between −0.15 to +0.15 V was applied with a Keithley 2400 sourcemeter. The resulting voltage–current data were linearly fit to determine the overall resistance of the film. The in-plane conductivity σ was then calculated from the measured resistance, R, given the film thickness, T, film width, W, and inter-electrode distance, L, via the following equation:
The temperature dependence of the conductivity was determined by ramping up the temperature in 5 °C to 10 °C intervals, holding the film at each temperature setpoint for 60 minutes to allow equilibration; the temperature of the water saturators were set equal to the temperature of the test cell to maintain 100% RH.
Water uptake
Water uptake (WU) measurements were performed at 22 °C. The hydrated mass was measured gravimetrically after immersing the membranes in 18.2 MΩ cm water for 1 hour. The dry mass was determined after drying the samples in a vacuum desiccator for 24 hours. The water uptake was then calculated by:The λ value was calculated via:

where the IEC used was based on the titrated value.

Alkaline stability
Stability measurements were performed by soaking sections of hydroxide-exchanged membranes in 1 M and 6 M KOH solutions at 60 °C. Samples were removed at various exposure times and rinsed thoroughly with 18.2 MΩ cm water prior to measurement. The in-plane conductivity was measured at 22 °C. The mass was measured gravimetrically after drying the samples in a vacuum desiccator for 12 to 24 hours.Fuel cell tests
The preparation of membrane electrode assemblies (MEAs) for fuel cell testing is described as follows. Anode catalyst ink was prepared by combining 11 mg of Pt/C (TKK TEC10E50E) and 26 μL ionomer solution (Fumion FAA-3) in 413 μL of a 60% v/v aqueous isopropanol solution. The cathode ink was prepared by combining 25 mg of PtIr/C (ETEK) and 59 μL ionomer solution in 938 μL of a 60% v/v aqueous isopropanol solution. The inks were sonicated for 10 minutes at room temperature and then painted onto 6.25 cm2 squares of woven carbon paper (Sigracet GDL35 BC) to a Pt loading of 0.5 mg cm−2 for the anode and 2 mg cm−2 for the cathode. The MEA was prepared by sandwiching the hydroxide-exchanged polyelectrolyte film between the anode and cathode in a Fuel Cell Technologies 5 cm2 fuel cell test fixture, with Teflon gaskets (0.25 mm thick) at both electrodes to prevent puncturing by the serpentine flow channels.MEA fuel cell performance was evaluated using a BekkTech BT-552 test system with a water-saturated gas flow rate of 200 SCCM O2 at the cathode and 150 SCCM H2 at the anode. An Agilent 6060B load box was used to apply a set load from 1.0 V to 0.200 V in increments of 0.05 V; the current was recorded after 60 seconds at each load setpoint to generate a polarization curve.
Small angle X-ray scattering (SAXS)
All SAXS measurements were performed on beam line 1–4 at the Stanford Synchrotron Radiation Lightsource, a Directorate of SLAC National Accelerator Laboratory. Fully hydrated samples in the chloride form were folded onto themselves to an approximate thickness between 0.5 mm to 1 mm, loaded into windowless Teflon sample holders, and subjected to 5 min exposure times. The beam center and sample-to-detector distance were calibrated using a silver behenate standard. Radial averaging and background subtraction of the raw scattering data were facilitated by the Nika package provided by Argonne National Laboratory.29 All data fitting were done in Igor Pro using an iterative Levenberg–Marquardt algorithm.Results and discussion
Synthesis
The 1H NMR spectrum of CMPSf in shown in Fig. 1a. Successful chloromethylation of polysulfone was verified by the emergence of a singlet at 4.52 ppm associated with the Ar–CH2–Cl hydrogens. The integration of this peak estimates an average of 1.14 chloromethyl groups per polysulfone monomer. | ||
| Fig. 1 1H NMR spectra of (a) CMPSf and (b) PSf-g-PEG350. | ||
A representative NMR spectrum of PSf-g-PEG350 is provided in Fig. 1b. The broad feature between 3.5 ppm and 3.8 ppm corresponds to the hydrogens in the –CH2CH2O– repeat unit. Integration of this peak gives 7.9 ethylene glycol repeat units per PEG350 side-chain, corresponding to a molecular weight ∼350 Da, as expected. The emergence of an additional peak at 4.46 ppm is a result of the partial conversion of Ar–CH2–Cl to Ar–CH2–PEG; integration of this peak gives an average degree of PEGylation of 0.22 PEG350 side-chains per polysulfone repeat unit. The singlet at 3.36 ppm represents the methoxy hydrogens terminating the end of each PEG monomethyl ether chain; integration of this peak quantifies the number of PEG chains in the membrane and was found to be 0.21. That the total number of PEG chains per repeat unit is equivalent (within error) to the PEG graft density verified that there were no excess, unreacted PEG reagents in the purified product. The graft density of ∼0.22 PEG350 chains per repeat unit translates to a mass composition of 12% w/w PEG350. A similar 1H NMR analysis performed on PSf-g-PEG750 reveals a graft density of ∼0.10 PEG750 chains per repeat unit, or a mass composition of 12% w/w PEG750.
Morphology
We performed small angle X-ray scattering (SAXS) to characterize the morphology of the PEGylated membranes. The SAXS profiles of QA PSf, QA PSf-g-PEG350 and QA PSf-g-PEG750 are shown in Fig. 2a. The absence of notable scattering features for QA PSf suggests a homogeneous morphology. This result is consistent with the expectation that the short methyl linkage between the polysulfone backbone and the quaternary ammonium species inhibits strongly separated hydrophobic–hydrophilic domains, and is corroborated by morphological studies of pendant BTMA in similar systems.9,30 On the other hand, the introduction of PEG grafts gives rise to a broad scattering peak in the mid-q region (0.1 nm−1 to 1 nm−1), indicating the formation of distinct microphase separated regions. This PEGylation-induced phase-separation is attributed to the strong χ repulsion between the flexible PEG graft and the PSf backbone. | ||
| Fig. 2 (a) Radially averaged SAXS data for QA PSf and QA PSf-g-PEGx. (b) Illustration of proposed morphological influence of the PEG grafts. Red and blue correspond to hydrophobic and hydrophilic regions, respectively. Restricted phase-separation in QA PSf (left) leads to poorly defined mesoscale morphology, resulting in tortuous ion transport. The inclusion of PEG grafts (right) leads to more well-defined phase-separated domains on the order of 5 to 10 nm in diameter, resulting in more efficient anion transport. | ||
The Teubner-Strey (TS) bi-continuous model was used to help elucidate the structure associated with the SAXS data. Originally developed to describe oil–water-surfactant microemulsions, this model has since been employed to study the structure of the ionomer phase in sulfonated PEMs.31–33 The microemulsion analogy is rationalized by the surfactant-like behavior of covalently bound hydrophobic–hydrophilic groups within the polymer and is supported by recent theoretical work on phase-separated random copolymer morphologies.34
The TS model proposes a structure factor of following form:
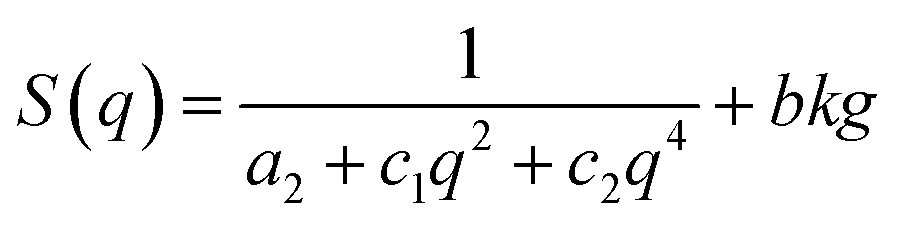
A regression fit of the structure factor proposed by this model to the QA PSf-g-PEGx scattering curves yielded excellent agreement (Fig. S1†), suggesting that the QA PSf-g-PEGx membranes adopt a mesostructure characterized by a percolating ionomer network co-continuous with a hydrophobic matrix.
The two distinct length scales associated with this fit are given by:
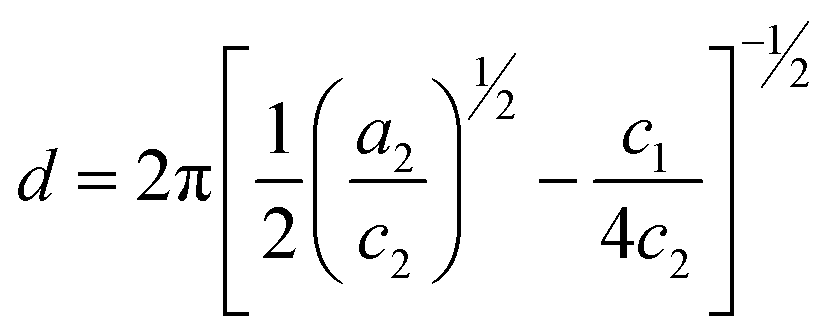
where d is a length scale representing a quasiperiodic spacing in the pair correlation function and can be physically interpreted as the average size of an ionomer domain;35ξ is a characteristic length for correlation falloff. The values of these length scales derived from the TS fit are listed in Table 1. The scattering data can be rationalized by the chain architecture for both QA PSf-g-PEG350 and QA PSf-g-PEG750. The larger domain size for QA PSf-g-PEG750 is ascribed to the longer contour length of the higher molecular weight PEG750 (5.8 nm) compared to PEG350 (2.8 nm). Water uptake in these hydrophilic channels results in swelling and domain sizes exceeding the contour length of the PEG grafts. An illustration of our morphological interpretation of the SAXS data is provided in Fig. 2b.

| IECa | σ | σ norm | d | ξ | |
|---|---|---|---|---|---|
| a IEC [mmol OH− g−1] determined by NMR and back-titration (in parentheses). b OH− Conductivity [mS cm−1] at 60 °C. c OH− Conductivity at 60 °C normalized against titrated IEC values [mS g cm−1 mmol−1]. d Domain spacing d [nm] and correlation length ξ [nm] from Teubner-Strey fitting of the SAXS scattering profiles. e Domain spacing d [nm] and correlation length ξ [nm] from Teubner-Strey fitting of the SAXS scattering profiles. | |||||
| QA PSf | 2.02 (1.98) | 40.0 | 20.2 | — | — |
| QA PSf-g-PEG350 | 1.50 (1.36) | 48.2 | 35.4 | 6.20 | 1.93 |
| QA PSf-g-PEG750 | 1.64 (1.57) | 63.2 | 40.3 | 7.86 | 1.63 |
The weaker domain correlation (as manifest in the lower ξ) of QA PSf-g-PEG750 can be explained by its lower PEG grafting density, which is roughly half that of QA PSf-g-PEG350 given the same PEG weight composition in the two systems. The larger average spacing between the PEG chains coupled with their random placement leads to decreased grafting regularity and diminished long-range interactions. This effect is again evidenced in the polydispersity of the domain sizes, as reflected by the ξ/d ratio, where a lower value corresponds to higher polydispersity. The ratio for QA PSf-g-PEG750 (0.20) is two-thirds of that for QA PSf-g-PEG350 (0.31), suggesting a broader distribution of hydrophilic domain sizes. In summary, PEGylation of QA PSf gives rise to a broad scattering feature analogous to that of a bi-continuous microemulsion; this scattering is attributed to microphase separation of hydrophilic, PEG-rich ionomer channels from the hydrophobic polysulfone matrix. Given the same weight composition, QA PSf-g-PEG350 has narrower, but less disperse domain sizes compared to QA PSf-g-PEG750.
Visual comparison between polysulfone-graft-poly(ethylene glycol) films with and without quaternary ammonium functionalization showed striking macroscopic differences (Fig. 3). The highly turbid PSf-g-PEG350 film suggests micron-scale phase-separation arising from the incompatibility between the PEG and PSf. In contrast, the introduction of benzyltrimethylammonium groups in QA PSf-g-PEG350 results in an optically clear film, indicating that the presence of the charged quaternary ammonium species inhibits macrophase-separation and underscores the interaction between the PEG and the pendant quaternary ammonium ions.
 | ||
| Fig. 3 Photographs of PSf-g-PEG350 (top) and QA PSf-g-PEG350 (bottom) films. | ||
Scaling analysis
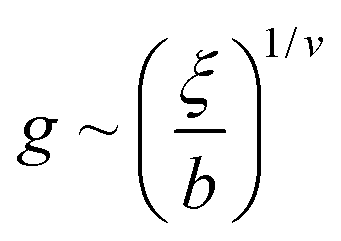
The Alexander-de Gennes scaling theory describes the physical conformations of surface-tethered polymer chains. This theory contends that the thickness (or extensional length) H of the polymer brush scales aswhere N is the single-chain molecular weight, g is the size of a de Gennes blob and ξ is the correlation length defined by the average distance between grafting points.

We adopted the principles of this scaling analysis to elucidate the local structure of the anion transport domains by modelling the graft-copolymer architecture of QA PSf-g-PEGx as a simple one-dimensional polysulfone main-chain with tethered PEG side-chains. In this case, the correlation length simply scales inversely with the linear graft density Λ:

where b is the Kuhn length of the graft and v is the Flory scaling exponent. Hence, we have the following scaling relationship between the brush thickness, H, and the linear graft density, Λ:
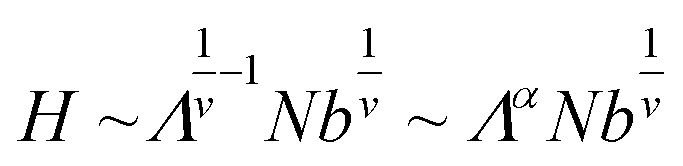
Here, α is the scaling exponent relating brush thickness and graft density and is equal to 0.7 assuming real chains in a good solvent (i.e., v = 0.588).
From our SAXS data, we posit that the domain size d ∼ H and assume that both PEG350 and PEG750 have the same Kuhn length b. Moreover, we note that at the same weight composition, the linear graft density ratios should simply be the inverse of the molecular weights. With these assumptions, we arrive at the following relationship:
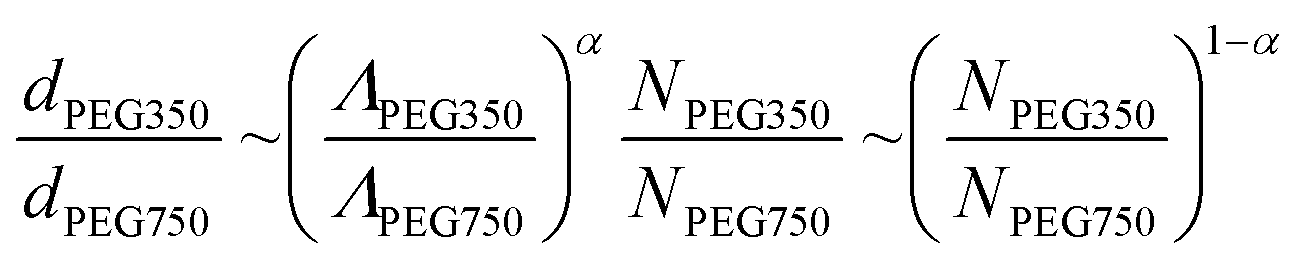
Inputting the empirical domain sizes and molecular weights of the PEG grafts, we find that α = 0.689, which is very close to the α = 0.7 value assuming real chains in a good solvent.
The close conformity between the empirical scattering data and the Alexander-de Gennes scaling theory suggests that the PEG side-chains adopt a brush-like conformation in the ionomer channels. This local structure can be rationalized by the thermodynamic propensity of the hydrophilic PEG side-chains to extend away from the hydrophobic PSf backbone and into a water-rich region upon hydration.
Hydroxide conductivity
Hydroxide conductivity is a critical performance metric for AEMs. The hydroxide conductivity of un-PEGylated QA PSf was 40.0 mS cm−1 at 60 °C, consistent with previously reported data in the literature.36 The introduction of 12% w/w PEG350 and PEG750 grafts increased the conductivity to 48.2 mS cm−1 and 63.2 mS cm−1, respectively. The temperature dependence of the hydroxide conductivities followed an Arrhenius trend (Fig. 4). Concomitant with the higher hydroxide conductivity was a decrease in the apparent Arrhenius activation energy, from 17.5 kJ mol−1 (QA PSf) to 15 kJ mol−1 (QA PSf-g-PEG350) and 11.2 kJ mol−1 (QA PSf-g-PEG750). The enhanced performance with PEGylation supports the notion that a microphase-separated structure is beneficial to ion transport. | ||
| Fig. 4 Temperature dependence of hydroxide conductivity for QA PSf and QA PSf-g-PEGx at 100% RH. The dashed lines represent Arrhenius fits. | ||
The structural influence on the enhanced performance is underscored by comparing the ion exchange capacities (IEC) of the materials (Table 1). Of particular interest is that the PEGylated membranes have lower IECs than QA PSf. While a decrease in IEC typically manifests in decreased ionic conductivity as a result of lower charge content, both QA PSf-g-PEG350 and QA PSf-g-PEG750 show increased performance. Hydroxide conductivity normalized by the IEC has been used as a qualitative metric for assessing ion transport efficacy16,37,38 and is presented in Table 1. PEGylation increases the IEC normalized conductivity by 81% and 100% for QA PSf-g-PEG350 and QA PSf-g-PEG750, respectively, highlighting the influence of structure formation on ion transport properties.
Water uptake
Water content strongly influences conductivity in ion exchange membranes. Generally, under moderate water uptake conditions (e.g., barring notable dilution of ion concentration, mechanical degradation of the membrane, etc.), ionic conductivity scales directly with water content.3Table 2 presents the water uptake data for the prepared membranes.Despite the presence of hydrophilic PEG grafts, the PEGylated membranes nonetheless exhibit lower water uptake compared to bare QA PSf due to their significantly lower IECs. That the influence of ion concentration on water uptake outweighs that of PEG incorporation is unsurprising given that the ion-dipole interaction associated with quaternary ammonium cation solvation is stronger than the hydrogen-bonding interaction involved in PEG hydration. This effect is evident in the hydration numbers of their small molecule analogs. The tetramethylammonium cation has been calculated to have a hydration number of approximately 23;39 in comparison, PEG is estimated to contain a maximum of one bound water molecule per ethylene oxide repeat unit via hydrogen bonding at the ether position.40
The λ parameter denotes the average number of water molecules per pendant BTMA group. Whereas bare QA PSf has λ = 41, QA PSf-g-PEG350 and QA PSf-g-PEG750 have λ = 33 and 34, respectively. Juxtaposing the λ values for the different samples against their conductivities, it becomes clear that PEGylation yields higher conductivities at lower water content. This effect is highlighted by the λ-normalized conductivities, where QA PSf-g-PEG350 and QA PSf-g-PEG750 show 77% and 133% improvements over QA PSf. This increase in efficiency again corroborates the idea that PEGylation-induced structure formation is facilitating hydroxide transport.
Alkaline stability
Quaternary ammonium polysulfone AEMs are known to have questionable alkaline stability. It is well established that the benzyltrimethylammonium cations in these AEMs are subject to nucleophilic attack by hydroxide anions, resulting in decreases in ion concentration and conductivity.41 Moreover, Arges et al. have shown that the polysulfone backbone, otherwise stable at high pH, becomes vulnerable to hydrolytic cleavage upon quaternary ammonium functionalization, leading to embrittlement and mechanical degradation.42 In practice, the extent and rate of degradation is subject to environmental conditions (e.g., pH, temperature, etc.) and chemical makeup (e.g., grafting degree, IEC, etc.). Here we aim to assess the effects, if any, that PEGylation may have on alkaline stability, again using QA PSf as a baseline for comparison. Specifically, we exposed all three membranes to accelerated degradation conditions (1 M and 6 M KOH solutions at 60 °C) and monitored changes in both the mass (Fig. 5a) and ionic conductivity (Fig. 5b) over time. | ||
| Fig. 5 Stability of samples exposed to 1 M and 6 M solutions of KOH at 60 °C as characterized by changes in (a) gravimetric mass and (b) in-plane conductivity at 22 °C. | ||
Exposure to extremely caustic conditions (6 M KOH) resulted in the rapid degradation of all membranes. The significant mass loss (>20%) for all samples after 24 hours of exposure is attributed primarily to the degradation of the quaternary ammonium-functionalized polysulfone backbone. This effect was manifest physically in the embrittlement and discoloration (yellowing) of the samples. Ultimately, all samples shattered into several pieces after removal from the conductivity cell at the 24 hour mark. It has been suggested that the primary mechanism for quaternary ammonium polysulfone backbone degradation under these conditions is hydrolytic cleavage of the ether bond which is weakened by the electron withdrawing effects of the quaternary ammonium and sulfone functionalities.42 Hence, a priori we had expected that the PEG graft would stabilize this ether bond via the electron donating potential of the PEG ether oxygen. However, the rapid degradation for all samples indicates that PEGylation had minimal effect on the mechanical robustness of the samples under these accelerated conditions. Similarly, the conductivity of all samples dropped precipitously (>40%) within 24 hours attributed to a combination of severe mechanical degradation (via attack on the polysulfone backbone) and decrease in ion concentration (via attack on the quaternary ammonium cation).
Testing under mild alkaline conditions (1 M KOH) revealed slight stability differences between QA PSf and QA PSf-g-PEGx. Whereas QA PSf lost nearly a quarter of its mass and became brittle over a 5 day period, the PEGylated membranes retained 85–90% of their initial mass and remained flexible, suggesting improved backbone stability. Although differences in cation stability, as inferred by the conductivity drop, were notable after a 5 day exposure period (e.g., 12% retained conductivity for QA PSf vs. 29% for QA PSf-g-PEG350), they were nonetheless pragmatically insufficient given that all membranes lost more than 70% of their initial conductivity. We note that the degradation rate of the membranes were directly related to their IECs, with QA PSf-g-PEG350 showing the highest stability with an initial IEC of 1.36 mmol OH− g−1 and QA PSf showing the lowest stability with an initial IEC of 1.98 mmol OH− g−1. As such, the moderate stability improvement of the PEGylated membranes under these conditions is likely due to their lower charge concentrations (i.e., IEC).
Ultimately, our data suggests that the PEG grafts had marginal influence on overall alkaline stability. While the PEG side-chains do not accelerate the degradation of the membranes, they nevertheless do not resolve the inherent robustness issues associated with both the polysulfone backbone and the benzyltrimethylammonium cation. As noted previously, while we used QA PSf as a platform for testing our design strategy, the synthesis is inherently adaptable to other aromatic backbones and cationic functional groups. Thus, using a more stable backbone (e.g., poly(phenylene oxide)43) and/or cation (e.g., phosphonium37 or sulfonium16) may yield more practical materials.
Fuel cell performance
Membrane electrode assemblies (MEAs) using the PEGylated membranes were fabricated to assess prototypical H2/O2 fuel cell performance. MEA performance of the PEGylated membranes, as characterized by the polarization and power density curves (Fig. 6), mirrors their enhanced hydroxide conductivity. The introduction of PEG grafts yielded up to a 50% increase in the peak power density from 120 mS cm−2 for QA PSf to 183 mS cm−2 for QA PSf-g-PEG750 as a result of a more efficient ion transport architecture. | ||
| Fig. 6 Polarization and power density curves of MEAs fabricated using QA PSf and QA PSf-g-PEGx membranes (60 °C, 100% RH). | ||
The theoretical open circuit voltage (OCV) is the water-splitting potential (∼1.2 V). Deviations from the ideal OCV are commonly attributed to catalytic overpotentials and fuel crossover. The OCV for all the MEAs were approximately 1.0 V and did not change noticeably with the introduction of the PEG side-chains, indicating that any effect on H2/O2 permeability resulting from the morphological and chemical changes induced by the PEG grafts were negligible.
Conclusions
We have demonstrated that grafting hydrophilic poly(ethylene glycol) chains along a benzyltrimethylammonium polysulfone AEM can promote nanoscale hydrophobic–hydrophilic domain formation. Co-localization and concentration of the ion conducting quaternary ammonium moieties as a result of this phase separation results in the formation of a percolating, water-rich anion transport phase, leading to more efficient hydroxide transport as demonstrated by increased in-plane conductivity and device performance.A scaling analysis suggests that the local, nanoscale structure is characterized by a brush-like conformation of the poly(ethylene glycol) grafts; this architecture is rationalized by the thermodynamic propensity of the hydrophilic sidechains to repel themselves from the hydrophobic backbone and extend into water-rich regions upon hydration. Energetic frustrations arising from the random grafting of the sidechains result in a lack of structures at length-scales greater than that of the nanometer-sized domains. Consequently, as demonstrated by a close agreement of the SAXS data with the Teubner-Strey model, the mesoscale morphology is characterized by a percolating network of these nanoscale anion transport domains within a continuous hydrophobic matrix.
We chose benzyltrimethylammonium polysulfone as a model system for our study due to the availability of several literature sources against which we could benchmark and verify our data. However, we believe the same thermodynamic considerations and design rationale can be applied to similar polyaromatic backbones (e.g., polyphenylsulfone) as well as to other ion exchange groups (e.g., imidazolium). Moreover, because the PEGylation chemistry shares the same alkyl halide reactive site that is commonly used to quaternize tertiary amines, the synthesis is inherently adaptable to several polyaromatic systems reported in the literature. Ultimately, we hope that this grafting approach offers new design considerations for future polyelectrolyte membranes.
Acknowledgements
This work was supported by the TomKat Center for Sustainable Energy. Portions of this research were carried out at the Stanford Synchrotron Radiation Lightsource, a Directorate of SLAC National Accelerator Laboratory and an Office of Science User Facility operated for the U.S. Department of Energy Office of Science by Stanford University. We wish to thank Desmond Ng and Thomas Jaramillo for advice on MEA fabrication and testing.Notes and references
- S. Lu, J. Pan, A. Huang, L. Zhuang and J. Lu, Proc. Natl. Acad. Sci. U. S. A., 2008, 105, 20611–20614 CrossRef CAS
.
- J. W. Desmond Ng, Y. Gorlin, T. Hatsukade and T. F. Jaramillo, Adv. Energy Mater., 2013, 3, 1545–1550 CrossRef CAS PubMed
- G. Merle, M. Wessling and K. Nijmeijer, J. Membr. Sci., 2011, 377, 1–35 CrossRef CAS PubMed
- J. R. Varcoe and R. C. T. Slade, Fuel Cells, 2005, 5, 187–200 CrossRef CAS PubMed
- J. Wang, Z. Zhao, F. Gong, S. Li and S. Zhang, Macromolecules, 2009, 42, 8711–8717 CrossRef CAS
-
C. G. Arges, M.-S. Jung, G. Johnson, J. Parrondo, and V. Ramani, in ECS Transactions, 2011, vol. 41, pp. 1795–1816 Search PubMed
- J. Pan, S. Lu, Y. Li, A. Huang, L. Zhuang and J. Lu, Adv. Funct. Mater., 2010, 20, 312–319 CrossRef CAS PubMed
- M. R. Hibbs, M. A. Hickner, T. M. Alam, S. K. McIntyre, C. H. Fujimoto and C. J. Cornelius, Chem. Mater., 2008, 20, 2566–2573 CrossRef CAS
- N. Li, T. Yan, Z. Li, T. Thurn-Albrecht and W. H. Binder, Energy Environ. Sci., 2012, 5, 7888–7892 CAS
- N. T. Rebeck, Y. Li and D. M. Knauss, J. Polym. Sci., Part B: Polym. Phys., 2013, 51, 1770–1778 CrossRef CAS PubMed
- H. Zarrin, J. Wu, M. Fowler and Z. Chen, J. Membr. Sci., 2012, 394–395, 193–201 CrossRef CAS PubMed
- F. Zhang, H. Zhang and C. Qu, J. Mater. Chem., 2011, 21, 12744–12752 RSC
- Q. Zhang, S. Li and S. Zhang, Chem. Commun., 2010, 46, 7495–7497 RSC
- N. Li, M. D. Guiver and W. H. Binder, ChemSusChem, 2013, 6, 1376–1383 CrossRef CAS PubMed
- S. S. Gu, R. Cai, T. Luo, Z. Chen, M. Sun, Y. Liu, G. He and Y. Yan, Angew. Chem., Int. Ed., 2009, 48, 6499–6502 CrossRef CAS PubMed
- B. Zhang, S. Gu, J. Wang, Y. Liu, A. M. Herring and Y. Yan, RSC Adv., 2012, 2, 12683–12685 RSC
- J. Ran, L. Wu and T. Xu, Polym. Chem., 2013, 4, 4612–4620 RSC
- M. Tanaka, K. Fukasawa, E. Nishino, S. Yamaguchi, K. Yamada, H. Tanaka, B. Bae, K. Miyatake and M. Watanabe, J. Am. Chem. Soc., 2011, 133, 10646–10654 CrossRef CAS PubMed
- Z. Zhao, J. Wang, S. Li and S. Zhang, J. Power Sources, 2011, 196, 4445–4450 CrossRef CAS PubMed
- N. Li and M. D. Guiver, Macromolecules, 2014, 47, 2175–2198 CrossRef CAS
- M. Tomoi, K. Yamaguchi, R. Ando, Y. Kantake, Y. Aosaki and H. Kubota, J. Appl. Polym. Sci., 1997, 64, 1161–1167 CrossRef CAS
- N. Li, Y. Leng, M. A. Hickner and C.-Y. Wang, J. Am. Chem. Soc., 2013, 135, 10124–10133 CrossRef CAS PubMed
- J. Pan, C. Chen, Y. Li, L. Wang, L. Tan, G. Li, X. Tang, L. Xiao, J. Lu and L. Zhuang, Energy Environ. Sci., 2014, 7, 354–360 CAS
- B. Yameen, A. Kaltbeitzel, A. Langer, F. Müller, U. Gösele, W. Knoll and O. Azzaroni, Angew. Chem., Int. Ed., 2009, 48, 3124–3128 CrossRef CAS PubMed
- E. Bortel and A. Kochanowski, Die Makromol. Chemie, 1984, 185, 1409–1417 CrossRef CAS PubMed
- J. Kang, W. Li, X. Wang, Y. Lin, X. Xiao and S. Fang, Electrochim. Acta, 2003, 48, 2487–2491 CrossRef CAS
- E. Avram, E. Butuc, C. Luca and I. Druta, J. Macromol. Sci., Part A: Pure Appl.Chem., 1997, 34, 1701–1714 CrossRef
- J. Y. Park, M. H. Acar, A. Akthakul, W. Kuhlman and A. M. Mayes, Biomaterials, 2006, 27, 856–865 CrossRef CAS PubMed
- J. Ilavsky, J. Appl. Crystallogr., 2012, 45, 324–328 CrossRef CAS
- J. Yan and M. A. Hickner, Macromolecules, 2010, 43, 2349–2356 CrossRef CAS
- J. M. Serpico, S. G. Ehrenberg, J. J. Fontanella, X. Jiao, D. Perahia, K. A. McGrady, E. H. Sanders, G. E. Kellogg and G. E. Wnek, Macromolecules, 2002, 35, 5916–5921 CrossRef CAS
- M. Yoonessi, H. Heinz, T. D. Dang and Z. Bai, Polymer, 2011, 52, 5615–5621 CrossRef CAS PubMed
- M.-P. Nieh, M. D. Guiver, D. S. Kim, J. Ding and T. Norsten, Macromolecules, 2008, 41, 6176–6182 CrossRef CAS
- B. Steinmüller, M. Müller, K. R. Hambrecht, G. D. Smith and D. Bedrov, Macromolecules, 2012, 45, 1107–1117 CrossRef
- S. H. Chen, S. L. Chang and R. Strey, J. Appl. Crystallogr., 1991, 24, 721–731 CrossRef CAS
- C. G. Arges, J. Parrondo, G. Johnson, A. Nadhan and V. Ramani, J. Mater. Chem., 2012, 22, 3733–3744 RSC
- S. Gu, R. Cai, T. Luo, K. Jensen, C. Contreras and Y. Yan, ChemSusChem, 2010, 3, 555–558 CrossRef CAS PubMed
- S. Gu, R. Cai and Y. Yan, Chem. Commun., 2011, 47, 2856–2858 RSC
- L. García-Tarrés and E. Guàrdia, J. Phys. Chem. B, 1998, 102, 7448–7454 CrossRef
- S. Lüsse and K. Arnold, Macromolecules, 1996, 29, 4251–4257 CrossRef
-
Y. Ye and Y. A. Elabd, Polymers for Energy Storage and Delivery: Polyelectrolytes for Batteries and Fuel Cells, American Chemical Society, Washington, DC, 2012, vol. 1096 Search PubMed
- C. G. Arges and V. Ramani, Proc. Natl. Acad. Sci. U. S. A., 2013, 110, 2490–2495 CrossRef CAS PubMed
- A. Amel, L. Zhu, M. Hickner and Y. Ein-Eli, J. Electrochem. Soc., 2014, 161, F615–F621 CrossRef CAS PubMed
Footnote |
| † Electronic supplementary information (ESI) available: Teubner-Strey fit. See DOI: 10.1039/c4ta02942a |
| This journal is © The Royal Society of Chemistry 2014 |