 Open Access Article
Creative Commons Attribution 3.0 Unported Licence
Development of new anode composite materials for fluoride ion batteries†
C.
Rongeat
a,
M.
Anji Reddy
ab,
T.
Diemant
c,
R. J.
Behm
bc and
M.
Fichtner
*ab
aKarlsruhe Institute of Technology (KIT), Institute of Nanotechnology, Hermann-von-Helmholtz-Platz 1, D-76344 Eggenstein-Leopoldshafen, Germany. E-mail: m.fichtner@kit.edu
bHelmholtz Institute Ulm (HIU) for Electrochemical Energy Storage, Albert-Einstein-Allee 11, D-89081 Ulm, Germany
cUlm University, Institute of Surface Chemistry and Catalysis, Albert-Einstein-Allee 47, D-89081 Ulm, Germany
First published on 23rd September 2014
Abstract
Due to their high theoretical energy density values, Fluoride Ion Batteries (FIB) are interesting alternatives to Li-ion batteries. Recently, results have been reported on the reversible charge and discharge of such systems using a solid electrolyte, various metal fluorides as cathode materials and Ce metal as the anode. The work in the present study is focused on the development of new anode materials which do not contain Li. To facilitate cell preparation and material handling, cells were prepared in the discharged state with Bi or Cu as the cathode material and CeF3, CaF2 or MgF2 as potential anode materials. The charge and discharge mechanisms were examined by detailed ex situ X-ray diffraction (XRD) and X-ray photoelectron spectroscopy (XPS) experiments. The best cycling performances were obtained with MgF2 but prepared in the half-discharged state (i.e. mixed with Mg), thus forming a composite that could provide better interface contacts between the different reactive phases. The results showed that apart from choosing carefully the electrode active materials, it is also important to optimise the architecture of the electrodes.
Introduction
The increasing demand for high energy storage systems has prompted the interest in alternative chemistry for new battery systems,1–5 with better performances than the currently used Li-ion batteries. Recently, the reversible charge and discharge of batteries based on a fluoride shuttle has been demonstrated for a relatively moderate temperature and with reasonable performances.6 Such a Fluoride Ion Battery (FIB) has a high theoretical energy density, of up to more than 5000 W h L−1 for some electrode combinations. This type of battery is still at an early stage of development and large improvements are needed concerning the performance of the electrodes, as well as of the electrolyte. The capacities do not reach the maximum theoretical values and fade quickly during cycling. In the first study by Anji Reddy and Fichtner,6 the electrodes were composite materials where the active materials were mixed with carbon for good electronic conductivity and in some cases with the electrolyte to ensure a good ionic conductivity. Such cells were made using solid electrolytes composed of doped fluoride salts implying the need for operating the cells at elevated temperatures. Alkaline-earth fluorides having a fluorite-type structure (BaF2, SrF2 or CaF2) or rare-earth fluorides having a tysonite-type structure (LaF3, CeF3) are potential candidates for electrolytes. Previous studies have shown that it is possible to improve the ionic conductivity of doped-BaF2 by preparing a nanostructured material using ball milling.7–11 Higher conductivity values were also achieved using LaF3-based compounds, especially after heat treatment performed to obtain the appropriate microstructure.12 For this last type of material, the formation of a nanostructured compound did not appear to provide any advantage to the ionic conductivity. Recently, the first example of a liquid electrolyte for F anion conduction has also been developed.13 Although further improvements are necessary in this direction, the development of liquid electrolytes opens new possibilities to operate a FIB at room temperature and increase the interest for developing new electrode materials as well.A few earlier examples of FIBs have already been reported in the literature mostly for primary cells (only discharge). For example, using a thin film geometry, Kennedy and Hunter14 prepared a primary cell using Pb as the anode, PbF2 as the electrolyte and CuF2 as the cathode (mixed with PbF2 to ensure good ionic conductivity). They were able to discharge this cell at room temperature to a maximum of 40% of the theoretical capacity. However, the voltage was rather low (0.4–0.5 V). Similar results have been reported for a cell with BiO0.09F2.82 as the cathode instead of CuF2.15 Other studies have shown that better discharge performances could be obtained using a doped-Ca anode16,17 instead of the pure Ca anode and that a voltage of ca. 3 V could be reached with BiO0.1F2.8 as the cathode. Higher capacities have been reported by Potanin18 using La or Ce as the anode, doped LaF3 or CeF3 as the electrolyte and doped PbF2 or BiF3 as the cathode. The first discharge delivered ca. 130 mA h g−1 (PbF2) or ca. 200 mA h g−1 (BiF3) at around 2–2.5 V but using rather high temperatures (500 °C). To the best of our knowledge, only a few examples of rechargeable FIBs have been described. For instance, Danto et al.19 prepared such a cell from submicron films of Bi and PbF2 that were deposited on top of each other and first charged to obtain the desired structure Pb/PbF2/BiF3/Bi. It was possible to perform a few cycles of discharge and charge (with Pb as the anode, PbF2 as the electrolyte and BiF3 as the cathode) but with low capacities and at a voltage of 250–300 mV with a current density of 40 μA cm−2.
In the recent study mentioned above,6 different types of metal fluorides were tested as cathodes: BiF3, CuF2, SnF2 or KBiF4 and Ce metal was used as the anode. Especially with BiF3 as the cathode, it was possible to obtain dozens of charge/discharge cycles. However, Ce metal, as well as other potential anode materials like La, Ca, Li or Mg, are sensitive to surface oxidation, even when stored in an Ar filled glove box. This may lead to rapid degradation of the performance of these materials when used as anodes. In the present study, we therefore decided to prepare electrode materials in the discharged state to investigate new anode materials, using mostly Bi metal as a precursor for the cathode. We prepared several composite materials and analysed their cycling performances. Different characterization techniques were used to understand the different reactions taking place in the electrodes during charge and discharge.
Experimental
Materials preparation
All material handling was performed in an inert atmosphere in an Ar filled glove box with recirculation. LaF3 (anhydrous, 99.9% (REO)), CeF3 (anhydrous, 99.9% (REO)), BaF2 (99.9%), CaF2 (99.7%) and Mg (99.6%) were obtained from Alfa Aesar. MgF2 (99.9%) and Bi (99%) were obtained from Sigma Aldrich and Cu nanoparticles (99.9%) were obtained from Sky Spring Nanomaterials, Inc. Cathode, anode and electrolyte materials were prepared by ball milling under an Ar atmosphere at 600 rpm in a Si3N4 vial (ball-to-powder ratio 12![[thin space (1/6-em)]](https://www.rsc.org/images/entities/char_2009.gif) :
:![[thin space (1/6-em)]](https://www.rsc.org/images/entities/char_2009.gif) 1) using a planetary-type mill (Fritsch Pulverisette 6). The starting powders were dried at appropriate temperatures (typically 250 °C) in a vacuum for several hours prior to milling. The tysonite-type La0.9Ba0.1F2.9 electrolyte was prepared by ball milling of a mixture of LaF3 and BaF2 for 12 h.12 The cathode material was a composite of Bi or Cu (30 wt%) mixed with La0.9Ba0.1F2.9 (60 wt%) and C (10 wt%) to ensure both ionic and electronic conductivity. Different anode composites were tested based on CeF3, CaF2 and MgF2 compounds. For the preparation of electrode composites containing the electrolyte, an appropriate amount of the BaF2 + LaF3 mixture was ball milled for 4 h and then addition of Bi or Cu or MgF2 and C and milling for another 12 h were performed. The compositions and the preparation of the different anode composites are given in Table 1. CeF3- and CaF2-based anode materials can be used without adding a fraction of the electrolyte as both compounds are ionic conductors for fluoride anions. Table S1 (see †) summarises some relevant theoretical properties for the different electrode active materials.
1) using a planetary-type mill (Fritsch Pulverisette 6). The starting powders were dried at appropriate temperatures (typically 250 °C) in a vacuum for several hours prior to milling. The tysonite-type La0.9Ba0.1F2.9 electrolyte was prepared by ball milling of a mixture of LaF3 and BaF2 for 12 h.12 The cathode material was a composite of Bi or Cu (30 wt%) mixed with La0.9Ba0.1F2.9 (60 wt%) and C (10 wt%) to ensure both ionic and electronic conductivity. Different anode composites were tested based on CeF3, CaF2 and MgF2 compounds. For the preparation of electrode composites containing the electrolyte, an appropriate amount of the BaF2 + LaF3 mixture was ball milled for 4 h and then addition of Bi or Cu or MgF2 and C and milling for another 12 h were performed. The compositions and the preparation of the different anode composites are given in Table 1. CeF3- and CaF2-based anode materials can be used without adding a fraction of the electrolyte as both compounds are ionic conductors for fluoride anions. Table S1 (see †) summarises some relevant theoretical properties for the different electrode active materials.
| Anode short name | Composition | Milling duration | Remarks |
|---|---|---|---|
| CeF3 | 90 wt% CeF3 | 12 h | As-received CeF3 |
| 10 wt% C black | |||
| CaF2 | 90 wt% Ca0.6La0.4F2.4 | 12 h | Ca0.6La0.4F2.4 prepared by milling CaF2 and LaF3 for 48 h before |
| 10 wt% C black | |||
| MgF2 | 30 wt% MgF2 | 12 h | La0.9Ba0.1F2.9 prepared by milling LaF3 and BaF2 for 4 h before |
| 60 wt% La0.9Ba0.1F2.9 | |||
| 10 wt% C black | |||
| Mg + MgF2 | 20 wt% Mg | 12 h | La0.9Ba0.1F2.9 prepared by milling LaF3 and BaF2 for 4 h before |
| 20 wt% MgF2 | |||
| 50 wt% La0.9Ba0.1F2.9 | |||
| 10 wt% C black |
Cell preparation
Test cells were prepared by pressing together three-layered pellets (7 mm diameter) of anode/electrolyte/cathode materials. The three layers were pressed for ca. 1 min using a desktop press (International Crystal Laboratory). The thickness of each layer was approximately 300 μm, 750 μm and 100 μm for the anode, electrolyte and cathode layer, respectively. A scanning electron micrograph of the pellet cross-section is shown in the ESI (Fig. S1†). The pellets were then spring-loaded in a modified Swagelok-type cell using stainless steel current collectors.Electrochemical testing
For cycling experiments, the cells were heated to ca. 150 °C using band heaters. The charge and discharge steps were performed using an Arbin BT 2000 (16 channels) battery tester. The current density applied was ca. 4 mA g−1 (10 μA cm−2) for all tests. The capacities were calculated referring to the weight of the active material in the cathode (Bi or Cu only), as anode active materials were used in excess.X-ray diffraction (XRD)
XRD measurements were performed using a Bruker D8 Advance instrument with Cu Kα radiation. Rietveld refinement was performed using MAUD software (Materials Analysis Using Diffraction) developed by L. Lutterotti.20 XRD patterns were measured directly at the back of the cathode side of the pellets used for electrochemical testing.X-ray photoelectron spectroscopy (XPS)
For the XPS measurements, a PHI 5800 MultiTechnique ESCA System (Physical Electronics) was employed. The spectra were acquired using monochromatic Al Kα (1486.6 eV) radiation with a detection angle of 45°, using pass energies at the analyzer of 93.9 and 29.35 eV for survey and detail spectra, respectively. Charging of the samples was neutralised with electrons from a flood gun (current 3 μA). The binding energy of the XPS peaks was referenced to the C(1s) signal of adventitious carbon at 284.8 eV.Results and discussion
Fully discharged CeF3 anode vs. a Bi cathode
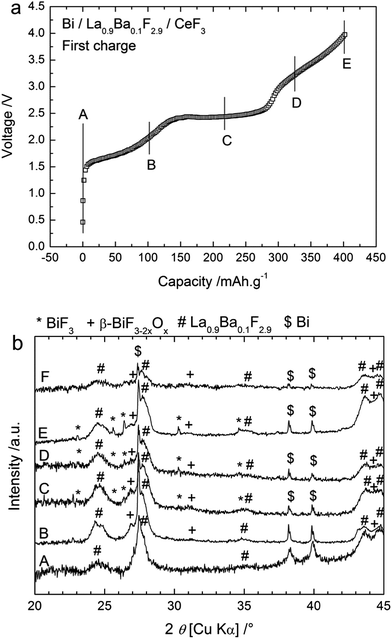
CeF3 was first tested as an anode material using metallic Bi as the cathode and La0.9Ba0.1F2.9 as the electrolyte. Bi was chosen because of the good cycling properties obtained when studying the cycling behaviour of a BiF3 cathode against a Ce metal anode.6 The cells were prepared as three-layered pellets and the charge and discharge cycles were performed at 150 °C to ensure sufficient ionic conductivity in the solid electrolyte. Fig. 1a shows the evolution of the voltage during the first charge obtained with a cut-off potential of 4 V. The open circuit voltage (OCV) values measured before charging were very low (0.1 to 0.4 V) and the voltage values increased slowly when applying the charge current. The charge process seemed to be composed of three steps with first a slow increase of the voltage up to 2.4 V, then a rather flat plateau up to ca. 3 V, and finally another slow increase of the voltage from ca. 3.1 to 4 V. The capacity obtained for the first charge to 4 V was 404 mA h g−1 (referred to the active material in the cathode) which is higher than the theoretical capacity of the Bi/BiF3 cathode (385 mA h g−1 when referring to the mass of Bi only), indicating that side reaction(s) occurred during the first charge.To identify the processes in the different steps described above, charging was stopped at different voltages as indicated in Fig. 1a and the respective pellets were analysed by XRD. The resulting XRD patterns are given in Fig. 1b. After the cathode composite preparation by ball milling (before charging), two phases were observed: the electrolyte La0.9Ba0.1F2.9 and the active material Bi. Both phases displayed broad diffraction peaks in agreement with the small crystallite sizes (16 nm for La0.9Ba0.1F2.9 and 37 nm for Bi) that are usually obtained after ball milling. After charging to 2 V, new peaks appeared which are attributed to β-BiF3−2xOx with a cubic (fluorite) structure (0.41 ≤ x ≤ 0.52).21 This phase is assumed to result from the fluorination of the Bi2O3 phase present in the starting Bi powder (approx. 19 wt% detected by XRD, see ESI Fig. S2†). The cell parameter of the oxyfluoride determined by Rietveld refinement was 5.78 Å, which is smaller than the value of 5.85 Å reported for x = 0.51. Note that the high-temperature phase of Bi2O3 (x = 3/2) existing above 730 °C also shows a fluorite-type structure with a lattice parameter of 5.66 Å. Hence, assuming a decrease of the cell parameter with increasing O content, a higher quantity of oxygen than x = 0.51 is expected in the cathode material. After charging to 2.5 V, peaks corresponding to BiF3 were detected in addition to this β-BiF3−2xOx phase. The cell parameter for β-BiF3−2xOx was 5.81 Å in that case, indicating a higher quantity of fluorine in this phase. The two phases BiF3 and β-BiF3−2xOx were also observed after charging to 3.2 V but with somewhat higher intensities. In contrast, after charging to 4 V, no new phase appeared in the XRD pattern so that the charging step from 3.2 to 4 V likely corresponds to the formation of BiF5 from the BiF3 phase previously formed during the second step. The formation of BiF5 could explain the high capacity obtained during first charging. The structure reported for BiF5 (orthorhombic I4/m) gives diffraction peaks that are overlapping with those of BiF3 and this phase may be unstable explaining why we could not observe it by XRD.
Note that for all XRD patterns, the presence of unreacted Bi was detected although the capacity measured suggested a complete charge reaction (the measured value was above the theoretical capacity). It likely corresponds to bulk Bi inside the particles that could not be reached and converted during charging. This assumption is in agreement with the capacity value measured after the second step (slightly below 300 mA h g−1), which corresponds to an incomplete conversion of Bi into BiF3 and with the formation of the BiF5 in the third step from BiF3 obtained during the second step. It is difficult to evaluate the relative content of each phase from the XRD measurements because of the low intensity of the diffraction peaks. Nevertheless, Rietveld refinement of the XRD patterns tended to indicate that the relative quantity of BiF3 increased after charging to 3.2 V compared to after charging to 2.5 V.
These results suggest the following three-step reaction path during charging to 4 V. The first charging step (below ca. 2.4 V) leads to the formation of β-BiF3−2xOx, likely from the fluorination of the Bi2O3 phase present in the starting Bi powder. Generally, the fluorination of oxides is expected to occur at a higher voltage than the fluorination of metals because of the higher oxidation states involved. However, in the present case, the oxidation state is not changed due to a substitutional fluorination (O atoms are replaced by F atoms), Bi remains in the 3+ oxidation degree so it is possible that the fluorination of Bi2O3 occurs at a lower voltage than that of Bi. Nevertheless, some electrons are exchanged during this reaction although the oxidation state of Bi remains constant as the fluorination process involves the reaction of Bi2O3 with F anions. Unfortunately, thermodynamic data are missing for the compound β-BiF3−2xOx and we could not calculate the electromotive force (emf) for this step. The second step (plateau at 2.5–2.7 V) is the formation of BiF3 from Bi; the plateau voltage is in agreement with the theoretical electromotive force of the Bi/BiF3 redox couple vs. Ce/CeF3 (2.66 V). The third step (>3.2 V) may correspond to the formation of BiF5 from freshly converted BiF3.
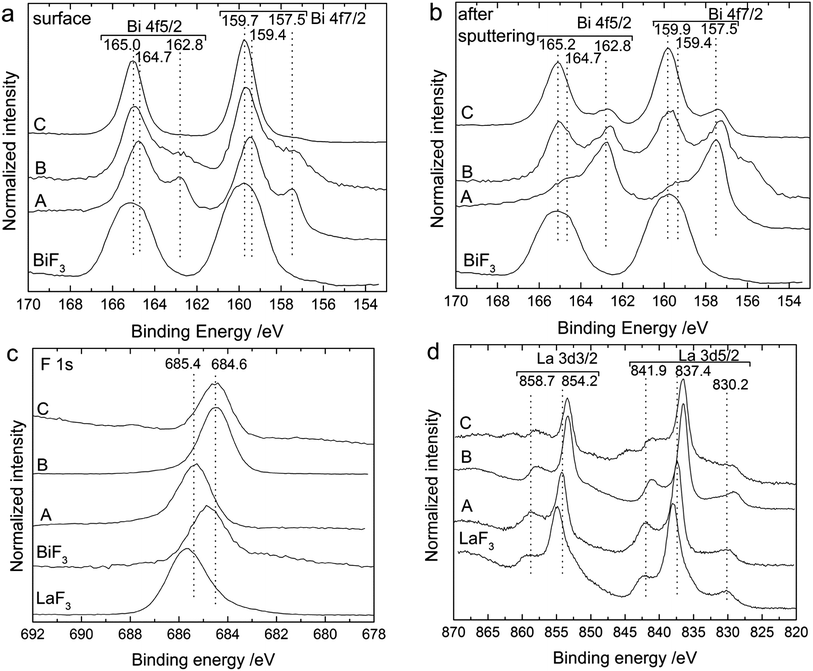
XPS measurements on the back sides of the cathodes confirmed the formation of new fluoride compounds in the cathode after charging the pellets to different voltages (Fig. 2). The spectra measured for the Bi 4f binding energy region for the (untreated) surface and after short sputtering of the outer layer are shown in Fig. 2a and 2b. After the cell preparation (for the as-milled cathode material), the surface of the cathode was composed of two Bi compounds reflected by two doublet peaks for the Bi 4f7/2 and Bi 4f5/2 states. The doublet at 157.5 eV and 162.8 eV binding energies and with the lower intensity can be ascribed to metallic Bi; the doublet at 159.4 eV and 164.7 eV likely corresponds to Bi2O3.22 After sputtering of the outer surface, the peak positions remained similar for the two doublets but the intensity ratio was opposite, pointing to an oxide enrichment of the surface, which was reduced by sputtering.
After charging to 2.5 V, the XP spectra still showed two doublets. The first one corresponding to metallic Bi (157.5 and 162.8 eV) was still at the same position, while the second one shifted to slightly higher binding energies, to 159.7 and 165.0 eV (159.9 and 165.2 eV after sputtering). After charging to 3.2 V, the first peak doublet related to metallic Bi was not detected anymore, while the second one continued to shift to higher binding energies (159.7 and 165.0 eV). The shift of the second component to higher binding energy confirms the formation of fluorinated Bi compounds as the binding energy values of these peaks are in good agreement with a spectrum measured for pure BiF3 (Fig. 2a and b) and with the values given by Morgan et al.22 Interestingly, upon charging, the charge reaction occurred through the complete cathode composite and not only at the cathode/electrolyte interface, as it can be detected on the outer surface. Unfortunately, we could not distinguish between the BiF3 and β-BiF3−2xOx phases by XPS, as their binding energies are similar.23 However, the presence of these two compounds may explain the slight shifts in binding energies observed after charging (to 2.5 or 3.2 V) and after subsequent sputtering at the surface. The presence of the oxyfluoride phase can be assumed at the surface where a significant amount of Bi2O3 was detected before charging, but not afterwards.
XP spectra of the F 1s (Fig. 2c) and La 3d (Fig. 2d) regions were also measured for additional information. The F 1s spectrum displayed one main peak at 685.4 eV after milling, which results from the LaF3-based electrolyte present in the composite. After charging, the binding energy of this peak decreased to 684.6 eV. This peak position agrees well with the binding energy measured for the F 1s peak of a BiF3 reference (see Fig. 2c). Therefore, this shift could also indicate the formation of BiF3. The La 3d spectrum remained essentially unchanged before and after charging, indicating that the electrolyte added to the cathode composite did not react when charged to 3.2 V. The peak energies for the as-prepared cathode at 841.9, 837.4 and 830.2 eV for the La 3d5/2 level and 858.7 and 854.2 eV for the La 3d3/2 level, as well as the spectrum shape are in agreement with the spectrum measured for a pure LaF3 compound (see Fig. 2d).24,25 The binding energy values are slightly higher than for the pure LaF3 material, but we assume that slight shifts in the peak energies can occur for the composite material due to the BaF2 doping of the material. In addition, the peak shape is quite different from the spectra measured for LaOF24 or La2O3 (ref. 26) compounds excluding any major oxygen contamination in our samples.
The cycling behaviour of a Bi/La0.9Ba0.1F2.9/CeF3 cell in the first cycles is depicted in Fig. 3 using different charge cut-off potentials, i.e. for different conversion states of Bi. In each case, the capacity during the first discharge was very low with a maximum of 20 mA h g−1 when using a 3.2 or 4 V cut-off potential during the first charge while only half of this value was obtained using a 3.5 V cut-off potential. The origin of this difference has been unclear so far, although this observation was reproducible. After stopping the charging at 3.2 or 3.5 V, the discharge voltage profile was composed of a single plateau at ca. 2 V when charging took place up to 3.2 V, and ca. 1.6 V after charging up to 3.5 V. In both cases, the following charge was composed of two plateaus at ca. 2.5–2.6 V and 3.1–3.5 V. After charging to 4 V in the first run, the first discharge was composed of two steps, first a steep decrease of the voltage between 3.7 and 2.3 V and then a sloping plateau around 2 V. The second charge was also composed of two plateaus, again around 2.5–2.6 V and between 3.2 and 4 V. Following the reaction process described for the first charge, we assume that the discharge plateau at around 2 V corresponds to the conversion of BiF3 into Bi. This was confirmed by XRD, which showed that after the first discharge (following charge to 3.2 V) the peaks related to BiF3 disappeared almost completely (Fig. 1b), while β-BiF3−2xOx was still detected. Therefore, during the following charging, the first plateau at ca. 2.5–2.6 V reflects, like in the first charging process, the conversion of Bi into BiF3. The second charging plateau at higher voltage (ca. 3.5 V) may be attributed again to the formation of BiF5, as assumed for the third step of the first charge. The conversion of BiF5 into BiF3 when first charging to 4 V could explain the first discharge step between 3.7 and 2.3 V, which are too high voltage values for the conversion of BiF3 into Bi. The absence of a charge plateau corresponding to β-BiF3−2xOx from the second cycle indicated the irreversibility of this phase during discharge.
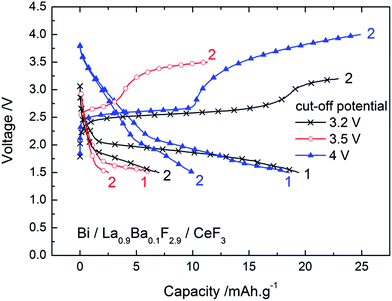 | ||
| Fig. 3 Voltage–composition profiles for the Bi/La0.9Ba0.1F2.9/CeF3 cell in the two first cycles (1st charges are given in Fig. S3, see ESI†). The charge/discharge curves were obtained at 150 °C for a current density of ca. ±4 mA g−1. | ||
Thus, during discharge, only BiF3 converts back into Bi, which would explain the lower capacity found during discharge as only one step is reversible. Another interesting feature is the sharpening of the diffraction peaks corresponding to Bi (Fig. 1b). The melting point of Bi is relatively low (271 °C) and the experiments were performed at 150 °C. It is therefore likely that this elevated temperature favoured the grain growth of the Bi phase in the cathode during cycling. This growth may be detrimental to the overall cycling performance as there is loss of reactive interfaces between the different phases of the cathode composite. It could also explain the remaining of unreacted Bi, which was observed by XRD and XPS after charging and could correspond to the core of the converted BiF3 particles. Finally, the volume change during fluorination (Table S1†) is also a typical degradation factor for conversion materials, although it is rather limited for Bi/BiF3.
Fully discharged CaF2 and MgF2 anodes vs. a Bi cathode
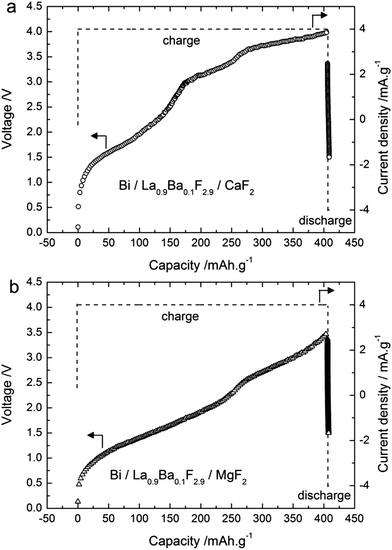
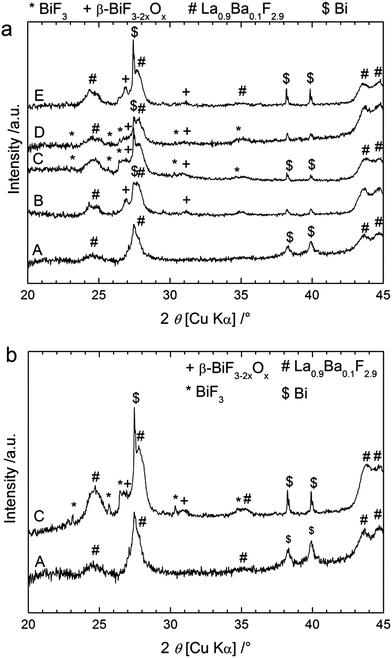
Similar experiments were performed using CaF2 and MgF2 as anode materials (Table 1). The theoretical electromotive force (emf) values for Bi/BiF3 against a Ca/CaF2 cell is 3.16 V (Table S1†), so the charge was performed up to 4 V cut-off potential (Fig. 4a) when using this anode material. The charge capacity was 406 mA h g−1, again above the theoretical value of Bi/BiF3 (Table S1†). Similar to the observations for CeF3 as the anode precursor material, we observed three regions in the charging curves with higher voltage values, in agreement with the higher electropositive nature of Ca/CaF2 compared to Ce/CeF3 (Table S1†). The XRD patterns measured after charging to different potentials (Fig. 5a) confirmed a similar reaction pathway, with first the formation of β-BiF3−2xOx (the only phase observed at 3.2 V) and then the formation of BiF3 (at 3.5 to 4 V) with remaining unreacted Bi. The origin of the third step above 3.6 V is again not clear from the XRD results but we assume that BiF3 formed during the second step further converts into BiF5, as in the previous system. Unfortunately, after this first charge it was not possible to subsequently discharge the cell. The voltage decreased rapidly when applying the discharge current and capacity values below 5 mA h g−1 were measured. No further cycling was possible.The theoretical emf value for a cell Bi/BiF3 against Mg/MgF2 is 2.64 V close to the value obtained for CeF3, therefore the cut-off potential for charging was set to 3.5 V (Fig. 4b). The charge capacity measured was 406 mA h g−1 using MgF2 as the starting material for the anode. This value is again higher than the theoretical capacity of Bi/BiF3, and hence is an indication that a side reaction occurred during charging. We could not observe any voltage plateau but we could observe an inflexion in the voltage profile around 2.5 V which could indicate the presence of two reaction steps. The XRD pattern measured after charging to 3.5 V (Fig. 5b) shows the formation of β-BiF3−2xOx and BiF3. By analogy with the results observed for the other anode materials, we assume that the first region (<2.5 V) corresponds to the formation of β-BiF3−2xOx and the second one (>2.5 V) to the formation of BiF3. However, the capacity achieved when reaching 2.5 V was much higher than with the CeF3 or CaF2 anode, approx. 265 mA h g−1, which is too high for the conversion of Bi2O3 to β-BiF3−2xOx only (theoretical capacity value is 230 mA h g−1 for x = 0.5).
In addition, the total capacity was above the theoretical value for Bi/BiF3. Thus, it is likely that we also had here three steps during charging with the conversion into β-BiF3−2xOx, BiF3 and BiF5 but that these steps could not be distinguished clearly during charging due to the lack of plateaus. Also for this anode material, we could detect the presence of unreacted Bi after charging by XRD. As for the CaF2 anode, the following discharge capacity was really low and no further cycling was possible.
After the first discharge, XRD patterns measured for the cell with CaF2 as the anode (Fig. 5a) show that BiF3 peaks preferentially disappeared compared to β-BiF3−2xOx peaks. Nevertheless, we could still clearly see both fluoride phases after discharge explaining the low capacity value measured during discharge and indicating the difficulty in reversing the reaction in this case. At this stage it was not possible to analyse the anode material after charge and discharge because it was used in excess and we assume that reactions only occurred at the interface between the electrolyte and the anode which cannot be probed by XRD or XPS. One explanation for the lack of reversibility compared to the CeF3 anode may be the high reactivity of Ca or Mg (e.g. towards O2) formed in the anode after charging, which could prevent the reverse conversion of the corresponding fluoride compounds. More investigations are planned to test this hypothesis.
Composite Mg + MgF2 anodes vs. a Bi cathode
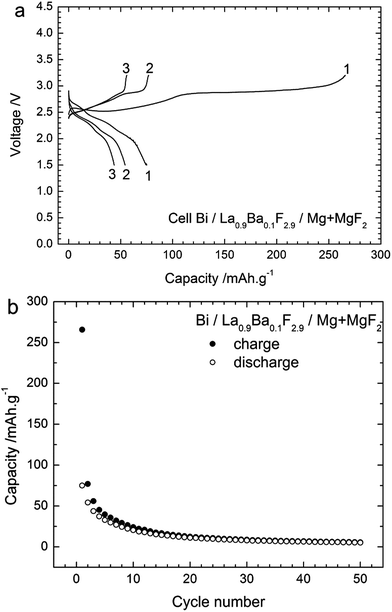
The first results obtained using fully discharged anodes show the reversible cycling of a FIB using a CeF3 anode. However, the capacities were low, and almost no reversibility was found with MgF2 or CaF2 anodes. Some claims were made that magnesium anodes could be used for a reversible FIB but the operating temperatures were expected to be much higher.27 This is likely related to the poor reactivity of MgF2 and also its poor conductivity properties. Baukal28 has already described the benefits of mixing the discharge and charge products in the electrode to prepare more reactive interfaces. Following this idea, we prepared a new composite anode by mixing Mg and MgF2 with the electrolyte and carbon (Table 1). The cycling performances of this Mg + MgF2 anode can be seen in Fig. 6, using 3.2 V as the cut-off potential for charging.The OCV value measured on the as-built cell was ca. 1.8 V which was a much higher value than obtained previously, probably due to the presence of Mg, which creates a new redox couple and allows equilibrating thermodynamically. Fig. 6a shows the voltage profiles measured during the first three cycles. The first charge proceeded as described for the other anode materials with two subsequent steps up to 3.2 V. The first one was a plateau around 2.5 V, much less sloping than found with the other anode materials. The second step was a plateau around 2.9 V. The charge capacity obtained was 266 mA h g−1; below the theoretical value of the Bi/BiF3 couple.
During the following discharge, three steps were identified in the voltage profile: a first one with a sloping plateau around 2.7 V, then a second flat plateau around 2.4 V and finally a third one around 2.1 V. In the next cycles, the first charge plateau became shorter and steeper and the second plateau at ca. 2.9 V tended to disappear. In the following discharges, the first step disappeared while the two following ones still occurred but for shorter durations. The cycling behaviour during the 50 first cycles is given in Fig. 6b. After the first charge, the capacities obtained during charge and discharge became rather similar, but decreased rapidly with the cycling number.
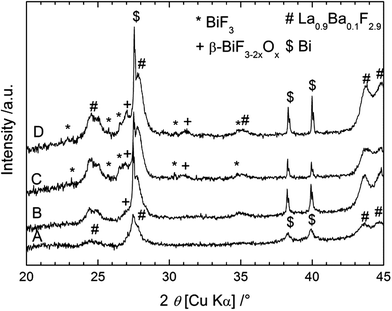
XRD was performed on the cathode material after different cycling stages; the measured patterns are shown in Fig. 7. After charging to 2.85 V (towards the end of the first plateau), only small peaks corresponding to β-BiF3−2xOx could be detected in the XRD pattern. After charging to 3.2 V, two new phases appeared in the XRD patterns: BiF3 and β-BiF3−2xOx, which were also obtained using the other anode materials. The cell parameter for β-BiF3−2xOx was 5.83 Å as determined by Rietveld refinement which indicates a higher content of F (lower x) in this phase compared to the cell with the CeF3 anode (a = 5.81 Å). The presence of unreacted Bi could be again detected in all XRD patterns as expected from the capacity value, which is below the theoretical value of Bi/BiF3. Considering the results described above with the CeF3 anode, the charging process using a Mg + MgF2 anode resembles the formation of β-BiF3−2xOx from Bi2O3 present in the as-milled cathode (plateau around 2.5 V) and then the formation of BiF3 from Bi (plateau around 2.9 V). When stopping the charging at 3.2 V, we could not observe the third step described in the first section with the formation of BiF5, but it was present when charging to 4 V (not shown). The plateau voltages upon charging were slightly higher than those obtained previously which may have several origins, leading to higher kinetic barriers, including higher resistance or lower conductivity. Upon cycling, we observed a sharpening of the diffraction peaks for Bi, which could again be related to grain growth. After the discharge, the two fluoride phases could still be detected, but an accurate quantification was not possible using only the XRD measurements.
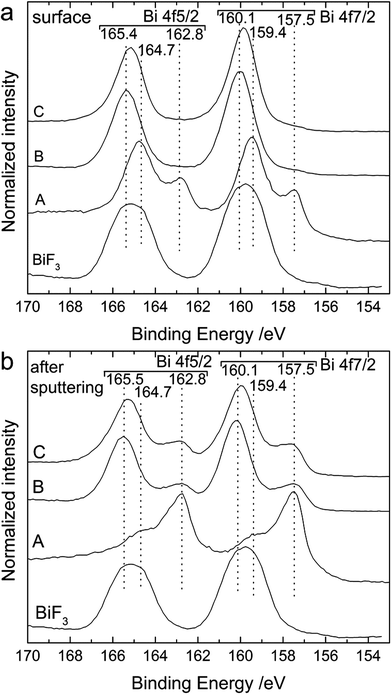
Additionally, we analysed the surface of the back side of the cathode by XPS (Fig. 8). On the outer surface (Fig. 8a), we could clearly see the shift of the Bi 4f peaks towards higher binding energies after charging. As discussed above, before cycling the surface was composed of metallic Bi (157.5 and 162.8 eV) and Bi2O3 (159.4 and 164.7 eV). In the charged state, only one doublet was present at 160.0 and 165.4 eV, which is attributed to a mixture of BiF3 and β-BiF3−2xOx as already described for Fig. 2. The same doublet was still present after discharge. Below the top surface layer (after sputtering), two doublets were present after charging corresponding to Bi (157.5 and 162.7 eV) and unreacted BiF3 (160.1 and 165.5 eV), respectively. These two doublets were still present after discharge but the intensity ratio BiF3![[thin space (1/6-em)]](https://www.rsc.org/images/entities/char_2009.gif) :
:![[thin space (1/6-em)]](https://www.rsc.org/images/entities/char_2009.gif) Bi slightly decreased indicating an increased amount of Bi. The absence of Bi at the surface after discharge and the limited increase of the BiF3
Bi slightly decreased indicating an increased amount of Bi. The absence of Bi at the surface after discharge and the limited increase of the BiF3![[thin space (1/6-em)]](https://www.rsc.org/images/entities/char_2009.gif) :
:![[thin space (1/6-em)]](https://www.rsc.org/images/entities/char_2009.gif) Bi ratio below the top layer indicate that the conversion of BiF3 into Bi during discharge was mainly taking place at the interface of the electrode to the electrolyte, while the top layers were not fully converted. This could at least partly explain the low discharge capacity. Surprisingly, the first charging encompassed the entire cathode thickness and the charge capacity reached 70% of the theoretical value.
Bi ratio below the top layer indicate that the conversion of BiF3 into Bi during discharge was mainly taking place at the interface of the electrode to the electrolyte, while the top layers were not fully converted. This could at least partly explain the low discharge capacity. Surprisingly, the first charging encompassed the entire cathode thickness and the charge capacity reached 70% of the theoretical value.
Summarizing the different results, the reaction process for a Bi/La0.9Ba0.1F2.9/Mg + MgF2 cell during charging is composed of two steps corresponding to two voltage plateaus: the formation of β-BiF3−2xOx from Bi2O3 at ca. 2.5 V and the formation of BiF3 from Bi at ca. 2.9 V. During discharge, a plateau at ca. 2.7 V appears only during the first cycle and corresponds either to a side reaction (but no BiF5 was formed during charge) or to kinetic effects that could not be clearly identified here. Then, a second plateau at 2.4 V can be attributed to the conversion of BiF3 into Bi as described previously for the CeF3 anode and finally the last plateau at 2.1 V may correspond to the release of F from β-BiF3−2xOx rather than the reverse conversion into Bi2O3 (not detected by XRD or XPS). This last step would be in agreement with the slight decrease of the cell parameter of β-BiF3−2xOx from 5.83 Å after charge to 5.82 Å after discharge, determined by Rietveld refinement.
Overall, the better cycling performance obtained starting from a half-discharged composite Mg + MgF2 anode compared to CeF3 is mainly related to the better discharge behaviour. In this case, it is possible to reverse at least partially the two steps of charging from Bi2O3 to β-BiF3−2xOx and from Bi to BiF3 whereas only the conversion of BiF3 into Bi was possible with CeF3. This may be related to the higher content of F (lower x) in the β-BiF3−2xOx when charging against Mg + MgF2, which implies a higher quantity of F available for discharge. In addition, the unchanged XP spectra measured on the outer surface of the cathode after charging and discharging indicate that the discharge reaction occurs mainly at the cathode/electrolyte interface and does not reach the full cathode layer. This incomplete reaction is in agreement with the lower discharge capacities compared to the charge capacities, indicating that the discharge process suffers from more or higher kinetic barriers than charging. Finally, compared to the performance using MgF2 alone as the anode, the improvement is striking as no discharge was obtained in the latter case. The presence of Mg in the starting anode composite appears to be a key component although its role at this point is unclear. One possibility is the availability of Mg from the starting anode composite during discharge, whereas the metallic Mg formed during charging in the MgF2 anode may not be accessible for discharge. This could be due to oxidation (formation of a MgO inert layer at the surface) or due to contact losses because of volume change during charge (+40% from Mg to MgF2, Table S1†). In addition, the presence of Mg could improve the conductivity (ionic and/or electronic), or the interface contacts between the different reacting phases.
Composite Mg + MgF2 anodes vs. a Cu cathode
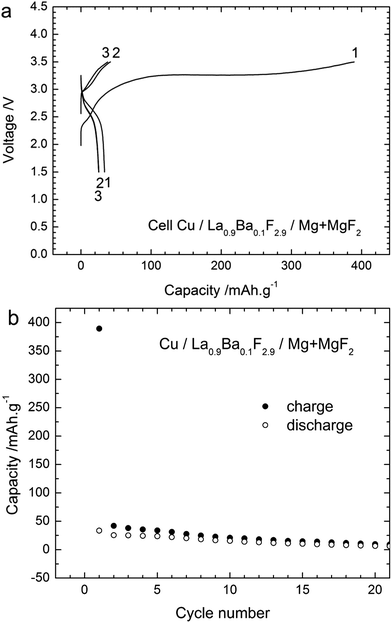
Additionally, the performance of another cathode material, in this case Cu, was studied using the composite Mg + MgF2 as the anode. Cu as the cathode material has some advantages compared to Bi as the theoretical capacity of the Cu/CuF2 couple is higher (843 mA h g−1 referring to the mass of Cu) and the emf is also higher (2.98 V vs. Mg/MgF2) compared to the Bi/BiF3 couple (Table S1†). Fig. 9 gives the voltage profiles during cycling and the evolution of the capacity upon cycling for a Cu/La0.9Ba0.1F2.9/Mg + MgF2 cell. The open circuit voltage measured after assembling the cell was close to 1.8 V, similar to what was observed with the Bi cathode. The first charge was mainly composed of a single voltage plateau at around 3.25 V in agreement with the emf of the Cu/CuF2 couple vs. Mg/MgF2. The first charge capacity was 390 mA h g−1 lower than the theoretical capacity indicating an incomplete reaction. The capacity faded rapidly during the following cycles, the first discharge capacity was only 33 mA h g−1 and it was below 20 mA h g−1 after the 10th cycle. Both charging and discharging were only composed of a single voltage plateau corresponding to a single reaction, in contrast to what was observed for the Bi cathode. Note that the preparation of cells using a Cu cathode and a CeF3 or CaF2 anode failed. No charging was possible and only the formation of Cu2O could be detected after applying charge currents to the cells (not shown) with a voltage of around 1.8–2 V. Using Mg + MgF2 as the anode, the measured voltage was superior to this value already from the OCV which could probably allow avoiding this side reaction. The origin of oxygen is not clear at this point, but it could be attributed to the carbon added in the composite which could still contain minor amounts of water after drying.Again, XRD measurements (Fig. 10) were performed to understand the reactions during charging and discharging. Before charge (after milling), only two phases were observed, namely the active material Cu and the electrolyte La0.9Ba0.1F2.9, whose reflections overlapped. Note that it was not possible to detect the presence of Cu2O which was present in the as-received Cu powder (see ESI, Fig. S2†). As for the Bi cathode, the diffraction peaks were broadened, indicative of a small crystallite size: 17 nm for La0.9Ba0.1F2.9 and 13 nm for Cu. After charging, some weak peaks appeared which correspond to CuF2, and confirm the charge reaction. The diffraction peaks corresponding to Cu overlap with those of the electrolyte but from the ratio of the reflections at 43.3° (Cu + La0.9Ba0.1F2.9) and at 44.4° (La0.9Ba0.1F2.9 only), it can be concluded that the quantity of pure Cu decreased in the cathode. As expected from the charge capacity value, the reaction from Cu to CuF2 was not complete. After discharge, the peaks corresponding to CuF2 disappeared, but peaks corresponding to Cu2O could be observed. These results show that the charge reaction from Cu to CuF2 was partly reversible; the formation of Cu2O after discharge can explain the large decrease of the capacity in the following cycles. In contrast with the Bi cathode, there seems to be only a weak growth of the Cu grains (crystallite size of 40 nm calculated after one cycle), due to its higher melting point (1083 °C). This limited grain growth should not hamper further reactions as sufficient reactive interfaces should still be available in the Cu cathode during cycling. However, the transformation from Cu to CuF2 involves a very large volume change (ca. 192%, Table S1†) that likely leads to contact losses in the cathode material. These losses could also explain the rapid degradation of the cell performance upon cycling.
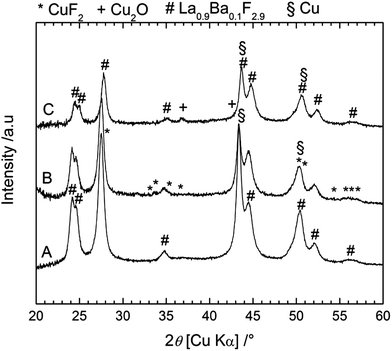 | ||
| Fig. 10 XRD patterns measured on the back side of the cathode for a Cu/La0.9Ba0.1F2.9/Mg + MgF2 cell before charging (A), after charging to 3.5 V (B) and after discharge (C). | ||
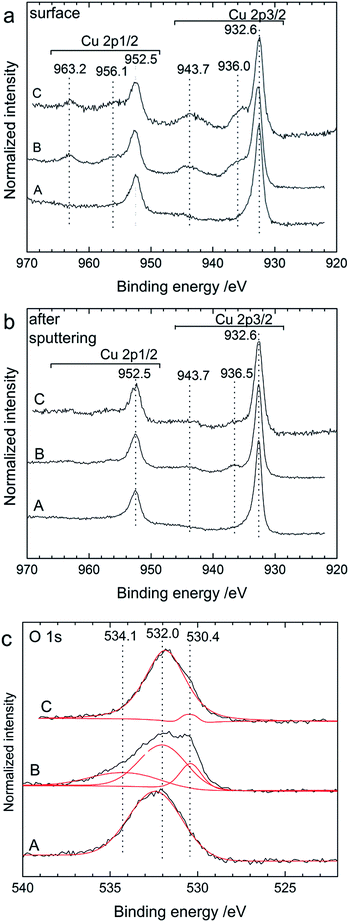
Additional XPS experiments (Fig. 11) were performed on the cathode side of cycled pellets to confirm the reaction mechanism. The spectra measured for the Cu 2p energy region confirmed the formation of CuF2 after charging. For the as-milled cathode material (at the surface and after sputtering), only one doublet was obtained at 932.6 eV for the Cu 2p3/2 level and at 952.5 eV for the Cu 2p1/2 level (Fig. 11a and b) which correspond to the presence of metallic Cu.29 It is important to note, however, that the peak doublet corresponding to Cu2O has been reported for exactly the same binding energy value as for metallic Cu29 so the presence of such an oxide cannot be ruled out here. Cu2O was present in the starting Cu powder (see ESI, Fig. S2†), indeed, although it cannot be detected by XRD in the as-prepared cathode material. After charging the cell to 3.5 V, an additional peak doublet at 936.0 and 956.5 eV could be clearly seen which represents the main lines of CuF2, while the peaks at 943.7 and 963.2 eV are the satellite features of CuF2.30 As for the Bi cathode, it is interesting to note that the presence of CuF2 could be detected through the complete pellet as it was seen at the surface layer of the cathode back side. After charging, there were still pronounced peaks corresponding to metallic Cu in agreement with the incomplete transformation of Cu into CuF2 also observed by XRD and the charge capacity which was measured to be below the theoretical value.
After discharge, the presence of CuF2 could still be detected at the surface, whereas it almost completely disappeared after sputtering. The presence of remaining CuF2 at the surface after discharge indicates that the reversible conversion of CuF2 into Cu during discharge had mostly taken place close to the interface between the cathode and the electrolyte. This can partly explain the lower discharge capacity measured during discharge. Again, the main peak doublet at 932.6 and 952.5 eV is likely a combination of the contributions from unreacted metallic Cu and Cu2O, which were detected by XRD. The presence of Cu2O could be confirmed by the analysis of the O 1s energy region. At the surface, the O 1s spectra were all composed of a large peak centred around 532 eV (not shown), which is probably related to the presence of various oxides from the different electrode components (e.g. native oxide layers). After sputtering the outer layer, the spectra measured after different cycling stages showed differences (Fig. 11c). A broad peak at 532 eV remained as the main contribution. The total amount of oxygen in the surface region was, however, drastically reduced after sputtering. After charging, the O 1s peak could be fitted with two more contributions at 534.1 and 530.4 eV. The contribution at 534.1 eV could not be identified at this stage but such high energy values usually correspond to adsorbed oxide or hydroxide compounds.31 The contribution at 530.4 eV could be ascribed to the presence of Cu2O,29 which was still present after discharge, indicating that this compound was actually not formed during discharge as observed by XRD but already during charge. Note that the presence of Cu2O cannot be clearly resolved in the initial as-milled Cu cathode, although its contribution may be hidden in the broad main peak. Hence, the ball milling process largely removed the oxide layer present in the initial Cu powder.
To summarise the different results, we show that it is possible to reversibly charge and discharge a Cu cathode using a half-discharged Mg + MgF2 composite electrode as the starting anode. During charging, a single reaction occurs leading to the formation of CuF2 and during discharge this reaction is partly reversible. However, such a cell shows a rapid decrease of the capacity during cycling which could be explained by the formation of Cu2O as the side product and probably from contact losses due to the volume expansion during the formation of CuF2. Therefore, it is necessary to improve the electrode architecture to compensate/solve these issues and enhance the cycling performance of such a FIB.
Conclusions
Batteries based on a fluoride shuttle have very high theoretical energy densities and could be attractive as alternatives to Li-ion batteries in certain applications. So far, only a few studies have been published reporting on reversible charge/discharge processes in such new systems. In this work, we demonstrate for the first time the reversible charge and discharge of a FIB starting from electrodes in the discharged state. After the first charging, where the cathode was almost fully reacted, cycling was possible for several cycles, however, with a rapid decrease of the capacities upon cycling. The best cycling performance was obtained using a half discharged anode made of a composite of MgF2, Mg, electrolyte and carbon. The temperature used here, 150 °C, was much lower than the values given previously for operating a Mg anode. These results are quite encouraging as the electrolyte and electrode preparations were not yet optimised. Several factors may explain the rapid degradation of the electrode properties and the decrease of capacity. They are mainly related to an incomplete discharge process and probably due to a loss of the initial morphology of the nanocomposite consisting of an intimate mixture of all reactants that facilitates the reactions. In the case of the Bi cathode, this is linked to the grain growth in the Bi phase that limited the reaction rate, not all of the active material was reached. In addition, for this cathode material, the formation of the β-BiF3−2xOx phase was observed upon charging, but could not be totally discharged afterwards. For the Cu cathode, it was possible to keep the nanostructure of Cu but there was likely a large fraction of active material that could not react because of contact loss, due to large volume expansion, and the formation of Cu2O. To further improve the properties of the cathode materials, a more sophisticated preparation of the electrode structure is necessary, which allows us to maintain the original nanostructure for preserving good contacts between the active phases. At this point, the structure of the anode material could not be investigated in detail and more experiments are in progress to understand the reactions occurring at the anode and to improve the overall performances. Finally, this work opens new routes for the preparation of electrode materials not only using a solid electrolyte but also for FIBs working with a liquid electrolyte. In the latter case, the ionic conductivity of the electrolyte is expected to be better as well as the contacts between the electrodes and electrolyte. Nevertheless, issues concerning the reactivity of the different phases and/or interfaces within the electrodes, to ensure efficient conversion reactions between the metal and the metal fluoride, remain.Acknowledgements
Financial support by the State of Baden-Württemberg, Project house e-drive (#PHed.L.0208.01) is gratefully acknowledged. We also would like to thank N. Schwarzburger for her assistance in the preparation and transfer of the XPS samples.Notes and references
- X. Zhao, S. Ren, M. Bruns and M. Fichtner, J. Power Sources, 2013, 245, 706–711 CrossRef PubMed.
- P. Hartmann, C. L. Bender, M. Vračar, A. K. Dürr, A. Garsuch, J. Janek and P. Adelhelm, Nat. Mater., 2013, 12, 228–232 CrossRef CAS PubMed.
- H. D. Yoo, I. Shterenberg, Y. Gofer, G. Gershinsky, N. Pour and D. Aurbach, Energy Environ. Sci., 2013, 6, 2265–2279 CAS.
- C.-X. Zu and H. Li, Energy Environ. Sci., 2011, 4, 2614 CAS.
- J. Cabana, L. Monconduit, D. Larcher and M. R. Palacín, Adv. Mater., 2010, 22, E170–E192 CrossRef CAS PubMed.
- M. Anji Reddy and M. Fichtner, J. Mater. Chem., 2011, 21, 17059–17062 RSC.
- C. Rongeat, M. Anji Reddy, R. Witter and M. Fichtner, J. Phys. Chem. C, 2013, 117, 4943–4950 CAS.
- A. Düvel, J. Bednarcik, V. Sepelák and P. Heitjans, J. Phys. Chem. C, 2014, 118, 7117–7129 Search PubMed.
- W. Puin, S. Rodewald, R. Ramlau, P. Heitjans and J. Maier, Solid State Ionics, 2000, 131, 159–164 CrossRef CAS.
- B. Ruprecht, M. Wilkening, A. Feldhoff, S. Steuernagel and P. Heitjans, Phys. Chem. Chem. Phys., 2009, 11, 3071–3081 RSC.
- N. Sata, K. Eberman, K. Eberl and J. Maier, Nature, 2000, 408, 946–949 CrossRef CAS PubMed.
- C. Rongeat, M. Anji Reddy, R. Witter and M. Fichtner, ACS Appl. Mater. Interfaces, 2014, 6, 2103–2110 CAS.
- F. Gschwind, Z. Zhao-Karger and M. Fichtner, J. Mater. Chem. A, 2014, 2, 1214–1218 CAS.
- J. H. Kennedy and J. C. Hunter, J. Electrochem. Soc., 1976, 123, 10–14 CrossRef CAS PubMed.
- J. Schoonman, J. Electrochem. Soc., 1976, 123, 1772–1775 CrossRef CAS PubMed.
- J. Schoonman and A. Wolfert, J. Electrochem. Soc., 1981, 128, 1522–1523 CrossRef CAS PubMed.
- J. Schoonman and A. Wolfert, Solid State Ionics, 1981, 3–4, 373–379 CrossRef CAS.
- A. A. Potanin, Russ. Chem. J., 2001, 45, 61–66 Search PubMed.
- Y. Danto, G. Poujade, J. D. Pistré, C. Lucat and J. Salardenne, Thin Solid Films, 1978, 55, 347–354 CrossRef CAS.
- L. Lutterotti, http://www.ing.unitn.it/%7Emaud/, 2011.
- A. Morell, B. Tanguy and J. Portier, Bull. Soc. Chim. Fr., 1971, 7, 2502–2504 Search PubMed.
- W. E. Morgan, W. J. Stec and J. R. Van Wazer, Inorg. Chem., 1972, 12, 953–955 CrossRef.
- M. Wang, Q.-L. Huang, X.-T. Chen and X.-Z. You, Mater. Lett., 2007, 61, 4666–4669 CrossRef CAS PubMed.
- D. Barreca, A. Gasparotto, C. Maragno, E. Tondello, E. Bontempi, L. E. Depero and C. Sada, Chem. Vap. Deposition, 2005, 11, 426–432 CrossRef CAS.
- K. H. Park and S. J. Oh, Phys. Rev. B: Condens. Matter Mater. Phys., 1993, 48, 14833–14842 CrossRef CAS.
- P. Burroughs, A. Hamnett, A. F. Orchard and G. Thornton, J. Chem. Soc., Dalton Trans., 1976, 17, 1686–1698 RSC.
- W. Baukal, R. Knodler and W. Kuhn, Chem. Ing. Tech., 1978, 50, 245–249 CrossRef CAS.
- W. Baukal, Electrochim. Acta, 1974, 19, 687–694 CrossRef CAS.
- J. Ghijsen, L. H. Tjeng, J. van Elp, H. Eskes, J. Westerink, G. A. Sawatzky and M. T. Czyzyk, Phys. Rev. B: Condens. Matter Mater. Phys., 1988, 38, 11322–11330 CrossRef CAS.
- G. van der Laan, C. Westra, C. Haas and G. A. Sawatzky, Phys. Rev. B: Condens. Matter Mater. Phys., 1981, 23, 4369–4380 CrossRef CAS.
- K. Koshmak, A. Banshchikov, T. Vergentev, M. Montecchi, D. Ceolin, J. P. Rueff, N. S. Sokolov and L. Pasquali, J. Phys. Chem. C, 2014, 118, 10122–10130 CAS.
Footnote |
| † Electronic supplementary information (ESI) available: A table giving the most relevant theoretical properties of the electrode active materials. A scanning electron micrograph of the pellet used for electrochemical measurements, the XRD patterns of the starting Bi and Cu powders and the voltage profiles of the first charging obtained for the various anode materials with different cut-off potentials. See DOI: 10.1039/c4ta02840f |
| This journal is © The Royal Society of Chemistry 2014 |

